el cerebro social por pablo billeke
TRANSCRIPT
El Cerebro Social Aproximación de las neurociencias al estudio de la habilidades
sociales
Pablo Billeke División de Neurociencia
CICS – UDD
Presentación
• Introducción • ¿Por qué estudiar el cerebro social?
• Métodos de investigación • ¿Cómo estudiar el cerebral social?
• Redes cerebrales sociales • ¿Cuáles son los componentes del cerebro social?
• Investigación de toma de decisión sociales • ¿Qué aplicación puede tener el estudio del cerebro social?

Introdución
¿Por qué estudiar el cerebro social ?


Neocorteza en primates
34
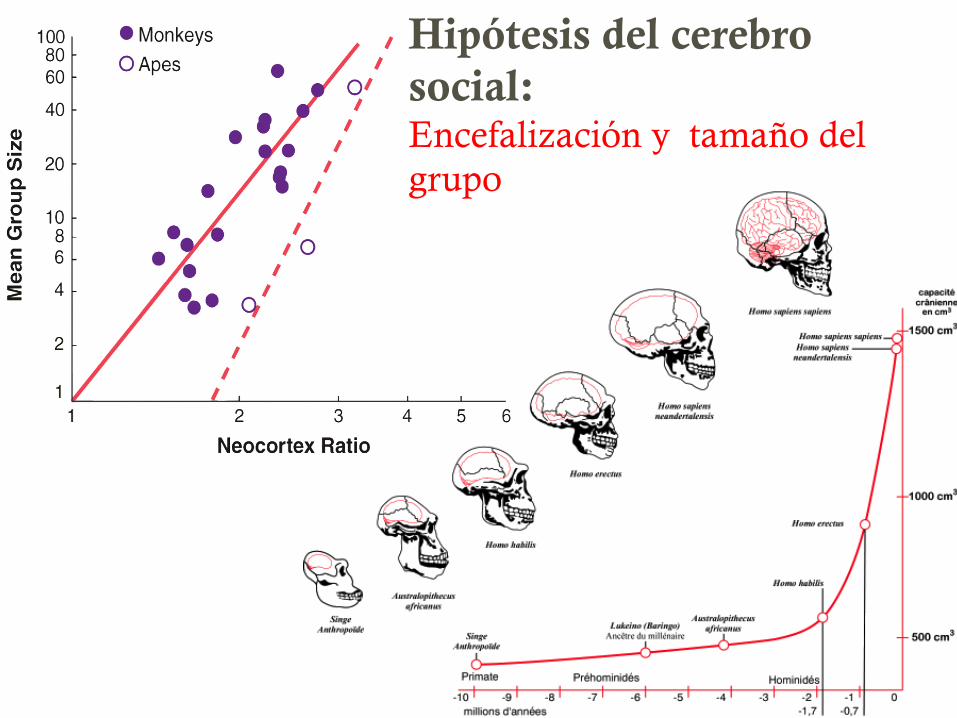
Hipótesis del cerebro social: Encefalización y tamaño del grupo

Inteligencia Social
• Tempranamente en el desarrollo (2.5ª), el dominio de las habilidades sociales nos diferencian del resto de los primates
1. Herrmann, E., Call, J., Hernàndez-Lloreda, M. V., Hare, B. & Tomasello, M. Humans have evolved specialized skills of social cognition: the cultural intelligence hypothesis. Science 317, 1360–1366 (2007).
tested on 5 days within a 2-week period, and theapes were tested on consecutive days, averaginga total of 8 days. Chimpanzees and orangutanswere tested in a familiar room, and humanchildren were tested in a child laboratory andaccompanied by a parent who was told not toinfluence or help in any way. To measure thecomfort level of participants in the test situation(because this could be a mediator of theirperformance in the PCTB), we also gave subjects(within the first 4 days of testing) a temperamenttest designed to assess their reaction to novelobjects, people, and rewards (25) (tables S6 andS7). All testing was videotaped.
For most of the tasks, a human experimenter(E1) sat behind a table facing the subject througha Plexiglas window (children and some apes) or amesh panel (apes only). The window had threeholes at different positions, through whichsubjects could insert a finger to indicate theirchoice when necessary (figs. S1 and S2). On alltrials, E1 always waited until the subject wasfacing her before beginning a trial. For trialsrequiring a choice, the position of the reward wascounterbalanced across either two or threelocations (depending on the task) but the rewardwas never hidden for more than two consecutivetrials in the same place. In a few tasks, subjectswere tested in other setups, requiring them to dosuch things as to use a simple tool, follow gazedirection, or gesture to E1 (25).
Subjects’ responses were initially coded liveby E1 except for gaze-following trials, which E1
coded from videotape after the test. A secondobserver independently scored (from videotape)100% of the trials for human children andchimpanzees and 20% of the trials for orangutans.The inter-observer agreement for all tasks com-bined was 98% for orangutans, 99% for chim-panzees, and 99% for human children (table S4).
Results. Figure 1 presents the results at themost general level of analysis. Averaging acrossall of the tasks in the physical domain, humansand chimpanzees were correct on ~68% of thetrials, whereas orangutans were correct on ~59%of the trials (the absolute values are not especiallymeaningful because some tasks had a 50 or 33%chance of success by guessing, and some taskshad no possibility for guessing). Statistically, thehumans and chimpanzees did not differ from oneanother in the physical domain, but they wereboth more skillful than the orangutans (P < 0.001in both cases). In the social domain, a verydifferent pattern emerged. Averaging across allof the tasks in the social domain, the humanchildren were correct on ~74% of the trials,whereas the two ape species were correct abouthalf as often (33 to 36%of the trials). Statistically,the humans were more skillful than either of thetwo ape species (P < 0.001 in both cases), whichdid not differ from one another.
Figure 2 presents the results at the level of thesix scales. In the physical domain, there were nodifferences among species on the quantities scale.On both the space and causality scales, however,humans and chimpanzees did not differ from
one another, but both were more skillful thanorangutans (P < 0.001 in all cases). The dif-ference between chimpanzees and orangutansremained even after controlling for age (25). Inthe social domain, the pattern was again differentfrom the physical domain and the same for allthree of the scales. Human children were moreskillful than either of the ape species in each ofthe three social scales (P < 0.001 in all cases), andthe apes did not differ from one another.
Table 2 lists species’ performance on the 16different tasks within each of the scales (note thatsocial learning is a scale and a task). The overallpattern is that within the physical domain, humanchildren and chimpanzees eachwere better at sometasks than the other, with orangutans often repre-senting an outlier. Within the four spatial tasks,children were better than chimpanzees at one task(object permanence), whereas the chimpanzeesoutperformed the children at another task (trans-position). In terms of quantities, all three specieswere similar at judging which of two quantities islarger, but chimpanzees were better than both ofthe other species at combining quantities in orderto make a judgment. Children were better thanboth ape species at the three causality tasks inwhich a judgment must be made before manipu-lation or choice, whereas chimpanzees were betterthan children and orangutans at the one causalitytask involving active tool use. Within the socialdomain, again the pattern was very different. Aspredicted, the human children were consistentlymore skillful than both of the ape species (at five
Fig. 1. Physical domain (A) andsocial domain (B). The box plotsshow the full distribution of theproportion of correct responses forphysical and social domains of thePCTB for each species: median,quartiles, and extreme values. Boxesrepresent the interquartile rangethat contains 50% of values (rangefrom the 25th to the 75th percent-ile). The line across the box indicatesthe median. The whiskers representmaximum and minimum values,excluding outliers [indicated bycircles, at least 1.5 times the inter-quartile range (i.e., 1.5 box lengthsfrom the upper or lower edge of thebox)] and extremes [indicated byasterisks, at least 3 times the inter-quartile range (i.e., >3 box lengths from the edge)]. Statistical comparisonson each domain were made by multivariate analysis of variance (MANOVA),followed by analysis of variance (ANOVA) tests for each domain. Post-hoctests (the Bonferroni correction was used when the equality of variancesassumption holds, and the Dunnett t3 correction was used otherwise)followed in case a significant effect was detected. Performance on the PCTBas a whole differed significantly across species (MANOVA with species andgender as between-subject factors and performance in both domains of thePCTB as the dependent variables; Wilk’s Lambda: F4,472 = 123.965, P <0.001, h2 = 0.51). No statistically significant differences were detectedbetween genders, but there was an interaction between species and gender(Wilk’s Lambda: F4,472 = 2.815, P < 0.025, h2 = 0.02). Univariate analyses(ANOVA) showed that the differences across species were significant for both
domains: physical (F2,237 = 19.921, P < 0.001, h2 = 0.14) and social (F2,237 =311.224, P < 0.001, h2 = 0.72). Univariate analyses for the interactionbetween species and gender revealed that there was a significant interactionfor the physical domain (F2,237 = 5.451, P = 0.005, h2 = 0.04) but not for thesocial domain (F2,237 = 0.224, P = 0.799). Post-hoc tests (Dunnett t3correction) revealed that humans and chimpanzees performed better thanorangutans in the physical domain (for both P < 0.001, with no differencebetween humans and chimpanzees). However, post-hoc tests (Dunnett t3correction) showed that human children outperformed both chimpanzeesand orangutans in the social domain (both P < 0.001). Post-hoc tests for theinteraction between species and gender in the physical domain showed thatfemale children were better than male children (P = 0.001). No other genderdifferences were found.
A Physical domain
prop
ortio
n of
cor
rect
res
pons
es
0.00
0.20
0.40
0.60
0.80
1.00
B Social domain
prop
ortio
n of
cor
rect
res
pons
es
human chimpanzee orangutan human chimpanzee orangutan
0.00
0.20
0.40
0.60
0.80
1.00
7 SEPTEMBER 2007 VOL 317 SCIENCE www.sciencemag.org1362
RESEARCH ARTICLES
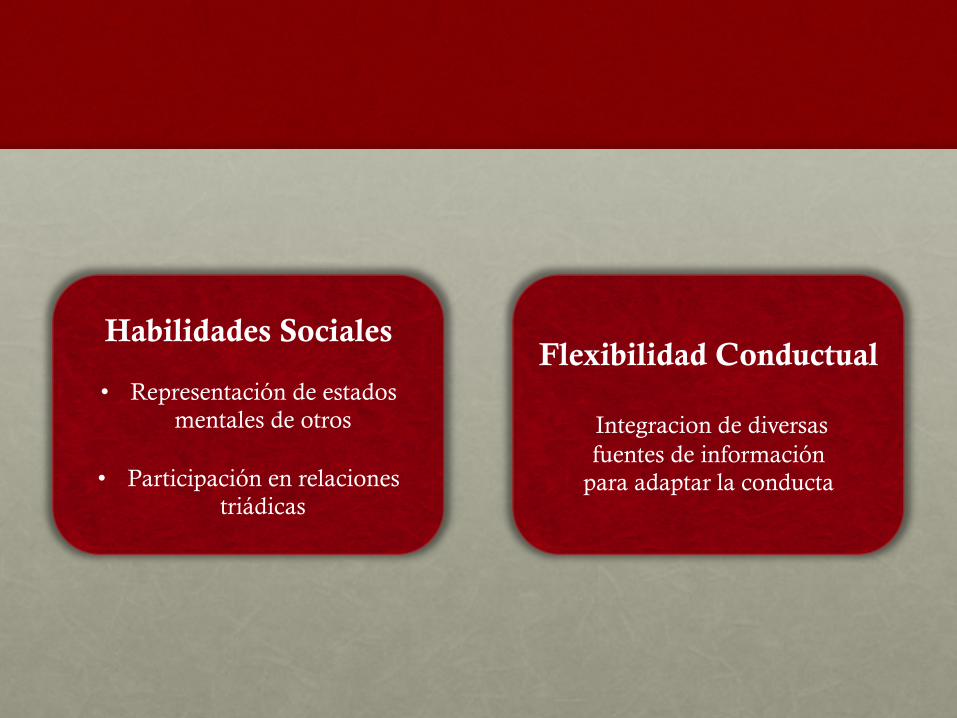
Flexibilidad Conductual
Integracion de diversas fuentes de información
para adaptar la conducta
Habilidades Sociales
• Representación de estados mentales de otros
• Participación en relaciones triádicas

Métodos de Investigación
¿Cómo estudiar el cerebro social?

Métodos en Neurociencia Social
• Comportamiento
• Lenguaje
• Toma de decisiones
Conducta
MODELO
Procesos psíquicos
Procesos cognitivos
Estados mentales
Predisposiciones morales
Actividad Biológica
• Activiadad eléctrica cerebral
• Activiadad metabólica cerebral
• Movimientos oculares
• Dilatación pupilar …
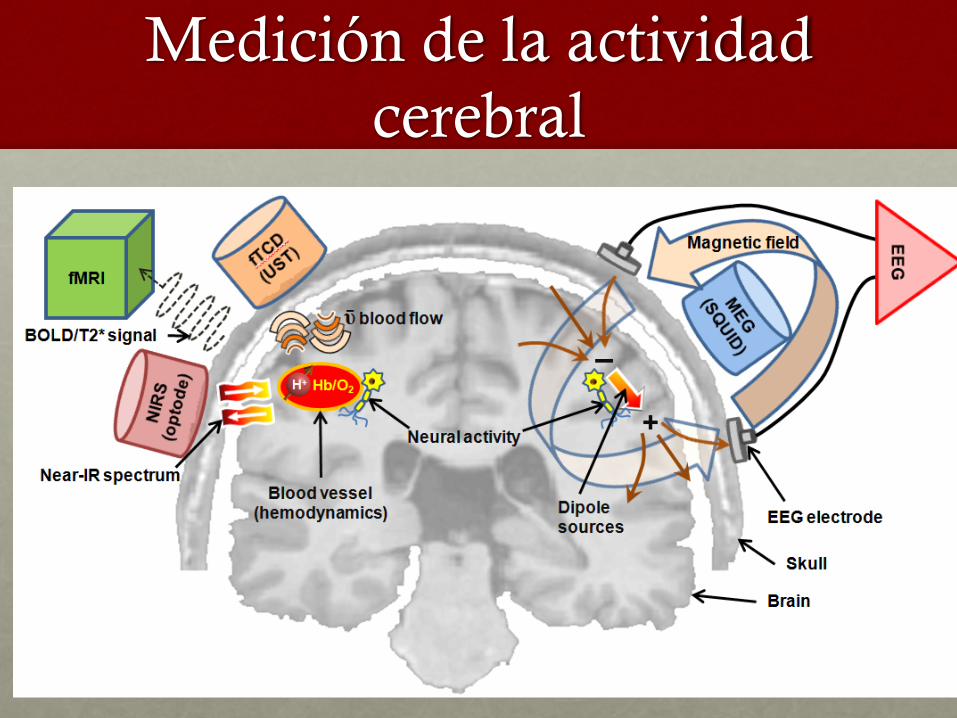
Medición de la actividad cerebral
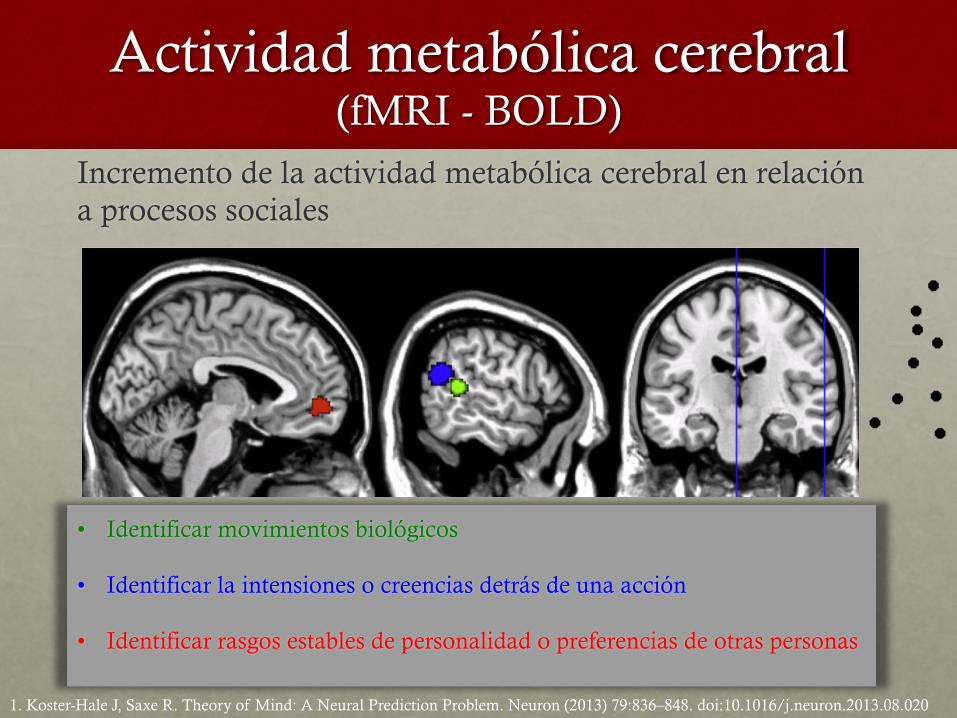
Actividad metabólica cerebral (fMRI - BOLD)
Incremento de la actividad metabólica cerebral en relación a procesos sociales
• Identificar movimientos biológicos
• Identificar la intensiones o creencias detrás de una acción
• Identificar rasgos estables de personalidad o preferencias de otras personas
1. Koster-Hale J, Saxe R. Theory of Mind: A Neural Prediction Problem. Neuron (2013) 79:836–848. doi:10.1016/j.neuron.2013.08.020

Actividad eléctrica cerebral (EEG - MEG)
Cambios en la actividad eléctrica al observar o saber que otras personas sufren dolor
1. Riečanský I, Paul N, Kölble S, Stieger S, Lamm C. Beta oscillations reveal ethnicity ingroup bias in sensorimotor resonance to pain of others. Soc Cogn Affect Neurosci (2015) 10:893–901. doi:10.1093/scan/nsu139
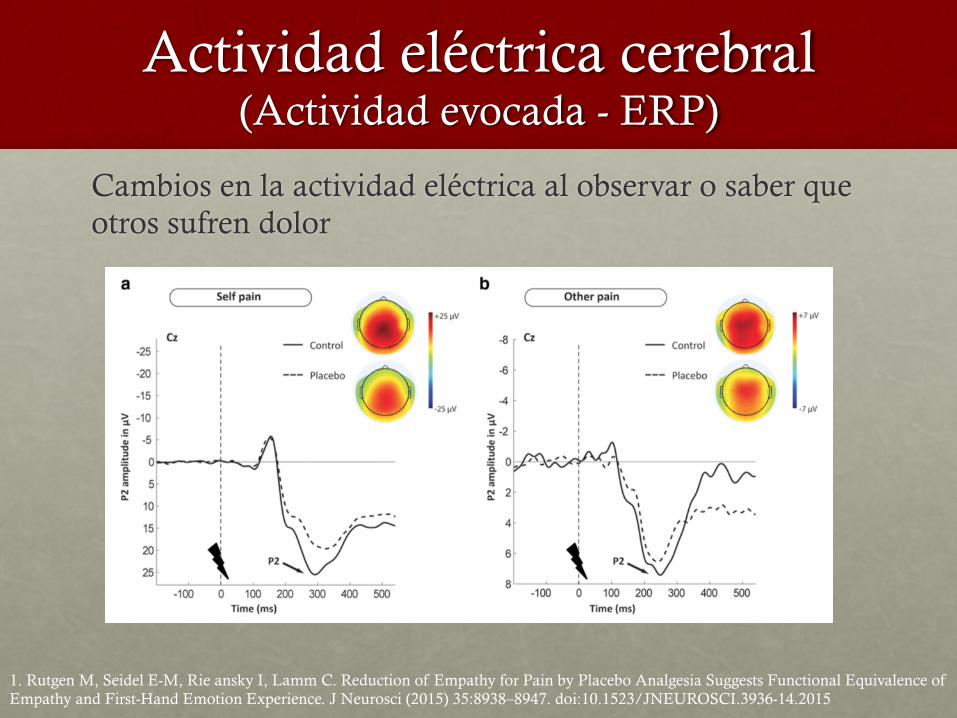
Actividad eléctrica cerebral (Actividad evocada - ERP)
Cambios en la actividad eléctrica al observar o saber que otros sufren dolor
1. Rutgen M, Seidel E-M, Rie ansky I, Lamm C. Reduction of Empathy for Pain by Placebo Analgesia Suggests Functional Equivalence of Empathy and First-Hand Emotion Experience. J Neurosci (2015) 35:8938–8947. doi:10.1523/JNEUROSCI.3936-14.2015

Actividad eléctrica cerebral (Actividad oscilatoria)
Cambios en la actividad eléctrica al observar o saber que otros sufren dolor
1. Riečanský I, Paul N, Kölble S, Stieger S, Lamm C. Beta oscillations reveal ethnicity ingroup bias in sensorimotor resonance to pain of others. Soc Cogn Affect Neurosci (2015) 10:893–901. doi:10.1093/scan/nsu139
2. Billeke P. Negociación social : cómo nuestro cerebro se anticipa a las decisiones de otras personas. Cienc Cogn (2015) 9:22–25.

Redes cerebrales implicadas en los procesamientos
sociales
¿Cuáles son los componentes del cerebro social?
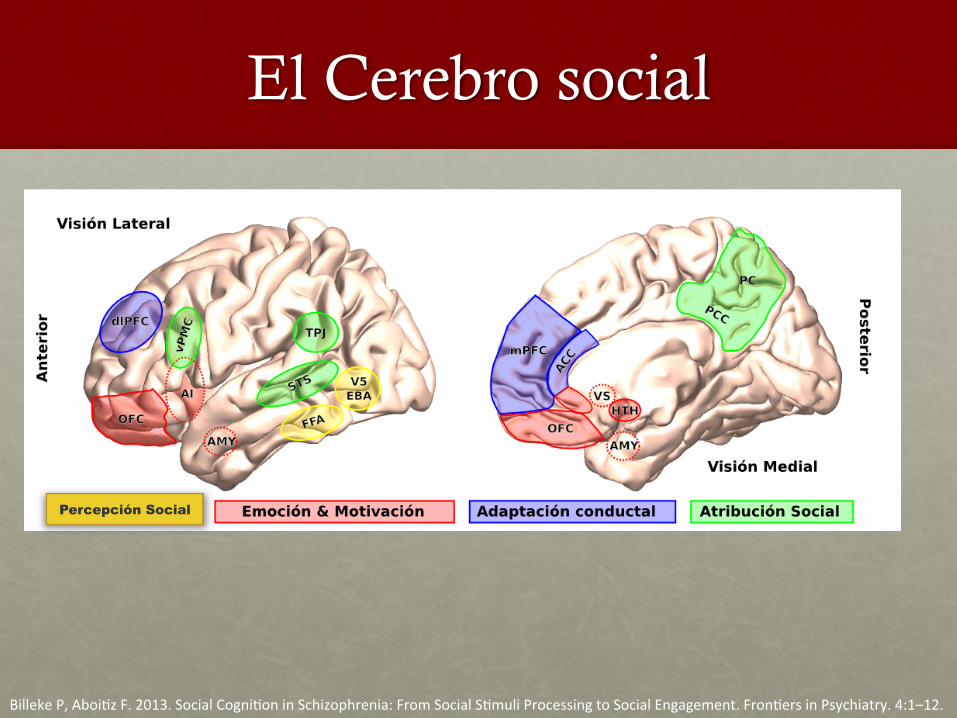
El Cerebro social
BillekeP,Aboi,zF.2013.SocialCogni,oninSchizophrenia:FromSocialS,muliProcessingtoSocialEngagement.Fron,ersinPsychiatry.4:1–12.
Percepción Social
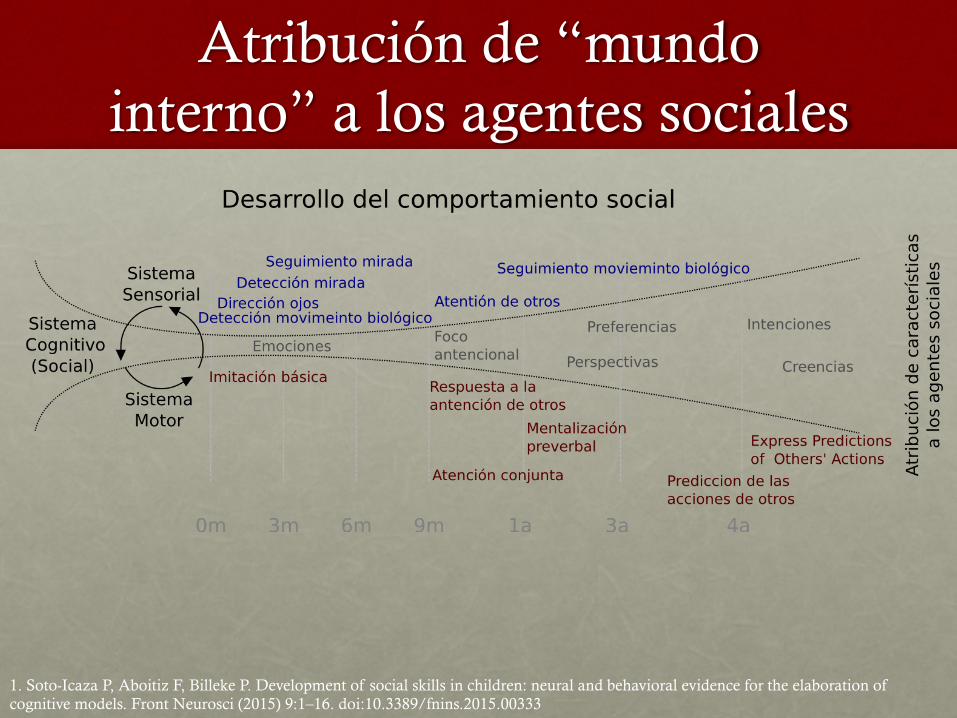
Atribución de “mundo interno” a los agentes sociales
1. Soto-Icaza P, Aboitiz F, Billeke P. Development of social skills in children: neural and behavioral evidence for the elaboration of cognitive models. Front Neurosci (2015) 9:1–16. doi:10.3389/fnins.2015.00333
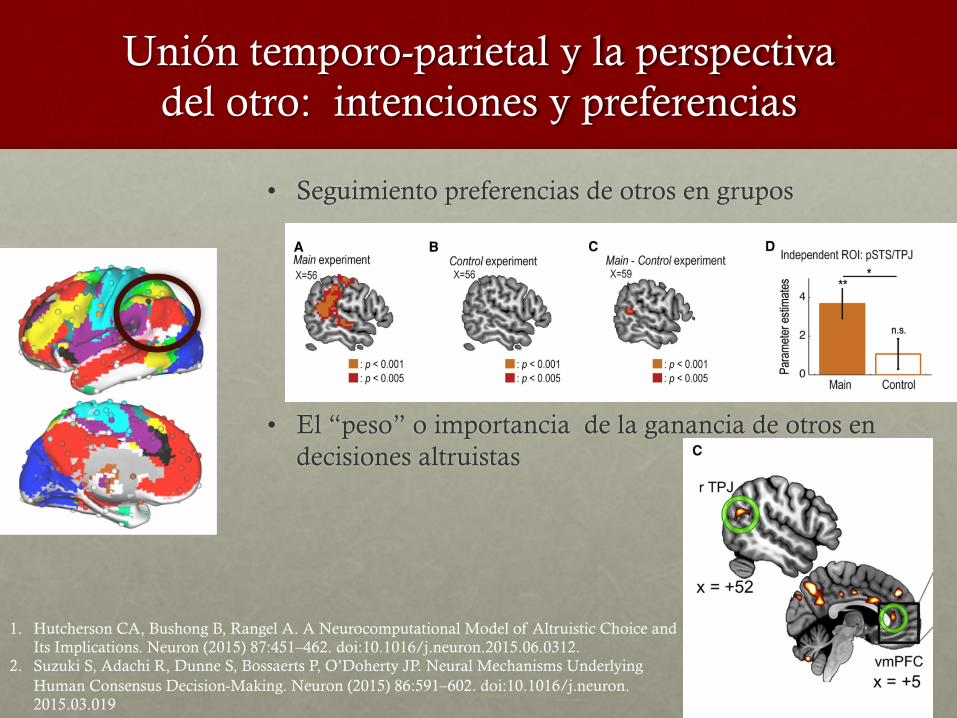
Unión temporo-parietal y la perspectiva del otro: intenciones y preferencias
• Seguimiento preferencias de otros en grupos
• El “peso” o importancia de la ganancia de otros en decisiones altruistas
augmentation by subject motion (Power et al., 2011). Third, aswill be seen shortly, voxelwise graphs are dominated at higherthresholds by short-distance relationships, which are logicallypartially artificial based on the above considerations. Modifiedvoxelwise networks are presented in which all ties terminatingwithin 20 mm of a source node are excluded, though otherdistances (e.g., 15 mm and 25 mm) were also tested, with similarresults (data not shown).The two standard methods of graph formation were parcel-
based and voxel-based. The parcel-based graph was formedusing the 90-parcel AAL atlas (Tzourio-Mazoyer et al., 2002),a popular method of graph formation. This atlas divides thecortex and subcortical structures into parcels based uponanatomical landmarks. The voxel-based graph was definedusing all voxels within the AAL atlas (n = 40,100), and the modi-fied voxelwise graph was also defined using these voxels.
Comparing Networks: Correspondence betweenSubgraphs and Functional SystemsSubgraphs were determined over a range of thresholds for eachgraph using one of the best-performing subgraph detectionalgorithms currently available (Infomap) (Fortunato, 2010; Ros-vall and Bergstrom, 2008). This algorithm uses the map equationto minimize information theoretic descriptions of random walkson the graph (essentially assigning zip codes to subgraphs to
Figure 1. Areal Subgraph Structure Is HighlySimilar across Cohorts and Subgraph Structure IsSimilar between Areal and Modified VoxelwiseGraphsTop left: A spring embedded layout of the areal graph at
4% tie density visualizing the graph and the basis for
subgraphs.
Top right: For both cohorts, plots are shown of the areal
assignments into subgraphs (colors) at tie densities from
10% down to 2% in 1% steps. ROI ordering is identical,
and all subgraphs with fewer than four members are
colored white. The standard measure of subgraph
similarity, normalized mutual information, between node
assignments of the cohorts at identical tie densities
ranged from 0.86 to 0.92, indicating highly similar patterns
across cohorts (1 = identical assignments, 0 = no infor-
mation shared between assignments).
Bottom: subgraphs from three thresholds are shown
for the areal (spheres) and modified voxelwise graphs
(surfaces). Note the similarity of subgraph assignments
between networks, despite the great difference in network
size and cortical coverage, even in different subjects (main
versus replication cohorts). All areal subgraphs with fewer
than four members are colored white, and all modified
voxelwise subgraphs with fewer than 100 voxels are
colored white. Areal networks are shown at 10%, 3%, and
2% tie density (r > 0.16, 0.30, and 0.33), and modified
voxelwise networks are shown at 5%, 2%, and 0.5% tie
density (r > 0.16, 0.23, and 0.31).
shorten addresses of individual nodes). Otheralgorithms were tested and yielded similarresults (Figure S2).
Figure 1 illustrates ourmethodology and high-lights several important results. The first panel
depicts the areal graph in a spring embedded layout and mapssubgraphs onto nodes using colors, visibly demonstrating thebasis for subgraphs. In spring embedded layouts, ties act assprings to position nodes in space such that well-connectedgroups of nodes are pulled together, providing an intuitive andinformative picture of the graph. The second panel shows thesubgraph assignments of the areal network in both cohortsover a range of thresholds (each chart consists of 9 columns of264 color entries). ROIs are ordered identically for both cohorts,and the patterns of subgraph assignment across cohorts are ingood agreement. The standard graph theoretic measure ofsimilarity between two sets of node assignments is normalizedmutual information (NMI), which measures how much informa-tion one set of assignments provides about another set ofassignments. Values of 1 indicate identical assignments, andvalues of 0 indicate that no information is gained about thesecond set of assignments by knowing the first. Betweencohorts, NMI ranges from 0.86 to 0.92 across thresholds, indi-cating very similar assignments.The subgraph charts contain subgraphs whose composition
remains quite constant over thresholds (e.g., the horizontalbands of blue, red, or yellow) as well as subgraphs that arehierarchically refined as thresholds rise (e.g., cyan becomingcyan, orange, pink, and purple). These patterns can be seen onbrain surfaces (Figure 1, bottom) as relatively constant subgraph
Neuron
Functional Brain Networks
Neuron 72, 665–678, November 17, 2011 ª2011 Elsevier Inc. 667
1. Hutcherson CA, Bushong B, Rangel A. A Neurocomputational Model of Altruistic Choice and Its Implications. Neuron (2015) 87:451–462. doi:10.1016/j.neuron.2015.06.0312.
2. Suzuki S, Adachi R, Dunne S, Bossaerts P, O’Doherty JP. Neural Mechanisms Underlying Human Consensus Decision-Making. Neuron (2015) 86:591–602. doi:10.1016/j.neuron.2015.03.019
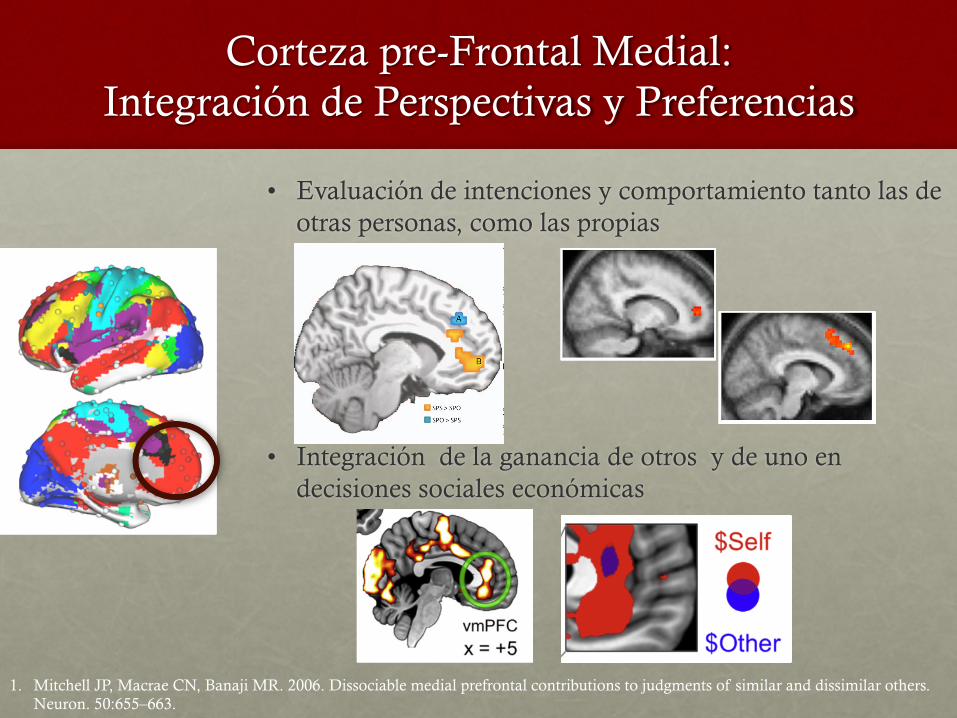
Corteza pre-Frontal Medial: Integración de Perspectivas y Preferencias
• Evaluación de intenciones y comportamiento tanto las de otras personas, como las propias
• Integración de la ganancia de otros y de uno en decisiones sociales económicas
augmentation by subject motion (Power et al., 2011). Third, aswill be seen shortly, voxelwise graphs are dominated at higherthresholds by short-distance relationships, which are logicallypartially artificial based on the above considerations. Modifiedvoxelwise networks are presented in which all ties terminatingwithin 20 mm of a source node are excluded, though otherdistances (e.g., 15 mm and 25 mm) were also tested, with similarresults (data not shown).The two standard methods of graph formation were parcel-
based and voxel-based. The parcel-based graph was formedusing the 90-parcel AAL atlas (Tzourio-Mazoyer et al., 2002),a popular method of graph formation. This atlas divides thecortex and subcortical structures into parcels based uponanatomical landmarks. The voxel-based graph was definedusing all voxels within the AAL atlas (n = 40,100), and the modi-fied voxelwise graph was also defined using these voxels.
Comparing Networks: Correspondence betweenSubgraphs and Functional SystemsSubgraphs were determined over a range of thresholds for eachgraph using one of the best-performing subgraph detectionalgorithms currently available (Infomap) (Fortunato, 2010; Ros-vall and Bergstrom, 2008). This algorithm uses the map equationto minimize information theoretic descriptions of random walkson the graph (essentially assigning zip codes to subgraphs to
Figure 1. Areal Subgraph Structure Is HighlySimilar across Cohorts and Subgraph Structure IsSimilar between Areal and Modified VoxelwiseGraphsTop left: A spring embedded layout of the areal graph at
4% tie density visualizing the graph and the basis for
subgraphs.
Top right: For both cohorts, plots are shown of the areal
assignments into subgraphs (colors) at tie densities from
10% down to 2% in 1% steps. ROI ordering is identical,
and all subgraphs with fewer than four members are
colored white. The standard measure of subgraph
similarity, normalized mutual information, between node
assignments of the cohorts at identical tie densities
ranged from 0.86 to 0.92, indicating highly similar patterns
across cohorts (1 = identical assignments, 0 = no infor-
mation shared between assignments).
Bottom: subgraphs from three thresholds are shown
for the areal (spheres) and modified voxelwise graphs
(surfaces). Note the similarity of subgraph assignments
between networks, despite the great difference in network
size and cortical coverage, even in different subjects (main
versus replication cohorts). All areal subgraphs with fewer
than four members are colored white, and all modified
voxelwise subgraphs with fewer than 100 voxels are
colored white. Areal networks are shown at 10%, 3%, and
2% tie density (r > 0.16, 0.30, and 0.33), and modified
voxelwise networks are shown at 5%, 2%, and 0.5% tie
density (r > 0.16, 0.23, and 0.31).
shorten addresses of individual nodes). Otheralgorithms were tested and yielded similarresults (Figure S2).
Figure 1 illustrates ourmethodology and high-lights several important results. The first panel
depicts the areal graph in a spring embedded layout and mapssubgraphs onto nodes using colors, visibly demonstrating thebasis for subgraphs. In spring embedded layouts, ties act assprings to position nodes in space such that well-connectedgroups of nodes are pulled together, providing an intuitive andinformative picture of the graph. The second panel shows thesubgraph assignments of the areal network in both cohortsover a range of thresholds (each chart consists of 9 columns of264 color entries). ROIs are ordered identically for both cohorts,and the patterns of subgraph assignment across cohorts are ingood agreement. The standard graph theoretic measure ofsimilarity between two sets of node assignments is normalizedmutual information (NMI), which measures how much informa-tion one set of assignments provides about another set ofassignments. Values of 1 indicate identical assignments, andvalues of 0 indicate that no information is gained about thesecond set of assignments by knowing the first. Betweencohorts, NMI ranges from 0.86 to 0.92 across thresholds, indi-cating very similar assignments.The subgraph charts contain subgraphs whose composition
remains quite constant over thresholds (e.g., the horizontalbands of blue, red, or yellow) as well as subgraphs that arehierarchically refined as thresholds rise (e.g., cyan becomingcyan, orange, pink, and purple). These patterns can be seen onbrain surfaces (Figure 1, bottom) as relatively constant subgraph
Neuron
Functional Brain Networks
Neuron 72, 665–678, November 17, 2011 ª2011 Elsevier Inc. 667
1. Mitchell JP, Macrae CN, Banaji MR. 2006. Dissociable medial prefrontal contributions to judgments of similar and dissimilar others. Neuron. 50:655–663.
parametric modulation option integrated in SPM5. Subse-quently, random effects analyses were performed on theparameter estimate of the parametric regressor for the be-havioral response. We used the results of the one-samplet test ( p = .05) reflecting activity modulated by reliving orunderstanding as an inclusive mask to determine whetherthe regions showing activation differences in self versusother self-projection were also sensitive to behavior.
Task-related Functional Connectivity Analysis
Seedvoxels in ventral versusdorsalmPFC thatwere identifiedin our previous analysis on self versus other self-projectionwere further interrogated to examine the task-related net-work of brain regions functionally connected with disso-ciable mPFC regions. We should note that in the presentarticle we refer to dorsal mPFC (z-axis on Talairach atlas:>20 mm) and ventral mPFC (z-axis on Talairach atlas:<20 mm to >−15 mm; e.g., Krueger et al., 2009; VanOverwalle, 2009), however, the particular naming conven-tion may differ among authors (e.g., Buckner, Andrews-Hanna, & Schacter, 2008; Northoff & Bermpohl, 2004).To find these functional connectivity maps, we employeda second analysis based on individual trial activity (Rissman,
Gazzaley, & DʼEsposito, 2004). Specifically, we first createda GLM in which each individual trial was modeled by aseparate covariate, thus yielding different parameter esti-mates for each individual trial and for each individualsubject. The resulting correlation maps were Fisher trans-formed to allow for statistical comparison. Then, to exam-ine differences in functional connectivity of ventral versusdorsal mPFC regions associated with temporal versus men-tal self-projection, we conducted a two-sample t test inSPM5 using an FDR-corrected threshold of p = .05, and atwo-voxel extent threshold.
RESULTS
Behavioral
SPSwas associatedwith amean reliving rating of 5.04 (SD=0.56; RT = 1.42 sec, SD = 0.67), and SPO was associatedwith a mean understanding rating of 4.50 (SD = 0.86; RT =1.35 sec, SD = 0.61). There were no significant differ-ences in the reaction time across the twoconditions (Cohenʼsd = 0.11). The behavioral results suggest that the Sense-Cam images evoked a strong ability to re-experience thepersonal past and to comprehend another individualʼsperspective.
Figure 2. Self-projection of self versus other. There was a dorsal (A) versus ventral (B) distinction in the recruitment of mPFC during self versusother self-projection. BA = Brodmannʼs area.
St. Jacques et al. 1279
In contrast, activation in dorsal mPFC (peak voxel:29,45, 42) was greater during judgments of the target withwhom participants less strongly associated themselves(Figure 2B). That is, participants in the ‘‘similar to liberal’’group demonstrated greater engagement of dorsalmPFC while making judgments of the conservative tar-get, whereas participants in the ‘‘dissimilar from liberal’’group demonstrated greater dorsal mPFC engagementwhile judging the liberal target. This region of dorsalmPFC was the only area that showed greater activationfor dissimilar than similar targets. Confirming that thesetwomPFC regions responded differently as a function oftarget similarity, we observed a highly significant three-way interaction for region (ventralmPFC, dorsalmPFC)3
target (liberal, conservative) 3 participant group (sim-ilar to liberal, dissimilar from liberal), F(1,13) = 26.06,p < 0.0002.These findingswere further supported by correlational
analyses that capitalized on the full range of variability inparticipants’ IAT results. As displayed in Figure 3A, theactivation in ventral mPFC during judgments of the lib-eral target (relative to the conservative target) was signif-icantly correlated with the extent to which a participantassociated self with the liberal target on the postscan-ning IAT, r(14) = 0.54, p < 0.04. That is, the more a partic-ipant associated self with the liberal target (asmeasuredby the IAT), thegreater thedifference in ventralmPFCac-tivation during judgments of the liberal target relative tojudgments of the conservative target. The inverse pat-tern was observed in dorsal mPFC (Figure 3B), suchthat the relative activity during judgments of the liberaltarget was negatively correlated with the extent to whicha participant associated self with the liberal other on theIAT, r(14) =20.72, p < 0.003. That is, the less aparticipantassociated self with the liberal target, the greater the dif-ference in dorsal mPFC activation during judgments ofthe liberal target (relative to judgments of the conserva-tive target). In other words,whereas the response in ven-tral mPFC tracked how similar the participants consid-ered themselves to a target, the response in dorsalmPFC tracked with how dissimilar participants consid-ered themselves from a target.Finally, we examined the overlap between self and
other through a separate analysis in which judgmentsof others were reconditionalized on the basis of the dis-tance between response to other and response for self.We reasoned that participants were relatively likely tohave used knowledge about their own opinions and pre-dilections when making the same response for a targetas for themselves (e.g., judging that a target looked for-ward to returning home for Thanksgiving as much asthey themselves did). Accordingly, judgments of thetwo targets were segregated into (1) those for which
Figure 2. Medial Prefrontal Regions Ob-tained from Random-Effects Analysis of theInteraction of Participant Group (Similar toLiberal, Dissimilar from Liberal)3 Target (Lib-eral Other, Conservative Other)
(A) A region of ventral mPFC showed greateractivation during judgments of the target towhom participants considered themselvesto be more similar. For participants who as-sociated self with the liberal target (left setof bars), the response of the ventral mPFCwas higher for liberal targets (middle, bluebar) than conservative targets (rightmost,red bar), and no difference was observed forjudgments of self (leftmost, green bar) andthe liberal target. In contrast, for participantswho did not associate with the liberal target(right set of bars), the response of ventralmPFC was higher for conservative than lib-eral targets, and no difference was observedfor judgments of self and the conservativetarget.(B) A region of dorsal mPFC showed the op-posite pattern of results, that is, greater acti-vation during judgments of the target fromwhom participants considered themselvesto be dissimilar.
Table 1. Coordinates of Peak Activations and Percent SignalChange for Regions Demonstrating a Significantly Different BOLDResponse for Similar and Dissimilar Targets
Anatomical Label x y z Similar Dissimilar
Similar > dissimilar
Ventral mPFC 18 57 9 0.18 20.11R inferiorfrontal gyrus
51 3 24 0.85 0.39
Cingulate cortex 23 3 36 0.95 0.45R occipital cortex 12 266 26 0.89 0.43
9 290 24 0.77 0.24L occipital cortex 224 266 24 0.18 20.08
Dissimilar > similar
Dorsal mPFC 29 45 42 0.57 0.82
Peak activations are reported for each region in the Montreal Neuro-logical Institute stereotaxic space. The two rightmost columns pres-ent percent signal change as a function of the perceived similarity oftargets. For the purposes of reporting percent signal change in eachof these regions, the liberal target was considered ‘‘similar’’ and theconservative target was considered ‘‘dissimilar’’ for participants inthe ‘‘similar-to-liberal’’ group (and vice versa for participants in the‘‘dissimilar-from-liberal’’ group). mPFC = medial prefrontal cortex;R = right; L = left.
Mentalizing about Similar and Dissimilar Others657

Corteza pre-Frontal Lateral: Control de la Integración de Información
de Diversas Fuentes
augmentation by subject motion (Power et al., 2011). Third, aswill be seen shortly, voxelwise graphs are dominated at higherthresholds by short-distance relationships, which are logicallypartially artificial based on the above considerations. Modifiedvoxelwise networks are presented in which all ties terminatingwithin 20 mm of a source node are excluded, though otherdistances (e.g., 15 mm and 25 mm) were also tested, with similarresults (data not shown).The two standard methods of graph formation were parcel-
based and voxel-based. The parcel-based graph was formedusing the 90-parcel AAL atlas (Tzourio-Mazoyer et al., 2002),a popular method of graph formation. This atlas divides thecortex and subcortical structures into parcels based uponanatomical landmarks. The voxel-based graph was definedusing all voxels within the AAL atlas (n = 40,100), and the modi-fied voxelwise graph was also defined using these voxels.
Comparing Networks: Correspondence betweenSubgraphs and Functional SystemsSubgraphs were determined over a range of thresholds for eachgraph using one of the best-performing subgraph detectionalgorithms currently available (Infomap) (Fortunato, 2010; Ros-vall and Bergstrom, 2008). This algorithm uses the map equationto minimize information theoretic descriptions of random walkson the graph (essentially assigning zip codes to subgraphs to
Figure 1. Areal Subgraph Structure Is HighlySimilar across Cohorts and Subgraph Structure IsSimilar between Areal and Modified VoxelwiseGraphsTop left: A spring embedded layout of the areal graph at
4% tie density visualizing the graph and the basis for
subgraphs.
Top right: For both cohorts, plots are shown of the areal
assignments into subgraphs (colors) at tie densities from
10% down to 2% in 1% steps. ROI ordering is identical,
and all subgraphs with fewer than four members are
colored white. The standard measure of subgraph
similarity, normalized mutual information, between node
assignments of the cohorts at identical tie densities
ranged from 0.86 to 0.92, indicating highly similar patterns
across cohorts (1 = identical assignments, 0 = no infor-
mation shared between assignments).
Bottom: subgraphs from three thresholds are shown
for the areal (spheres) and modified voxelwise graphs
(surfaces). Note the similarity of subgraph assignments
between networks, despite the great difference in network
size and cortical coverage, even in different subjects (main
versus replication cohorts). All areal subgraphs with fewer
than four members are colored white, and all modified
voxelwise subgraphs with fewer than 100 voxels are
colored white. Areal networks are shown at 10%, 3%, and
2% tie density (r > 0.16, 0.30, and 0.33), and modified
voxelwise networks are shown at 5%, 2%, and 0.5% tie
density (r > 0.16, 0.23, and 0.31).
shorten addresses of individual nodes). Otheralgorithms were tested and yielded similarresults (Figure S2).
Figure 1 illustrates ourmethodology and high-lights several important results. The first panel
depicts the areal graph in a spring embedded layout and mapssubgraphs onto nodes using colors, visibly demonstrating thebasis for subgraphs. In spring embedded layouts, ties act assprings to position nodes in space such that well-connectedgroups of nodes are pulled together, providing an intuitive andinformative picture of the graph. The second panel shows thesubgraph assignments of the areal network in both cohortsover a range of thresholds (each chart consists of 9 columns of264 color entries). ROIs are ordered identically for both cohorts,and the patterns of subgraph assignment across cohorts are ingood agreement. The standard graph theoretic measure ofsimilarity between two sets of node assignments is normalizedmutual information (NMI), which measures how much informa-tion one set of assignments provides about another set ofassignments. Values of 1 indicate identical assignments, andvalues of 0 indicate that no information is gained about thesecond set of assignments by knowing the first. Betweencohorts, NMI ranges from 0.86 to 0.92 across thresholds, indi-cating very similar assignments.The subgraph charts contain subgraphs whose composition
remains quite constant over thresholds (e.g., the horizontalbands of blue, red, or yellow) as well as subgraphs that arehierarchically refined as thresholds rise (e.g., cyan becomingcyan, orange, pink, and purple). These patterns can be seen onbrain surfaces (Figure 1, bottom) as relatively constant subgraph
Neuron
Functional Brain Networks
Neuron 72, 665–678, November 17, 2011 ª2011 Elsevier Inc. 667
• Integrar información diversa, por ejemplo: aspectos morales y normativos
• Se relaciona con integración de información abstracta y estrategias a largo plazo
Baumgartner T, Knoch D, Hotz P, Eisenegger C, Fehr E. 2011. Dorsolateral and ventromedial prefrontal cortex orchestrate normative choice. Nat Neurosci. 14:1468–1474.
Investigación en toma de decisión sociales
¿Qué aplicación puede tener el estudio del cerebro social?

Juego del ultimátum
Billeke P, Zamorano F, Cosmelli D, Aboitiz F. 2013. Oscillatory Brain Activity Correlates with Risk Perception and Predicts Social Decisions. Cereb Cortex. 23:2872–2883.

Estudio de Pacientes con Esquizofrenia
• Alteración en la activación cerebral durante la anticipación de las conductas de otras personas
Billeke P, Armijo A, Castillo D, López T, Zamorano F, Cosmelli D, Aboitiz F. 2015. Paradoxical Expectation: Oscillatory Brain Activity Reveals Social Interaction Impairment in Schizophrenia. Biol Psychiatry. 78:421–431.

Conclusiones
• La implementación de las habilidades sociales y de flexibilidad conductual son fundamentales durante nuestro desarrollo filogenético y ontológico
• Investigaciones en neurociencia han mostrado que la actividad de diversas áreas cerebrales se relaciona con nuestras conductas sociales • Algunas de ellas relacionada a procesos específicamente sociales,
por ejemplo identificar las preferencias de otras personas (unión temporo-pariental)
• Otras, relacionada a la integración de diversa información (social y no social) en conductas complejas (prefrontal dorsolateral)
• Investigaciones en esta área pueden ser aplicadas al estudio del déficit social evidenciado en enfermedades neurológicas y psiquiátricas, y de esta forma ayudar a elaborar terapias de rehabilitación