efecto de la fertilización con purín de cerdo en sistemas
TRANSCRIPT

Efecto de la fertilización con purín de
cerdo en sistemas de doble cultivo en
secanos subhúmedos del norte de
Cataluña
Jonatan Ovejero García
TESIS DOCTORAL
Vic, diciembre de 2016
Universitat de Vic – Universitat Central de Catalunya


Efecto de la fertilización con purín de
cerdo en sistemas de doble cultivo en
secanos subhúmedos del noreste de
Cataluña
Memoria de Tesis Doctoral presentada por Jonatan Ovejero García para
optar al grado de Doctor por la Universitat de Vic – Universitat Central de
Catalunya
Tesis realizada bajo la
dirección de:
Dra. Carme Casas Arcarons
y la codirección de:
Dr. Sergio Ponsá Salas
Programa de Doctorat en Ciències Experimentals i Tecnologies
Departament de Biocièncias - Centre Tecnològic BETA
Facultat de Cièncias i Tecnologia
Universitat de Vic - Universitat Central de Catalunya
Vic, diciembre de 2016


«Quod natura non dat, Salmantica non præstat»
Proverbio latino


Nuestras horas son minutos
cuando esperamos saber,
y siglos cuando sabemos
lo que se puede aprender.
Antonio Machado
El hombre que siente miedo sin peligro,
inventa el peligro para justificar su miedo.
Johann Wolfgang von Goethe
La vida es un toro y hay que torearlo,
si dejas que te embista puede hacerte daño.
Con mucha valentía tienes que lidiarlo,
cortarle las orejas y también el rabo.
Manolo Escobar
No existen más que dos reglas para escribir:
tener algo que decir y decirlo.
Óscar Wilde


VII
Agradecimientos
Esta tesis ha sido posible gracias al Departament d`Agricultura, Ramaderia Pesca i
Alimentació de la Generalitat de Catalunya, que, desde su propuesta hace diez años, ha
financiado el ensayo de campo que ha hecho posible la realización de la tesis aquí
presentada. Agradecer, especialmente a Jaume Boixadera, su participación y soporte en
el desarrollo del ensayo.
Quiero dar las gracias especialmente a mi directora de tesis Carme Casas por
haberme aceptado para formar parte de una de sus líneas de investigación y por toda la
ayuda y consejos recibidos para que esta tesis pudiera salir adelante. Siempre es bueno
compartir con ella jornadas de campo y de despacho. “Moltes gràcies Carme”.
De manera muy especial, quería agradecer a Sergio Ponsá toda la confianza que
depositó en mí desde que me conoció. Él fue, junto con Carme Casas, el primero que me
abrió las puertas del Centro Tecnológico Beta. Agradecer enormemente su cálida acogida
en el entorno laboral y su disposición a la hora de preparar actividades en grupo para
todos los miembros del Beta. De igual forma, agradecer su amistad en el entorno personal
durante los “after works” que realizamos como buenos “Vigatans d’adopciò”.
Llenaría otras 200 páginas si tengo que agradecer todo lo que Jaume Lloveras hizo
para que pudiera leer esta tesis. En primer lugar, me ayudó enormemente cuando más lo
necesitaba y puso la confianza en mí para que pudiera continuar con mi carrera
investigadora. Nunca lo olvidaré. Inmensamente agradecido por sus aportes científicos
en la corrección de los capítulos que conforman esta tesis y su ayuda personal en todo lo
relacionado con ello.
Agradecerle de la manera más sincera y afectiva a Carlos Cortés su confianza y apoyo
que depositó en mí. Sus sabios consejos me ayudaron mucho. Nunca olvidaré todas las

VIII
veces que me dijo “no te preocupes que te va a dar igual”. ¡Cuánta razón llevaba!. Siempre
tendré presente los buenos momentos que hemos pasado juntos.
A los miembros de la oficina de fertilización del DARP, Gemma Murillo, Elena
Puigpinós, Jordi Tugues, Carlos Ortiz y Albert Pinyol por su colaboración en la
consecución y desarrollo del plan de trabajo asociado con el ensayo del “Camp de
Torelló”. Además, a Carlos Ortiz le agradezco, sus aportaciones en la revisión de algunos
capítulos.
A los compañeros del Grupo de Recerca BETA, Joan, Carlota, Laia, Albert, Belén,
Eli, Jorge, Mustafá, Nagore, Carmen, Ester, Mercè …por todas las jornadas de trabajo
que he pasado con ellos y por haber contribuido a la creación de un ambiente laboral
extraordinario. Agradecer a Xevi Serra y a Anna Busquets su inestimable ayuda en todo
lo relacionado con la gestión y trabajo de campo y de laboratorio durante estos años.
En general, a todas las personas con las que tuve la suerte de coincidir durante la
realización del doctorado, que ayudaron a que esta etapa de mi vida fuera inolvidable, y
que, sin duda, perdurará en mi retina.
No podría por menos que dedicar un espacio a mis padres y a mis hermanos Javi,
Rubén y Héctor por el tiempo dedicado en animarme y apoyarme desde la lejanía, para
que llegara hasta el final, sin su apoyo emocional esto no hubiera sido posible.
A la” Muy Leal”, “Muy Noble” y “Liberal y Heroica” ciudad de Béjar por ser donde
nací y pasé los primeros años de mi vida. Al pueblo de Cabezabellosa, el más bonito de
la zona donde hace un tiempo vivieron los vetones, por ser donde están mis orígenes. A
la ciudad de Salamanca por ser dónde está mi alma mater y por ser la ciudad más bonita
que jamás he visto.

IX
Y como no, a mi novia Carmen, con la que llevo siete años compartiendo penas,
alegrías y todos los buenos momentos que tiene la vida. Gracias por tu esfuerzo,
dedicación y paciencia que has tenido a lo largo de estos años. Sé que para ti también ha
sido duro, siempre me has animado a tirar hacia delante para que lo pudiera conseguir, y
al final llegó la recompensa. “No hay plazo que no llegue, ni deuda que no se pague”.
Gracias por hacerme mejor persona…”to be continued”.
Y por último a mí, porque le eché dos...eso que le ponen los toreros fuertes, valientes
y perseverantes para salir por la puerta grande. Siempre podré decir que yo también salí,
por lo menos una vez, por ella.
Esta tesis doctoral se ha realizado gracias a una Beca de Formación del Personal
Investigador (FPI) del Ministerio de Economía y Competitividad (BES-2011-048090).


XI
Resumen
La producción intensiva de cerdos se ha desarrollado significativamente en muchas áreas
de Europa en las últimas décadas. En estas zonas se genera gran cantidad de deyecciones
ganaderas que pueden ser utilizadas directamente como fertilizante orgánico para los
cultivos. Una inadecuada gestión de los purines, puede generar problemas
medioambientales, tales como contaminación de las aguas freáticas por la lixiviación de
nitratos, debido a un exceso de la fertilización nitrogenada. Conscientes de esta
problemática, la Directiva de nitratos de 1991, no permite que la cantidad de deyecciones
animales aplicadas al suelo supere los 170 kg N ha-1 año-1 en zonas declaradas vulnerables
a la contaminación por nitratos. La fertilización mineral, sobre todo la nitrogenada,
representa una fracción significativa del coste total de la producción de los cultivos. Por
ello, la alta concentración de las explotaciones porcinas en el noreste de España permite
que la utilización de purines sea una estrategia de fertilización atractiva para reducir los
costes de producción. Con el fin de investigar los efectos de la fertilización nitrogenada
con purín de cerdo en rotaciones de doble cultivo anual se llevó a cabo un ensayo de
campo desde 2006 hasta 2015 en la comarca de Osona (Cataluña) bajo condiciones
mediterráneas subhúmedas de secano. Desde 2006 hasta 2012, se llevó a cabo una
rotación de maíz y triticale, y desde 2012 hasta 2015, de cebada y sorgo. El objetivo fue
evaluar los efectos en el rendimiento, en la extracción del N, en las pérdidas de N, en el
contenido en NO3--N del suelo y en la calidad forrajera de los diferentes cultivos de cada
rotación. Además, durante la campaña 2014-2015 se cuantificaron las pérdidas por
volatilización de NH3-N después de la aplicación de purín en fondo y cobertera. Se
realizaron cuatro tratamientos de fertilización con purín de cerdo con las siguientes dosis:
0, 170, 250 y 330 kg N ha-1 año-1. Los resultados sugieren que, bajo nuestras condiciones,
la aplicación de N, en forma de purín de cerdo, con dosis superiores a los 170 kg N ha-1
año-1 permitidos por la Directiva de nitratos, mejora tanto la producción obtenida por el
sistema de doble cultivo, como la calidad del forraje en cuanto al contenido en proteína.
Sin embargo, la aplicación de estas dosis origina mayores pérdidas de N, bien por
lixiviación de nitratos y volatilización o bien por inmovilización del N de la materia
orgánica del purín aplicado. Las pérdidas de NH3-N en la aplicación de fondo y cobertera
fueron un 35 y 22%, respectivamente, del N total aplicado, teniendo lugar
mayoritariamente durante las primeras 24 horas posteriores a la aplicación

XII
Resum
La producció intensiva de porcs s'ha desenvolupat significativament en moltes àrees
d'Europa en les últimes dècades. En aquestes zones es generen gran quantitat de
dejeccions ramaderes que poden ser utilitzades directament com a fertilitzant orgànic per
als cultius. Una gestió inadequada dels purins, pot generar un problema mediambiental,
tal com la contaminació de les aigües freàtiques per la lixiviació de nitrats, a causa d'un
excés de la fertilització nitrogenada. Conscients d'aquesta problemàtica, la Directiva de
nitrats de 1991, no permet que la quantitat de dejeccions animals aplicades al sòl superi
els 170 kg N ha-1 any-1 en zones declarades vulnerables a la contaminació per nitrats. La
fertilització mineral, sobretot la nitrogenada, representa una fracció significativa del cost
total de la producció dels cultius. Per això, l'alta concentració de les explotacions porcines
al nord-est d'Espanya permet que la utilització de purins sigui una estratègia de
fertilització atractiva per reduir els costos de producció. Per tal d'investigar els efectes de
la fertilització nitrogenada amb purí de porc en rotacions de doble cultiu anual es va dur
a terme un assaig de camp des de 2006 fins a 2015 en la comarca d'Osona (Catalunya) en
condicions mediterrànies subhumides de secà. Des de 2006 fins a 2012, es va dur a terme
una rotació de blat de moro i triticale, i des de 2012 fins al 2015, d'ordi i sorgo. L'objectiu
va ser avaluar els efectes en el rendiment, en l'extracció del N, en les pèrdues de N, en el
contingut en NO3--N del sòl i en la qualitat farratgera dels diferents cultius de cada rotació.
A més, durant la campanya 2014-2015 es van quantificar les pèrdues per volatilització de
NH3-N després de l'aplicació de purins en fons i cobertora. Es van realitzar quatre
tractaments de fertilització amb purins de porc amb les següents dosis: 0, 170, 250 i 330
kg N ha-1 any-1. Els resultats suggereixen que, sota les nostres condicions, l'aplicació de
N, en forma de purí de porc, amb dosis superiors als 170 kg N ha-1 any-1 permesos per la
Directiva de nitrats, millora tant la producció obtinguda pel sistema de doble cultiu, com
la qualitat del farratge pel que fa al contingut en proteïna. No obstant això, l'aplicació
d'aquestes altes dosis origina majors pèrdues de N, bé per lixiviació de nitrats i
volatilització o bé per immobilització del N de la matèria orgànica del purí aplicat. Les
pèrdues de NH3-N a l'aplicació de fons i cobertora van ser un 35 i 22%, respectivament,
del N total aplicat, tenint lloc majoritàriament durant les primeres 24 hores posteriors a
l'aplicació.

XIII
Abstract
Intensive pig production has developed significantly in many areas of Europe in the most
recent decades. In these areas, large quantities of livestock slurries are generated and can
be used directly as organic fertilizer for the crops. An inadequate management of the
slurries can lead to environmental problems such as contamination of the groundwater by
nitrate leaching due to the over-application of N. Aware of this problem, the Nitrates
Directive 1991 does not allow the quantity of livestock manure applied to the soil to
exceed 170 kg N ha-1 year-1 in Nitrates Vulnerable Zones. Mineral fertilization, especially
nitrogen fertilization, represents a significant fraction of the total cost of crop production.
Therefore, the high concentration of pig farms in the Northeastern Spain allows the use
of slurry is an attractive fertilization strategy to reduce production costs. In order to
investigate the effects of nitrogen fertilization in the form of pig slurry on double-annual
cropping rotation, a field trial was carried out from 2006 to 2015 in the region of Osona
(Catalonia) under rainfed sub-humid Mediterranean conditions. A maize-triticale rotation
was carried out from 2006 to 2012, and barley-sorghum from 2012 to 2015. The aim was
to evaluate the effects on yield, N uptake, N losses, soil NO3--N content and forage quality
of the different crops of each rotation. In addition, during the 2014-2015 season,
volatilization losses of NH3-N were quantified after the application of pig slurry at sowing
and side-dressing. Four pig slurry fertilization treatments were applied with the following
doses: 0, 170, 250 and 330 kg N ha-1 year-1. The results suggest that, under our conditions,
the application of N, in the form of PS, at rates higher than the 170 kg N ha-1 year-1 of
organic fertilizer allowed by the Nitrates Directive, improves both the yield obtained by
the double cropping system and the forage quality in terms of protein content. However,
the application of these high doses causes greater losses of N, either by leaching of nitrates
and volatilization or by the N immobilization of the organic matter of the pig slurry
applied. NH3-N losses at sowing and side-dressing were 35 and 22% respectively of the
total N applied, taking place mostly during the first 24 hours after application.


XV
ÍNDICE GENERAL
Agradecimientos ......................................................................................................................... VII
Resumen ....................................................................................................................................... XI
Resum .......................................................................................................................................... XII
Abstract ...................................................................................................................................... XIII
INTRODUCCIÓN GENERAL ............................................................................................................. 1
Hipótesis de partida, objetivos y estructura de la tesis ............................................................ 6
Referencias ................................................................................................................................ 8
CAPÍTULO 1 ................................................................................................................................. 11
PIG SLURRY FERTILIZATION IN A DOUBLE-ANNUAL CROPPING FORAGE SYSTEM UNDER SUB-
HUMID MEDITERRANEAN CONDITIONS ...................................................................................... 11
1. Introduction ........................................................................................................................ 15
2. Materials and methods ....................................................................................................... 18
2.1 Experimental site ............................................................................................................... 18
2.2 Experimental design .......................................................................................................... 19
2.3 Cropping system ................................................................................................................ 21
2.4 Analysis of plants and soil samples ................................................................................... 22
2.5 Unrecovered N .................................................................................................................. 22
2.6 Nitrogen efficiency ............................................................................................................ 23
2.7 Statistical analysis.............................................................................................................. 23
3. Results ................................................................................................................................. 24
3.1 Weather conditions during the experimental period ....................................................... 24
3.2 Crop yield .......................................................................................................................... 25
3.3 N uptake ............................................................................................................................ 26
3.4 Soil NO3--N content ........................................................................................................... 29
3.5 Unrecovered N .................................................................................................................. 31
3.6 N efficiency ........................................................................................................................ 33
4. Discussion ............................................................................................................................ 36
4.1 Crop yield and N uptake .................................................................................................... 36
4.2 Soil NO3--N content ........................................................................................................... 38
4.3 Unrecovered N and N efficiency ....................................................................................... 39
5. Conclusions ......................................................................................................................... 42
6. References ........................................................................................................................... 43
CAPÍTULO 2 ................................................................................................................................. 51

XVI
EFFECTS OF PIG SLURRY FERTILIZATION ON FORAGE YIELD AND QUALITY IN A DOUBLE
CROPPING SYSTEM ...................................................................................................................... 51
1. Introduction ........................................................................................................................ 55
2. Material and methods ......................................................................................................... 57
2.1 Experimental site and crop management ......................................................................... 57
2.2 Experimental design .......................................................................................................... 60
2.3 Slurry, soil and plant analysis. ........................................................................................... 61
2.4 Statistical analysis.............................................................................................................. 63
3. Results ................................................................................................................................. 64
3.1 DM yield ............................................................................................................................ 64
3.2 Forage quality parameters ................................................................................................ 67
3.3 Mineral element concentrations ....................................................................................... 68
3.4 Soil NO3--N content ........................................................................................................... 70
3.5 Nitrogen use efficiency ...................................................................................................... 72
4. Discussion ............................................................................................................................ 73
4.1 DM yield and N use efficiency ........................................................................................... 73
4.2 Forage quality parameters ................................................................................................ 75
4.3 Mineral element concentrations ....................................................................................... 77
5. Conclusions ......................................................................................................................... 78
6. References ........................................................................................................................... 78
CAPÍTULO 3 ................................................................................................................................. 89
EFECTOS DE LA FERTILIZACIÓN CON PURÍN DE CERDO EN UN DOBLE CULTIVO ANUAL DE
CEBADA Y SORGO EN CONDICIONES SUBHÚMEDAS MEDITERRÁNEAS ...................................... 89
1. Introducción ........................................................................................................................ 92
2. Material y métodos ............................................................................................................. 94
2.1 Localización del experimento ............................................................................................ 94
2.2 Diseño experimental ......................................................................................................... 95
2.3 Manejo del cultivo ............................................................................................................. 96
2.4 Análisis de purín, suelo y planta ........................................................................................ 97
2.5 Pérdidas de N .................................................................................................................... 99
2.6 Eficiencia en el uso del nitrógeno ................................................................................... 100
2.7 Análisis estadístico .......................................................................................................... 101
3. Resultados ......................................................................................................................... 101
3.1 Condiciones climáticas durante el periodo experimental ............................................... 101
3.2 Rendimiento de los cultivos ............................................................................................ 103

XVII
3.3 Extracción de N por los cultivos ...................................................................................... 106
3.4 Contenido de NO3--N en el suelo. .................................................................................... 107
3.5 Pérdidas de N .................................................................................................................. 108
3.6 Eficiencia en el uso del N ................................................................................................. 109
3.7 Calidad forrajera .............................................................................................................. 109
4. Discusión ........................................................................................................................... 112
4.1 Rendimiento y extracción de N del cultivo ..................................................................... 112
4.2 Contenido de NO3--N en el suelo, pérdidas de N y eficiencia en el uso del N .............. 114
4.3 Calidad forrajera .............................................................................................................. 116
5. Conclusiones...................................................................................................................... 117
6. Referencias ........................................................................................................................ 118
CAPÍTULO 4 ............................................................................................................................... 125
LA VOLATILIZACIÓN DE AMONIACO TRAS LA FERTILIZACIÓN CON PURÍN DE CERDO EN
CONDICIONES MEDITERRÁNEAS ............................................................................................... 125
1. Introducción ...................................................................................................................... 128
2. Material and métodos ....................................................................................................... 131
2.1 Localización del experimento .......................................................................................... 131
2.2 Diseño experimental ....................................................................................................... 132
2.3 Análisis de purín y humedad del suelo. ........................................................................... 133
2.4 Estimación de la volatilización de NH3 ............................................................................ 133
2.5 Muestreo y proceso de extracción del NH3..................................................................... 135
2.6 Análisis estadístico .......................................................................................................... 135
3. Resultados y discusión ...................................................................................................... 135
3.1 Efecto de la aplicación con purín de cerdo en cobertera en la volatilización de NH3..... 137
3.2 Efecto de la aplicación con purín de cerdo en fondo en la volatilización de NH3 ........... 138
4. Conclusiones...................................................................................................................... 142
5. Referencias ........................................................................................................................ 142
DISCUSIÓN GENERAL ................................................................................................................. 151
Referencias ................................................................................................................................ 156
CONCLUSIONES GENERALES ..................................................................................................... 161


INTRODUCCIÓN GENERAL


3
INTRODUCCIÓN GENERAL
Los problemas medioambientales derivados del nitrógeno y la lixiviación de los
nitratos se suelen asociar a zonas de ganadería intensiva, principalmente porcina. El
aumento de la dimensión media de las explotaciones y la elevada concentración territorial
de las mismas, ha generado un problema medioambiental debido fundamentalmente al
incremento en la concentración de nitratos en las aguas freáticas. Los países de la EU-28
con alta densidad ganadera, se caracterizan porque todos tienen problemas localizados de
exceso de nutrientes que repercuten en la calidad de las aguas. Fruto de esta preocupación
medioambiental, se han publicado diversas normativas de ámbito comunitario, nacional
y autonómico. Todas ellas focalizan e insisten en el control de los aportes nitrogenados a
sistemas agrícolas tanto en forma orgánica como mineral.
La directiva europea que incide más directamente sobre la problemática
medioambiental generada por las explotaciones porcinas es la Directiva de nitratos (EEC,
1991). Según esta normativa, cada Estado miembro debe identificar en su territorio las
aguas afectadas por este tipo de contaminación, o las que puedan llegar a estarlo, y
declararlas como Zonas Vulnerables a la contaminación por Nitratos (ZVN).
En Cataluña, las zonas de producción de porcino intensivo que han sido declaradas
como ZVN se concentran en algunas áreas geográficas concretas, que, a su vez,
normalmente coinciden con las zonas de producción agrícola (Figura 1). Alguna de las
zonas vulnerables como la 3 (Osona) y la 6 (Noguera, Segarra, Urgell, Pla del Urgell,
Segriá) cuentan con una elevada concentración de ganadería porcina. En estas zonas se
genera gran cantidad de deyecciones ganaderas que se mezclan con las aguas de la
limpieza de las instalaciones incrementando el volumen del residuo. El subproducto
resultante tiene un contenido importante de nutrientes que puede ser usado directamente
como fertilizante orgánico para los cultivos.

Fertilización con purín en sistemas de doble cultivo
4
Figura 1. Distribución de las áreas donde se agrupan las zonas designadas vulnerables a la
contaminación por nitratos de origen agrario.
En algunas comarcas, tales como la de Osona, el volumen de nutrientes de las
deyecciones supera la capacidad que tiene el sistema agrícola para reciclarlos
adecuadamente, lo que conlleva a estas comarcas a tener un considerable excedente de N.
Para evitar problemas ambientales derivados de este excedente es necesario optimizar la
fertilización nitrogenada con purín de cerdo en los cultivos. Osona es una comarca con
una elevada actividad ganadera donde el destino más económico y natural de las
deyecciones generadas es la aplicación agrícola como fertilizante. Por otra parte, en
algunas explotaciones, es habitual la práctica del doble cultivo anual, combinando un
cereal de invierno (cebada, trigo y triticale) y un cereal de verano (maíz, el sorgo o el
mijo). Habitualmente se trata de cultivos forrajeros que son utilizados como alimento para
el ganado de las explotaciones de la zona. Dado el carácter singular que tienen estas

Introducción general
5
explotaciones, es necesario llevar a cabo un correcto plan de fertilización, principalmente
con el nitrógeno proveniente del purín de cerdo. La elevada disponibilidad de purín en
esta comarca, conlleva a que su uso como fertilizante orgánico sea rentable
económicamente, lo que provoca que la fertilización mineral sea muy poco utilizada.
Varios estudios en diferentes áreas han demostrado que las aplicaciones con purín de
cerdo pueden lograr rendimientos satisfactorios en los cultivos, reemplazando parcial o
totalmente los fertilizantes minerales (Zebarth et al., 1996; Jensen et al., 2000).
Numerosos estudios se han realizado sobre los efectos del fertilizante nitrogenado
orgánico o mineral bajo condiciones climáticas mediterráneas en maíz de regadío (Biau
et al., 2012; Trindade et al., 2009; Perego et al., 2013), mientras que otros se han
concentrado en cereales de invierno bajo condiciones semiáridas en secano (Hernández
et al., 2013; Bosch-Serra et al., 2015). Los estudios sobre los efectos de la fertilización
del N en los sistemas de doble cultivo se han publicado principalmente utilizando
fertilizantes minerales (Hartmann et al., 2014; Shang et al., 2014). Sin embargo, son
menos numerosos los estudios que hayan analizado el efecto de la fertilización orgánica
en sistemas de doble cultivo en condiciones mediterráneas. En esta línea, recientemente
se han publicado artículos en Italia en condiciones mediterráneas de regadío (Tomasoni
et al., 2011; Giola et al., 2012; Cavalli et al., 2016; Demurtas et al., 2016) y en un secano
húmedo del NE de España (Perramon et al., 2016).
Por otro lado, la dosis de aplicación de fertilizante nitrogenado necesaria para
maximizar tanto el rendimiento como el valor nutritivo del forraje de los cultivos están
bien documentadas en la literatura (Rostamza et al., 2011; Restelatto et al., 2014). Sin
embargo, los resultados publicados son inconsistentes debido a la discrepancia en los
resultados obtenidos por los diversos autores, sobre los efectos de la fertilización en las
concentraciones de proteína bruta y fibra fundamentalmente. Min et al. (2002) publicó

Fertilización con purín en sistemas de doble cultivo
6
que la aplicación de N con dosis altas aumentó la concentración de proteína bruta, pero
el contenido en fibra no se vio afectado. Otros autores concluyeron que, la concentración
de fibra disminuyó con el aumento de la dosis de fertilización nitrogenada (Adeli et al.,
2005), sin embargo, Belanger y McQueen (1998) observaron un aumento en la
concentración de fibra con el aumento de la fertilización con N. Otros investigadores
observaron que el aumento de la fertilización nitrogenada no tuvo casi ningún efecto sobre
las concentraciones de fibra (Cuomo y Anderson, 1996). En zonas mediterráneas, varios
autores han analizado los efectos de los fertilizantes nitrogenados sobre la producción y
la calidad del forraje principalmente en el maíz (Carpici et al., 2010), siendo la
información escasa en la literatura en el caso de sistemas de doble cultivo (Tomasoni et
al., 2011).
Hipótesis de partida, objetivos y estructura de la tesis
La Directiva de nitratos 91/676/CEE no permite que la cantidad de deyecciones
animales aplicadas al suelo en ZVN supere los 170 kg N ha-1 año-1. Además, permite que
los Estados miembros puedan establecer excepciones respecto a este límite. Las
situaciones para poder solicitar la derogación incluyen rotaciones de cultivos con ciclos
largos en los que se evite el suelo desnudo, cultivos con alta absorción de N o suelos con
alta capacidad de desnitrificación. De hecho, la UE ha permitido derogar la Directiva en
algunas regiones o países en los cuales se daba alguna de las situaciones planteadas
(Holanda, Alemania, Irlanda, Irlanda del Norte, región de Flandes y diversas regiones de
Italia) y se permite la aplicación de hasta un máximo de 250 kg N ha-1 año-1 de origen
orgánico.
La hipótesis de partida de este estudio es que el límite de 170 kg N ha-1 año-1 de
fertilizantes orgánicos puede ser adecuado si sólo se realiza un cultivo al año, ya sea un
cereal de invierno o de verano. Sin embargo, en ZVN con alta densidad ganadera, cuando

Introducción general
7
se establece una rotación forrajera de doble cultivo anual, aumenta la demanda de N y
este límite puede provocar un déficit en el adecuado suministro de nutrientes a los
cultivos. Por lo tanto, en estos sistemas agrícolas, debería ser posible superar el umbral
de la cantidad fijada por la Directiva europea, manteniendo una alta productividad y
minimizando el impacto ambiental en las aguas subterráneas.
Con el fin de validar dicha hipótesis, el objetivo general de la presente Tesis Doctoral
es evaluar la respuesta a la fertilización nitrogenada, en forma orgánica con purín de
cerdo, en una rotación de doble cultivo anual en condiciones subhúmedas mediterráneas.
Con este trabajo se pretende identificar aquellas prácticas de fertilización que garanticen
la sostenibilidad ambiental, sin menoscabo de la productividad, de los sistemas agrícolas
propios de la Cataluña central, concretamente de la comarca de Osona.
Para alcanzar el objetivo general se plantean los siguientes objetivos específicos:
i. Evaluar los efectos de diferentes dosis de fertilización nitrogenada con
purín de cerdo en la productividad, en la absorción de nitrógeno y en el
contenido en NO3--N del suelo en cada cultivo y en diferentes rotaciones.
ii. Establecer la dosis de fertilización óptima teniendo en cuenta el balance
de N global en sistemas de doble cultivo anual.
iii. Evaluar la eficiencia del N en los sistemas de doble cultivo en condiciones
subhúmedas mediterráneas propios de los secanos del norte de Cataluña.
iv. Comparar el efecto de diferentes dosis de fertilización nitrogenada con
purín de cerdo en la calidad forrajera de los cultivos.
v. Cuantificar las pérdidas por volatilización de NH3-N durante los días
posteriores a la aplicación de purín de cerdo.
El presente documento se compone de cuatro capítulos elaborados en formato de
artículo científico. Por esta razón algunas de las partes de material y métodos y de la

Fertilización con purín en sistemas de doble cultivo
8
bibliografía pueden contener cierto grado de repetición. En el momento de la redacción
de esta Memoria de Tesis Doctoral, el capítulo 1 ha sido publicado en “European Journal
of Agronomy” (Ovejero et al., 2016), el capítulo 2 se encuentra en fase de revisión y los
capítulos 3 y 4 están en fase de preparación.
Referencias
Adeli, A., Varco, J.J., Sistani, K.R., Rowe, D.E., 2005. Effects of swine lagoon effluent
relative to commercial fertilizer applications on warm-season forage nutritive value.
Agron. J. 97, 408-417.
Belanger, G., McQueen, R.E., 1998. Analysis of the nutritive value of timothy grown
with varying N nutrition. Grass Forage Sci. 53, 109-119.
Biau, A., Santiveri, F., Mijangos, I., Lloveras, J., 2012. The impact of organic and mineral
fertilizers on soil quality parameters and the productivity of irrigated maizecrops in
semiarid regions. Eur. J. Soil Biol. 53, 56-61.
Bosch-Serra, A.D., Ortiz, C., Yagüe, M.R., Boixadera, J., 2015. Strategies to optimize
nitrogen efficiency when fertilizing with pig slurries in dryland agricultural systems.
Eur. J. Agron. 67, 27-36.
Carpici, E.B., Celik, N., Bayram, G., 2010. Yield and quality of forage maize as influ-
enced by plant density and nitrogen rate. Turk. J. Field Crop. 15, 128-132.
Cavalli, D., Cabassi, G., Borrelli, L., Geromel, G., Bechini, L., Degano, L., Marino
Gallina, P., 2016. Nitrogen fertilizer replacement value of undigested liquid cattle
manure and digestates. Eur. J. Agron. 73, 34-41.
Cuomo, G.J., Anderson, B.E., 1996. Nitrogen fertilization and burning effects on rumen
protein degradation and nutritive value of native grasses. Agron. J. 88, 439-442.
Demurtas, C.E., Seddaiu, G., Ledda, L., Cappai, C., Doro, L., Carletti, A., Roggero, P.P.,
2016. Replacing organic with mineral N fertilization does not reduce nitrate leaching

Introducción general
9
in double crop forage systems under Mediterranean conditions. Agric. Ecosyst.
Environ. 44, 78-86.
EEC, 1991. Council Directive of 12 December 1991 concerning the protection of waters
against pollution caused by nitrates from agricultural sources. Off. J. Eur. Commun.
91/676/EEC.
Giola, P., Basso, B., Pruneddu, G., Giunta, F., Jones, J.W., 2012. Impact of manure and
slurry applications on soil nitrate in a maize–triticale rotation: field study and long
term simulation analysis. Eur. J. Agron. 38, 43-53.
Hartmann, T.E., Yue, S., Schulz, R., Chen, X., Zhang, F., Müller, T., 2014. Nitrogen
dynamics, apparent mineralization and balance calculations in a maize – wheat
double cropping system of the North China Plain. Field Crops Res. 160, 22-30.
Hernández, D., Polo, A., Plaza, C., 2013. Long-term effects of pig slurry on barley yield
and N use efficiency under semiarid Mediterranean conditions. Eur. J. Agron. 44,
78-86.
Jensen, L.S., Pedersen, I.S., Hansen, T.B., Nielsen, N.E., 2000. Turnover and fate of 15N-
labelled cattle slurry ammonium–N applied in the autumn to winter wheat. Eur. J.
Agron. 12, 23-35.
Min, D.H., Vough, L.R., Reeves, J.B., 2002. Dairy slurry effects on forage quality of
orchardgrass, reed canarygrass, and alfalfa-grass mixtures. Anim. Feed Sci. Technol.
95, 143-157.
Ovejero, J., Ortiz, C., Boixadera, J., Serra, X., Ponsá, S., Lloveras, J., Casas, C., 2016.
Pig slurry fertilization in a double-annual cropping forage system under sub-humid
Mediterranean conditions. Eur. J. Agron. 81, 138-149.
Perego, A., Giussani, A., Fumagalli, M., Sanna, M., Chiodini, M., Carozzi, M., Alfieri,
L., Brenna, S., Acutis, M., 2013. Crop rotation, fertilizer types and application

Fertilización con purín en sistemas de doble cultivo
10
timing affecting nitrogen leaching in nitrate vulnerable zones in Po Valley. Ital. J.
Agrometeorol. 18, 39-50.
Perramon, B., Bosch-Serra, A.D., Domingo, F., Boixadera, J., 2016. Organic and mineral
fertilization management improvements to a double-annual cropping system under
humid Mediterranean conditions. Eur. J. Agron. 76, 28-40.
Restelatto, R., Pavinato, P.S., Sartor, L.R., Paixão, S.J., 2014. Production and nutritional
value of sorghum and black oat forages under nitrogen fertilization. Grass Forage
Sci. 68, 1-12.
Rostamza, M., Chaichi, M.R., Jahansouz, M.R., Alimadadi, A., 2011. Forage quality,
water use and nitrogen utilization efficiencies of pearl millet (Pennisetum amer-
icanum L.) grown under different soil moisture and nitrogen levels. Agric. Water
Manage. 98, 1607-1614.
Shang, Q., Gao, C., Yang, X., Wu, P., Ling, N., Shen, Q., Guo, S., 2014. Ammonia
volatilization in Chinese double rice-cropping systems: a 3-year field measurement
in long-term fertilizer experiments. Biol. Fertil. Soils 50, 715-725.
Tomasoni, C., Borrelli, L., Ceotto, E., 2011. Effect of integrated forage rotation and
manure management on yield, nutrient balance and soil organic matter. Ital. J.
Agron. 6, 55-60.
Trindade, H., Coutinho, J., Jarvis, S., Moreira, N., 2009. Effects of different rates and
timing of application of nitrogen as slurry and mineral fertilizer on yield of herbage
and nitrate-leaching potential of a maize/Italian ryegrass cropping system in north-
west Portugal. Grass Forage Sci. 64, 2-11.
Zebarth, B.J., Paul, J.V. Schmidt, O., McDougall, R., 1996. Influence of the time and rate
of liquid-manure application on yield and nitrogen utilization of silage corn in south
coastal British Columbia. Can. J. Soil Sci. 76, 153-164.

CAPÍTULO 1
PIG SLURRY FERTILIZATION IN A DOUBLE-ANNUAL CROPPING FORAGE
SYSTEM UNDER SUB-HUMID MEDITERRANEAN CONDITIONS


13
CAPÍTULO 1
PIG SLURRY FERTILIZATION IN A DOUBLE-ANNUAL
CROPPING FORAGE SYSTEM UNDER SUB-HUMID
MEDITERRANEAN CONDITIONS
Los resultados que se presentan en este capítulo han sido incluidos en la siguiente
publicación científica: Ovejero, J., Ortiz, C., Boixadera, J., Serra, X., Ponsá, S.,
Lloveras, J., Casas, C., 2016. European Journal of Agronomy. 81, 138-149.
Keywords: Double cropping, N fertilization, maize, soil NO3--N, pig slurry, triticale.
Abbreviations:
DM: dry matter
PS: pig slurry
NVZs: nitrate vulnerable zones
ANRF: apparent nitrogen recovery fraction
ANE: agronomic nitrogen efficiency
RESUMEN
En las zonas del sur de Europa con una elevada producción intensiva de cerdos, la mayor
parte del purín se aplica como fertilizante. Sin embargo, en la Unión Europea, no se
pueden aplicar más de 170 kg N ha-1 año-1 provenientes de deyecciones animales en las
zonas declaradas vulnerables a la contaminación por nitratos. En este contexto, se llevó a
cabo un ensayo de seis años con una rotación de doble cultivo anual de maíz y triticale
bajo condiciones de secano. Se aplicaron cuatro dosis diferentes de N (0, 170, 250 y 330
kg N ha-1 año-1), en forma de purín de cerdo, para evaluar su efecto sobre el rendimiento
de los cultivos, la extracción de N, el N no recuperado y el contenido de NO3--N en el
suelo. El rendimiento de materia seca de maíz fue influenciado principalmente por las
condiciones climáticas, y el rendimiento de materia seca de triticale estuvo claramente

Capítulo 1
14
influenciado por la dosis de fertilización y el contenido inicial de NO3--N en el suelo. El
N no recuperado se vio afectado por la dosis de fertilización y el contenido inicial de NO3-
-N en el suelo. Cuando se aplicó el purín en el maíz, el efecto residual afectó al contenido
de NO3--N en el suelo y al posterior rendimiento de materia seca del triticale. Por otro
lado, la media anual total del N no recuperado, considerando la suma de ambos cultivos
(maíz + triticale), fue de 91, 144 y 222 kg N ha-1 en las dosis 170, 250 y 330 kg N ha-1,
respectivamente. Con el fin de evitar parte de este N no recuperado, principalmente por
lixiviación de nitratos, la fertilización de purín en triticale se debería aplicar en cobertera
durante el ahijamiento. La aplicación de N, en forma de purín de cerdo, a dosis superiores
al máximo permitido legalmente de 170 kg N ha-1 año-1, resulta en mejores rendimientos.
Sin embargo, las dosis altas de fertilización con purín pueden originar una eficiencia del
uso del N significativamente menor y un mayor impacto ambiental en sistemas de doble
cultivo, practicados en condiciones mediterráneas subhúmedas de secano.
ABSTRACT
In areas of Southern Europe with very intensive pig production, most of the pig slurry
(PS) is applied as fertilizer. However, in the European Union, no more than 170 kg N
ha-1 year-1 can be applied in nitrate vulnerable zones (NVZs) from livestock manures. In
this context, a six-year trial was conducted for a maize-triticale double-annual forage
cropping rotation under rainfed conditions. Four different N rates were applied (0, 170,
250 and 330 kg N ha-1 year-1), to evaluate their effect on crop yield, N uptake, unrecovered
N and soil nitrate content. The corresponding PS rates were defined as zero (PS 0), low
(PSL) medium (PSM) and high (PSH). The annual average dry matter (DM) yields (maize
+ triticale) for the PS fertilization treatments PS0, PSL, PSM and PSH were 12.6, 17.7,
20.2 and 22.0 Mg DM ha-1, respectively. Maize DM yield was influenced mainly by
weather conditions, and triticale DM yield was clearly influenced by initial soil NO3--N
Pig slurry fertilization in a double-annual cropping
15
and PS fertilization rates. Unrecovered N was affected by PS fertilization rate and initial
soil NO3--N content. A residual effect of the PS when applied to maize had an important
effect on soil NO3--N and subsequent triticale DM yield. Moreover, total annual average
unrecovered N, considering the sum of both crops (maize + triticale), were 91, 144, and
222 kg N ha-1 in PSL, PSM and PSH, respectively. In order to avoid part of this
unrecovered N, mainly by lixiviation of nitrates, PS fertilization in triticale should be
applied as side dressing at tillering. The application of N, in the form of PS, at rates higher
than the legally permitted maximum of 170 kg N ha-1 year-1, may result in better yields.
However, high rates of PS fertilization may originate in significantly lower N use
efficiency and a higher potential environmental impact in double-cropping systems,
practiced in rainfed sub-humid Mediterranean conditions.
1. Introduction
Intensive swine production is an important agricultural and economic activity in
many areas of Europe. Spain is the second largest European country in pig production
after Germany, with approximately 26 million head which represents about 20% of total
European production (Eurostat, 2013). Approximately 49% of the total Spanish pig herd
is concentrated in the North East (NE) part of Spain (MAGRAMA, 2013).
The land application of pig slurry (PS) is a low-cost method of disposal and most PS
is applied as fertilizer in agriculture (Yagüe and Quílez, 2010a). However, the total
amount of nitrogen (N) applied to soil when disposing of PS normally exceeds a crop’s
N requirements, and any excess may be leached through drainage (Yagüe and Quílez,
2010a) and surface runoff.
Application of PS, and often the over-application of N, can lead to environmental
problems such as contamination of the water and soils in nitrate sensitive areas (Ramos
Capítulo 1
16
et al., 2002; Gollany et al., 2004). Aware of these problems, the European Commission
(EC) developed and implemented the Nitrates Directive 91/676 (EEC, 1991), which
determined the establishment of Nitrates Vulnerable Zones (NVZs). In these areas,
farming practices are restricted by limiting to a maximum of 170 kg N ha-1 year-1 the
application of N from livestock manures and slurries. Optimization of N fertilization with
PS in these NVZs is therefore important to avoid nitrate losses by lixiviation and to
achieve maximum efficiency in N absorption by crops.
A double-cropping forage strategy (summer crop - winter crop) has been increasingly
applied in the NE of Spain during recent years. A summer crop (sorghum or maize) is
grown from June to October, and in November a winter cereal such as barley or triticale
is subsequently sown as in other forage production areas (Lloveras, 1987; Trindade et al.,
2001; Monaco et al., 2008). The typical methodology for PS fertilization in these areas
has been the direct use of PS in the soil before summer and winter cereal crop sowing.
Mineral N fertilizer alone is seldom applied due to the considerable amounts of PS
available in this region.
Many studies in different areas have shown that PS applications can achieve
satisfactory yields in different crops by partially or completely replacing mineral
fertilizers, depending on crop, soil, and climate characteristics (Zebarth et al., 1996;
Jensen et al., 2000; Berenguer et al., 2008; Yagüe and Quílez, 2010a). However, a
consistent fraction of N applied with PS could be temporary unavailable to the crop
(Sørensen and Jensen, 1995; Morvan et al., 1997; Sørensen and Amato, 2002; Yagüe and
Quílez, 2010c), due to microbial N immobilisation and ammonium fixation by soil clay
minerals (Chantigny et al., 2004). Moreover, some of the N applied with PS, can be
available for the subsequent crops, or can even supply N to the crops for several years
due to mineralization generally extends over a much longer period than just one year

Pig slurry fertilization in a double-annual cropping
17
(Schröder, 2005a). This residual effect of PS has been studied for irrigated maize
production under Mediterranean conditions in the Ebro Valley in Spain (Daudén et al.,
2004; Yagüe and Quílez, 2010b; Cela et al., 2011a). These authors analysed the residual
effects of PS application to maize on winter cereal production, suggesting that
mineralization of the organic N applied with PS to maize contributes to fertilization of
the subsequent wheat crop, and its residual effect would therefore allow farmers to save
mineral N fertilizer. Along similar lines, Sieling et al. (2014) analysed the residual effects
of PS application to oilseed rape on winter wheat and winter barley yields in northern
Germany, reporting that small residual fertilizer effects were only detected in the first
year.
Many authors have analysed N fertilizer effects on irrigated maize yields with either
mineral or organic fertilizers (Schröder et al., 2005b; Wachendorf et al., 2006). Several
studies have been made in Mediterranean climate conditions in irrigated areas (Biau et
al., 2012; Trindade et al., 2009; Perego et al., 2013), while others have concentrated on
winter cereal under rainfed semiarid conditions (Abad et al., 2004; Angás et al., 2006;
Hernández et al., 2013; Bosch-Serra et al., 2015). Studies of N fertilization effects under
double-cropping systems have mainly been published on the use of mineral fertilizers
(Guo et al., 2008; Qiu et al., 2012; Hartmann et al., 2014; Shang et al., 2014), though
analyses of the effects of organic fertilizers under double-cropping systems have been
conducted in Italy (Giola et al., 2012; Demurtas et al., 2016) and Spain (Perramon et al.,
2016). Similarly, Tomasoni et al. (2011) and Cavalli et al. (2016) analysed the effects of
manure management in a double-annual crop rotation of maize and Italian ryegrass in the
Po Valley (Northern Italy).
The objectives of this study were (i) to evaluate different fertilization strategies with
PS in terms of crop yields, N uptake, unrecovered N and soil mineral N content and (ii)

Capítulo 1
18
to assess and optimize PS fertilization in a medium-term (six years) double-annual forage
cropping system under rainfed sub-humid conditions.
2. Materials and methods
2.1 Experimental site
The study was performed over six years in an experimental field located at Torelló
in a rainfed sub-humid area of Catalonia (Northeastern Spain). Double-annual forage
cropping rotation of maize and triticale was practiced between 2006 and 2012. This
rotation is representative of the common farming practices in the area, where summer
cereal (maize or sorghum) is planted in June after the winter cereal harvest (triticale,
wheat or barley), which is usually planted in October-November after the maize harvest.
The annual mean precipitation of the trial site between 1986 and 2006 was 651 mm
and mean temperature was 13.1°C. Weather data were recorded by an automatic
meteorological station two kilometers away from the experimental field (Meteorological
Observatory of Torelló). The soil is calcareous, moderately-alkaline pH and loam texture.
The main soil properties of the field site are presented in Table 1.

Pig slurry fertilization in a double-annual cropping
19
Table 1. Selected soil properties for different soil depths at the beginning of the experiment
(2006).
Depth
0-30 cm 30-60 cm 60-90 cm
pH 8.3 8.3 8.3
EC 1:5 (dS m-1) 0.22 0.15 0.17
Organic matter (%) 1.75 1.23 0.88
Nitric Nitrogen (mg NO3- -N kg -1) 6.46 4.76 7.70
N (%) 0.13 0.10 0.06
C:N ratio 7.45 6.70 5.70
P (mg kg -1) 34 22 11
K (mg kg -1) 197 79 62
Sand (%) 31.7 32.1 34.6
Silt (%) 47.2 44.9 44.9
Clay (%) 21.1 23 20.5
2.2 Experimental design
The trial was designed as a randomized complete block with four PS treatments and
three replications. Each plot was 12 m wide by 40 m long. The fertilizer applications were
made onto the same experimental plots each year. The PS treatments were:
- PS zero (PS0): refers to control plots, where only 80 kg K2O ha-1 year-1 were
applied entirely before sowing maize, in order to avoid deficits in K on these
plots.
- PS low (PSL): 170 kg N ha-1 year-1, corresponding to the maximum legal dose
according to Nitrates Directive 91/676 (EEC, 1991).
- PS medium (PSM): 250 kg N ha-1 year-1, corresponding to the dose which we
hypothesize as being optimal for crop N requirements in the double crop
rotation considered in this paper.

Capítulo 1
20
- PS high (PSH): 330 kg N ha-1 year-1, corresponding to a PS dose above crop N
requirements, to assess the cropping system response to surplus N.
Prior to the establishment of the experiment, the field was conventionally fertilized
with PS for two decades. In this experiment, PS was obtained each year from a pig-
fattening farm close to the experimental site. PS was spread using a commercial splash
plate spreader and incorporated into the soil immediately after the application to minimize
ammonia volatilization losses. During application, the tank of the spreader was calibrated
to apply the target PS rates by measuring the electrical conductivity and density of PS in
order to adjust the speed of the tractor. Also, several slurry samples were taken from each
tank and mixed to make a composite sample. They were frozen and stored at -20oC until
they were analysed in a reference laboratory. The real amount of N applied and taken into
account for calculations in this paper, was established according to the physiochemical
characteristics of the PS (Table 2).
The PS was applied twice a year in the PSH and PSM treatments and once a year in
PSL, just before the sowing of the crops. The PSH and PSM rates were split into two
applications. One with approximately 250 and 170 kg N ha-1 for PSH and PSM
respectively, being broadcast before maize sowing and the remaining PS was applied
before triticale sowing (corresponding to approximately 80 kg N ha-1 in both cases). In
the PSL treatment, the PS was applied entirely before maize sowing. No fertilization with
phosphorus was applied throughout the experiment in the PS0 treatment, as the levels of
this element in the soil were sufficient for the correct development of both crops.

Pig slurry fertilization in a double-annual cropping
21
Table 2. Average physicochemical characteristics of pig slurry applied from 2006 to 2012 in the
experimental field.
Parameter Average from 2006 to 2012
pH 8,4 ± 0,2
Electrical conductivity (dSm−1) 21,6 ± 3,5
Dry matter (kg DM Mg-1) 69 ± 20
Organic matter (kg OM Mg-1) 50,9 ± 16,4
Ammonium-N (kg N m-3) 3,4 ± 0,8
Organic N (kg N m-3) 1,7 ± 1,0
Total N (kg N m-3) 5,1 ± 1,4
P (kg m-3) 1,5 ± 0,5
K(kg m-3) 2,8 ± 0,8
2.3 Cropping system
Maize and triticale were managed according to normal practices in the area. The
tillage operations before the maize and triticale crops consisted of a pass with a field
cultivator, to 15 cm depth, after the harvest of the previous crop. The PS was then surface
applied and incorporated into the soil by a pass of a cultivator to 15 cm depth. In triticale,
no herbicide was used during the experimental season. Forage maize (FAO class 500)
was sown in June, at a density of 80 000 plants ha-1 and with a space between rows of 70
cm, and was harvested approximately at R3 milk-stage (Hanway and Ritchie, 1984) in
late October-early November. Forage triticale (early cycle) was sown after maize, from
October to early November depending on the weather conditions, and was harvested in
May-early June when the grain was in early milk development (Scale 73) (Zadoks et al.,
1974). The forage biomass obtained could be used for dairy cattle feed (silage).

Capítulo 1
22
2.4 Analysis of plants and soil samples
The soil mineral nitrogen content (NO3--N) was determined twice per year, just
before PS fertilization of each crop (October and June). Soil samples were collected up
to a depth of 90 cm every 30 cm. A sample for each plot, at each depth, was obtained by
mixing two different subsamples. Soil mineral content is reported as the sum of soil
NO3--N in the 0-90 cm profile. Soil nitrates were analysed in a certified laboratory by
colorimetric method (Kempers, 1974). Soil NH4+-N was considered insignificant in the
experimental area (Villar-Mir et al., 2002; Berenguer et al., 2008) and was not measured
in this study.
Total fresh crop yield was obtained directly in the field by harvesting each plot with
a conventional reaping-chopping machine. One crop subsample per plot was collected
and stored at 4ºC for a maximum of 48h before analysing DM and N content. The DM
was determined by drying at 60ºC for 48h and its N content was determined by an NIR
spectroscopy procedure. The N uptake was calculated by multiplying plant N content by
DM at harvest.
2.5 Unrecovered N
The N balance was calculated in each plot, separately for each year and crop. Native
soil organic mineralization (Nmin) was estimated in the control plots (PS0) and assuming
that nitrate leaching, ammonia losses and N from rainfall water were negligible in
unfertilized plots according to the equation (Sexton et al., 1996):
1) Nmin = Nf + Nu – Ni
where Nf is post-harvest soil NO3- -N, Nu is the plant N uptake and Ni is pre-plant soil
NO3- -N. A negative value of Nmin was interpreted as N that could not be accounted for.

Pig slurry fertilization in a double-annual cropping
23
Unrecovered N was estimated from the N balance for the fertilized plots (Berenguer
et al., 2009; Cela et al., 2011b) according to the equation:
2) Unrecovered N = Nf + Nu – Ni – Nmin – Nfert
where Nfert is the N applied by fertilization. A negative value for the unrecovered N was
interpreted as the sum of leached NO3--N, N lost by ammonia volatilization and
denitrification, applied organic N, immobilised NH4+-N and clay-fixed NH4
+-N. Whereas
a positive value was interpreted as uncounted N inputs.
2.6 Nitrogen efficiency
The following N-efficiency parameters (López-Bellido and López-Bellido, 2001a)
were calculated for each fertilized treatment in both crops:
3) Apparent N recovery fraction (ANRF; %): (N uptake in fertilized plots - N
uptake in unfertilized plots) / N applied to fertilized plots.
4) Agronomic N efficiency (ANE; kg kg-1): (DM yield in fertilized plots - DM
yield in unfertilized plots) / N applied to fertilized plots.
2.7 Statistical analysis
Statistical analyses of the data were performed using the IBM SPSS statistical
software for Windows, version 23.0 (IBM Corp., Armonk, NY, USA). A mixed-design
analysis of variance model (ANOVA), taking into account the growing seasons as
repeated measures, was carried out to evaluate the response of the variables measured to
PS fertilization. In the mixed-design ANOVA model, the PS treatment was a between-
subjects variable (a fixed effects factor) and the growing season was a within-subjects
variable (a random effects factor). If the interaction of growing seasons and treatment was
significant, special contrasts were performed in order to detect differences, at 0.05
probability level, between combinations of PS fertilization strategies planned. Regression

Capítulo 1
24
analysis was used to relate yield, N uptake and unrecovered N to initial soil NO3--N
content + N applied by PS fertilization (p < 0.05).
3. Results
3.1 Weather conditions during the experimental period
Under rainfed agricultural conditions, total precipitation and mean temperatures are
very important and are presented in Table 3. Total precipitation, recorded during the trial
period, was highly variable between the six experimental growing seasons (sum of rainfall
of both summer and winter crops) with a difference of over 450 mm between maximum
rainfall (994.3 mm in 2011/12) and minimum rainfall (555.8 mm in 2006/07). As annual
average rainfall in the 1985-2006 period was 651 mm, two of the six growing seasons
could be considered dry (2006/07 and 2007/08), three wet (2008/09, 2009/10 and
2010/11) and one very wet (2011/12).
Differences in mean temperature, between the whole growing seasons studied, were
relatively small, varying from 12.6 °C in 2009/10 to 14.0 °C in 2006/07, which were the
coldest and hottest growing seasons, respectively. The annual average temperature
throughout the trial period was 13.2 °C.

Pig slurry fertilization in a double-annual cropping
25
Table 3. Total precipitation (P) and mean air temperature (T) in Torelló for each growing season
in both crops (maize and triticale) for the experimental period (2006-2012) and for the historical
periods (1985-2006).
Season
1985-2006
2006/07 2007/08 2008/09 2009/10 2010/11 2011/12 2006/07-2011/12
P (mm) P (mm) P (mm) P (mm) P (mm) P (mm) P (mm) P (mm)
Maize growing season1 351.9 314.5 237.5 448.5 504.0 523.7 594.3 424.9
Triticale growing season2 299.4 241.3 378.8 377.5 341.5 333.4 400.0 338.8
Total 651.3 555.8 616.3 826.0 845.5 857.1 994.3 763.8
T (°C) T (°C) T (°C) T (°C) T (°C) T (°C) T (°C) T (°C)
Maize growing season1 19.5 20.6 19.1 18.5 19.6 18.7 19.0 19.3
Triticale growing season2 9.9 10.4 8.5 8.7 7.8 8.4 8.6 8.9
Mean * 13.1 14.0 12.7 13.2 12.6 12.8 13.8 13.2
*Mean corresponds to the average monthly value in each growing season and the historical period
(Meteorological Observatory of Torelló). 1 June-October 2 November-May
3.2 Crop yield
Throughout the experiment, average seasonal DM yields (maize + triticale) were
affected significantly by the PS fertilization rate and the growing season and its
interaction (Table 4). An overall significant fertilizer effect of PS on DM yields was
observed between unfertilized treatment (12.6 Mg DM ha-1) and fertilized treatments.
Average DM yields in PSL (17.7 Mg ha-1) was significantly lower than in the remaining
fertilized treatments. Furthermore, significant differences were found between the PSM
and PSH treatments (20.2 and 22.0 Mg DM ha-1, respectively) (Table 4, Fig.1).
Regarding maize, and on average for the six-year study, DM yields were influenced
by the PS fertilization rate and the growing season. However, no interaction between them
were observed (probably due to the great variability). PSH yield was 10.5 Mg DM ha-1,
the maximum yield compared to the low and medium fertilized plots (9.5 and 9.4 Mg DM
ha-1, respectively) and unfertilized plots (8.1 Mg DM ha-1) (Fig. 1). No maize was

Capítulo 1
26
harvested in 2007 as it failed to grow due to a shortage of rainfall during the summer.
Maize did not respond to PS applications in 2006, the maize growing seasons with the
lowest yield (Fig. 1).
The average triticale yield response to PS fertilization treatments interacted with the
growing season factor (Table 4). For the six-year trial, average triticale yield (10.4 Mg
DM ha-1) was about 10% higher than average maize yield (9.4 Mg DM ha-1). It is
important to point out the considerable difference (about 30%) between the DM yields of
the two crops in the PSH and PSM treatments. Furthermore, average triticale yields in
PSH and PSM (13.3 and 12.3 Mg DM ha-1, respectively) were significantly higher than
in the PSL and PS0 treatments (9.8 and 6.1 Mg DM ha-1, respectively). However, no
differences were observed in PSM compared to PSH (Table 4). In the PS0 treatment
across six-year experiment, a continuous decrease of the DM yields was observed
(Fig. 1).
3.3 N uptake
Maize and triticale responded to the applied PS, which affected the N uptake of the
crops. Total N uptake (maize + triticale) averaged over six years in the fertilized PS
treatments were significantly greater than in the control treatment (119 kg ha-1) (Tables 4
and 5). The statistical analysis of the N uptake showed significant differences between
the PSM and PSH treatments (219 and 261 kg ha-1, respectively). When were analysed
PSM together with PSH, these were compared to PSL (190 kg ha-1) and also were found
statistical differences (Tables 4 and 5).
In maize, statistical analysis showed that N uptake varied significantly with the PS
rates and the growing season and its interaction (Table 4). The great variations in maize
yield were associated with N uptake, which oscillated (as annual average) from 83 to 130

Pig slurry fertilization in a double-annual cropping
27
kg N ha-1 for the PS0 and PSH treatments, respectively. In 2007, the failure of maize
caused the absence of N uptake in this growing season (Table 5).
With reference to triticale, average N uptake in the six-year trial was affected by the
PS fertilization rate and the growing season, but no interaction was detected between
these two variables. Average N uptake ranged from 57 to 152 kg N ha-1 for the PS0 and
PSH treatments, respectively. Total average N uptake of all treatments was similar for
triticale and maize (107 and 110 kg N ha-1, respectively) (Table 5).
Table 4. Significant effects on yield, N uptake, initial soil NO3- -N content, apparent N recovery
fraction (ANRF), agronomic N efficiency (ANE) and unrecovered N for all study years.
PS0, PSL, PSM and PSH correspond to zero, low, medium and high dose of treatments of pig
slurry, respectively.
Treat= treatment of PS fertilization. a If the interaction treat*growing season was not significant, no special contrasts were done.
NS: not significant, *, ** and *** significant at 0.05, 0.01 and 0.001 levels, respectively. b Significant effects on total soil NO3
--N (maize + triticale) were not analysed.
Crop Yield
(Mg DM ha-1)
N uptake
(kg ha-1)
Initial soil NO3--N
(kg ha-1)
ANRF
(%)
ANE
(kg kg-1)
Unrecovered N
(kg ha-1)
Maize
Treat * ** ** NS NS NS
Growing season *** *** *** ** *** **
Treat x Growing season NS * *** NS NS NS
PS0 vs PSL, PSM, PSHb - *** ** - - -
PSL vs PSM, PSH - * ** - - -
PSM vs PSH - * ** - - -
Triticale
Treat *** *** ** * * *
Growing season *** *** *** ** *** *
Treat x Growing season *** NS ** NS NS NS
PS0 vs PSL, PSM, PSH *** - ** - - -
PSL vs PSM, PSH *** - * - - -
PSM vs PSH NS - * - - -
Maize + Triticalea
Treat *** *** - NS NS **
Growing season *** *** - *** *** **
Treat x Growing season *** * - NS NS *
PS0 vs PSL, PSM, PSH *** *** - - - -
PSL vs PSM, PSH *** *** - - - **
PSM vs PSH ** *** - - - **

Capítulo 1
28
Fig. 1. Yield during the experiment and the average values from 2006 to 2012 for different PS
fertilization rates. PS0, PSL, PSM and PSH correspond to zero, low, medium and high dose of
treatments of pig slurry, respectively. In 2007, maize crop failed due to shortage of rainfall during
the summer. Error bars indicate standard deviation of the mean.

Pig slurry fertilization in a double-annual cropping
29
Table 5 . N uptake during the experiment and the average values from 2006 to 2012.
Crop Treat Rate
(kg N ha 1)
N uptake
(kg ha -1)
2006 2007 a 2008 2009 2010 2011 2006-2012
Maize PS0 0 76 - 97 66 72 102 83
PSL 170 66 - 118 97 130 150 112
PSM 170 69 - 129 100 130 150 115
PSH 250 72 - 144 111 158 167 130
Mean 70 - 122 93 122 142 110
2006/07 2007/08 2008/09 2009/10 2010/11 2011/12 2006-2012
Triticale PS0 0 96 73 68 35 35 35 57
PSL 0 125 123 120 72 80 58 96
PSM 80 130 145 131 113 130 89 123
PSH 80 164 175 183 126 169 100 152
Mean 129 129 125 87 103 71 107
2006/07 2007/08 2008/09 2009/10 2010/11 2011/12 2006-2012
Maize
+
Triticale
PS0 0 136 73 166 101 107 137 119
PSL 170 190 123 238 169 209 208 190
PSM 250 198 145 260 213 260 239 219
PSH 330 236 175 327 237 326 267 261
Mean 195 129 248 180 226 213 198
PS0, PSL, PSM and PSH correspond to zero, low, medium and high dose of treatments of pig
slurry, respectively.
Treat= treatment of PS fertilization. a Maize crop failed in this growing season due to shortage of rainfall during the summer.
3.4 Soil NO3--N content
Six-year average soil NO3--N content after maize and triticale harvest, respectively,
were affected significantly by the PS fertilization rate and the growing season and its
interaction (Table 4). Average soil NO3--N levels in October, after the maize harvest, were
almost three times higher than those for June, after the triticale harvest (149 and 55 kg
NO3--N ha-1, respectively) (Table 6).
For both the October and June sampling dates, PS fertilization increased significantly
the soil NO3--N content compared to a PS0 treatments (Tables 4 and 6). Either in the
October or in June sampling dates, average soil NO3--N contents in PSL was significantly
lower than in the remaining fertilized treatments. Moreover, significant differences were

Capítulo 1
30
found between the PSM and PSH treatments after the maize and triticale harvest,
respectively (Table 4 and 6).
Considerable variation in residual soil NO3--N content was observed throughout the
growing seasons according to the amount of PS applied to the previous crop. In 2007,
maize was not harvested. Consequently, no N was removed from the plant-soil system
resulting in a very high soil NO3--N content in October 2007 (Fig. 2). The soil NO3
--N
levels were considerably higher in October than in June for each growing season and for
each PS rates. On unfertilized plots and those receiving little fertilization, there was
evident soil NO3--N depletion over time. This reduction was less noticeable with medium
and highly PS fertilized treatments (Fig. 2).
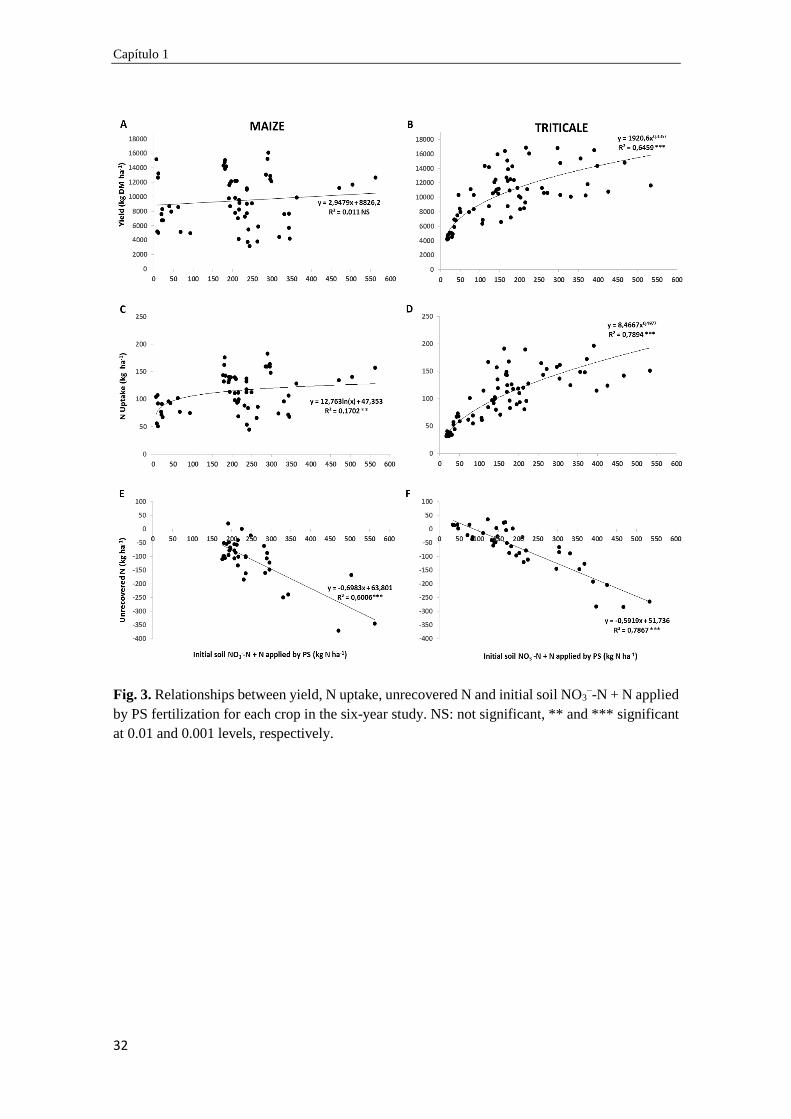
Relationships between the different variables measured during the six-year study and
the sum of initial soil NO3--N content + N applied by PS fertilization, are presented in
Fig. 3. Regression analysis showed that the relationships between variables and soil
NO3--N content + N applied were less marked in maize than in triticale. In maize, yield
was not affected significantly by soil NO3--N content + N applied (Fig. 3A). Conversely,
maize N uptake and unrecovered N varied significantly according this parameter (Fig. 3C
and E). In triticale, a high significance was observed in the relationships between the
different variables and soil NO3--N content + N applied (Fig. 3B, D and F).
Table 6. Average soil nitrate NO3--N content (kg NO3
--N ha-1) from 2006 to 2012, after triticale
harvest (June) and after maize harvest (October). Depth 0-90 cm. Treatment June October
PS0 36 65
PSL 43 139
PSM 55 158
PSH 88 234
Means 55 149
PS0, PSL, PSM and PSH correspond to zero, low, medium and high dose of treatments of pig
slurry, respectively.
Pig slurry fertilization in a double-annual cropping
31
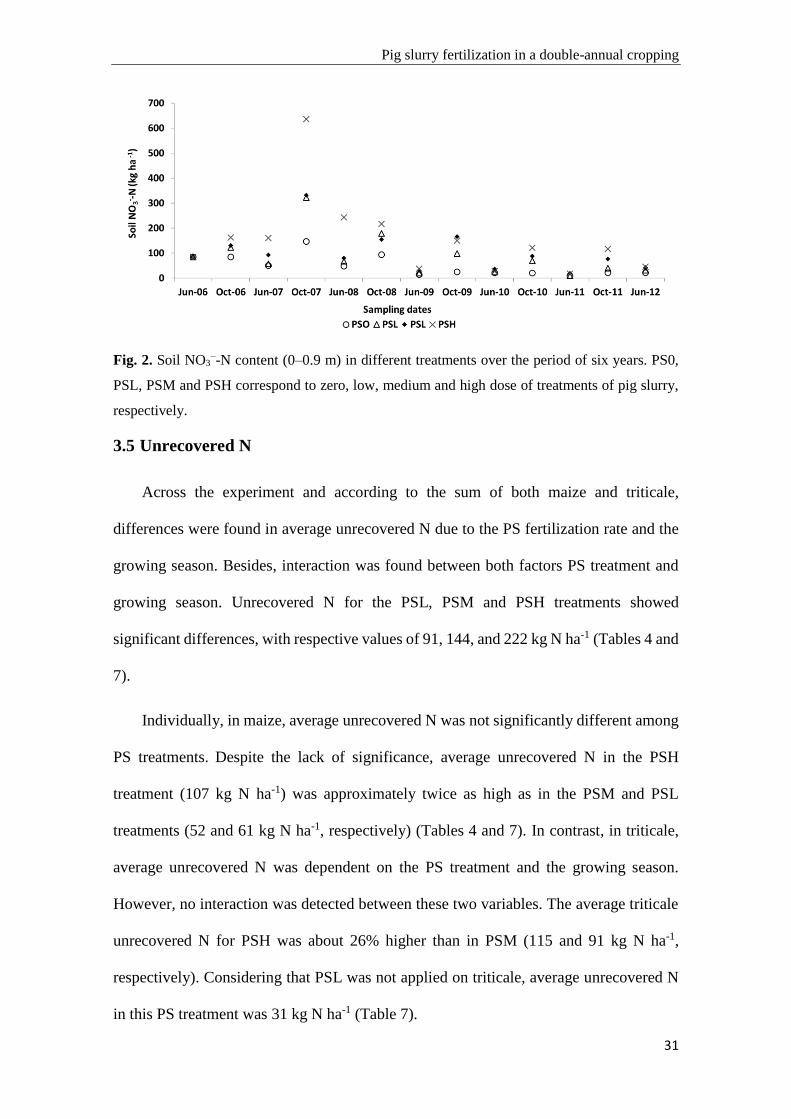
Fig. 2. Soil NO3−-N content (0–0.9 m) in different treatments over the period of six years. PS0,
PSL, PSM and PSH correspond to zero, low, medium and high dose of treatments of pig slurry,
respectively.
3.5 Unrecovered N
Across the experiment and according to the sum of both maize and triticale,
differences were found in average unrecovered N due to the PS fertilization rate and the
growing season. Besides, interaction was found between both factors PS treatment and
growing season. Unrecovered N for the PSL, PSM and PSH treatments showed
significant differences, with respective values of 91, 144, and 222 kg N ha-1 (Tables 4 and
7).
Individually, in maize, average unrecovered N was not significantly different among
PS treatments. Despite the lack of significance, average unrecovered N in the PSH
treatment (107 kg N ha-1) was approximately twice as high as in the PSM and PSL
treatments (52 and 61 kg N ha-1, respectively) (Tables 4 and 7). In contrast, in triticale,
average unrecovered N was dependent on the PS treatment and the growing season.
However, no interaction was detected between these two variables. The average triticale
unrecovered N for PSH was about 26% higher than in PSM (115 and 91 kg N ha-1,
respectively). Considering that PSL was not applied on triticale, average unrecovered N
in this PS treatment was 31 kg N ha-1 (Table 7).
Capítulo 1
32
Fig. 3. Relationships between yield, N uptake, unrecovered N and initial soil NO3−-N + N applied
by PS fertilization for each crop in the six-year study. NS: not significant, ** and *** significant
at 0.01 and 0.001 levels, respectively.

Pig slurry fertilization in a double-annual cropping
33
Table 7. Estimated unrecovered N during the experiment and the average values from 2007 to
2012.
Crop Treatment Rate
(kg ha-1)
Unrecovered N (kg ha-1)
2007 2008 2009 2010 2011 2007-2012
Maize PS0a 0 96 142 77 71 114 92
PSL 170 27 -65 -97 -66 -104 -61
PSM 170 -1 -90 -36 -59 -76 -52
PSH 250 125 -294 -161 -88 -118 -107
2007/08 2008/09 2009/10 2010/11 2011/12 2007-2012
Triticale PS0a 0 -25 -11 32 25 35 20
PSL 0 -107 -27 -34 -4 15 -31
PSM 80 -152 -69 -131 -44 -62 -91
PSH 80 -264 -73 -111 -39 -86 -115
2007/08 2008/09 2009/10 2010/11 2011/12 2007-2012
Maize PS0a 0 71 132 109 95 149 112
+ PSL 170 -81 -92 -123 -70 -90 -91
Triticale PSM 250 -153 -160 -166 -103 -138 -144
PSH 330 -139 -367 -273 -128 -204 -222
PS0, PSL, PSM and PSH correspond to zero, low, medium and high dose of treatments of pig
slurry, respectively.
In 2006, no unrecovered N was calculated because the initial level of soil nitrate NO3- content
was the same in each treatment, corresponding to initial soil analysis at the beginning the
experiment. aPS0 corresponds to estimated N mineralization in control plots, necessary to calculate
unrecovered N in the other treatments.
3.6 N efficiency
After six consecutive years of PS application, when considering maize and triticale
together, either average ANRF or ANE did not differ among the different PS treatments
(Tables 4).
In maize, overall average ANRF and ANE throughout the trial were 23.3% and 11.2
kg DM kg-1, respectively. PS treatments did not affect either average ANRF or ANE with
very similar values observed in all treatments (Table 8).

Capítulo 1
34
In triticale, overall average ANRF and ANE throughout the experiment were 109.2%
and 94.9 kg DM kg-1, respectively. Both average ANRF and ANE varied significantly
with the PS rates and the growing season, but no interaction between them were observed
(Table 8).

Pig slurry fertilization in a double-annual cropping
35
Table 8. Average apparent N recovery fraction (ANRF) and apparent N efficiency (ANE) during the experiment and the average values from 2006 to
2012. Crop Treat Rate
(kg ha -1)
ANRF
(%)
ANE
(kg kg-1)
2007 2008 2009 2010 2011 2007-
2011 2007 2008 2009 2010 2011 2007-2011
Maize PSL 170 14,0 15,7 33,8 28,3 23,0 11,4 10,2 22,5 2,6 11,7
PSM 170 21,0 17,4 33,8 28,3 25,1 16,0 7,3 18,3 2,0 10,9
PSH 270 17,4 14,4 31,5 24,4 21,9 12,7 7,2 20,1 4,2 11,1
Means 17,5 15,8 33,1 27,0 23,3 13,4 8,3 20,3 2,9 11,2
2007/08 2008/09 2009/10 2010/11 2011/12 2007/08- 2011/12
2007/08 2008/09 2009/10 2010/11 2011/12 2007/08- 2011/12
Triticale PSLa 0 - - - - - - - - - - - -
PSM 80 103,4 71,8 94,4 119,1 67,2 91,2 57,6 70,8 102,0 131,3 84,2 89,2
PSH 80 146,1 131,6 111,2 167,1 80,4 127,3 68,8 94,3 108,5 146,7 85,0 100,7
Means 124,7 101,7 102,8 143,1 73,8 109,2 63,2 82,6 105,2 139,0 84,6 94,9
2007/08 2008/09 2009/10 2010/11 2011/12 2007/08-
2011/12 2007/08 2008/09 2009/10 2010/11 2011/12
2007/08-
2011/12
Maize PSL 170 35,0 47,8 34,8 60,0 43,1 44,1 21,6 36,5 32,4 53,6 24,9 33,8
+ PSM 250 34,0 39,5 40,3 61,1 41,6 43,3 18,9 36,0 35,5 54,5 28,3 34,6
Triticale PSH 330 31,5 45,2 34,8 62,5 37,8 42,4 14,8 32,6 28,5 49,1 22,7 29,5
Means 33,5 44,2 36,6 61,2 40,8 43,3 18,5 35,0 32,1 52,4 25,3 32,7
PS0, PSL, PSM and PSH correspond to zero, low, medium and high dose of treatments of pig slurry, respectively.
Treat= treatment of PS fertilization. aPSL: no PS fertilization was applied at this time.

Capítulo 1
36
4. Discussion
4.1 Crop yield and N uptake
In the present study, there was no response to PS applications in 2006, and maize
yields and N uptake were similar in all treatments. These results are in agreement with
previous researches in nearby areas (Berenguer et al., 2009; Yagüe and Quílez, 2010b).
This type of response can be explained by the fact that the total amount of initial soil N
available to maize in the PS0 treatment was adequate to obtain yields similar to those
obtained with PS fertilized treatments. Soil NO3--N content at the beginning of the trial
was similar for all treatments, due to PS had been applied before the experiment at the
same dose. In this way, this previous PS fertilization might have induced high N
mineralization in control plots. Nevertheless, throughout the six-year study, there was not
a clear relationship between maize DM yields and initial soil NO3--N content + N applied
by PS fertilization (Fig. 3A). Maize DM yield was influenced mainly by weather
conditions during the experiment. Due to major variations in rainfall during its growth,
maize DM yields and N uptake varied greatly throughout the six-year experiment (Table
5, Fig. 1). These differences can be partially explained as the result of very low
precipitation during June and July in some years. Temperatures are also normally high in
these summer months and a combination of these two factors can lead to a decrease in
DM yield. In fact, this situation was clearly observed in 2007, when low precipitation
during the growing season (237.5 mm) was insufficient for crop growth.
In general, our maize DM yields and N uptakes can be considered very low compared
to those of other areas under irrigation, such as the Po Valley in Northern Italy (Grignani
et al., 2007; Borrelli et al., 2014) or other areas of Spain (Yagüe and Quílez, 2010b; Cela
et al., 2011a). However, in the area considered in the present study, maize is normally

Pig slurry fertilization in a double-annual cropping
37
grown in rainfed conditions although, as we have seen, in some years the crop fails owing
to low rainfall during the growing season (mainly June and July). This fact, as well as the
much lower maize DM yields compared to triticale, suggests that other crops, such as
forage sorghum, should be considered in the rotation.
In triticale, similarly to maize, DM yields in PS0 were high at the beginning of the
six-year experiment. The N mineralized arising from long term PS application previous
to the experiment, could have led to supply N deficiency in control plots (PS0) in the first
two growing seasons of the trial. After 2009, there was a depletion of soil NO3--N content,
and consequently triticale DM yields decreased throughout the time on unfertilized plots.
Triticale DM yields and N uptake were also affected by rainfall during the growing
season, although less than in maize DM yields. Winter cereal growth can be influenced
by many factors, including the response to N fertilization and particularly soil water
content during the growing season (Pardo et al., 2009; López-Bellido et al., 2001b) and
initial soil NO3--N content. In our study, triticale yields and N uptake were both clearly
influenced by initial soil NO3--N and PS fertilization rates (Fig. 3B and D). This suggests
that PS fertilization should be based on initial soil NO3--N levels and could be considered
a good tool for improving N fertilization recommendations.
The highest average total N uptake in the six-year trial was obtained when PSH was
applied (261 kg N ha-1). Moreover, maize N uptake never exceeded 167 kg N ha-1 in the
growing seasons of the study considered wet. This suggests that over-fertilization in
maize could have occurred in the PS fertilized treatment for most growing seasons. In
contrast, during triticale growing seasons, N uptakes were considerably higher than the
80 kg N ha-1 applied before triticale sowing in the PSH and PSM treatments.
Consequently, these results suggest that the dose of N fertilization in the form of PS
should be adjusted for both crops of the rotation. This fact could avoid over-fertilization

Capítulo 1
38
in maize and incomplete fertilization in triticale, and consequently, increase the efficiency
of crop N uptake and reducing the risk of NO3-- N lixiviation.
The highest DM yields, when taking maize + triticale into account on the average the
six-year trial, were achieved when PS rates above 170 kg N ha-1 year-1 of organic fertilizer
allowed by Nitrates Directive 91/676, (EEC, 1991) were applied. This finding is in
agreement with Yagüe et al. (2013a) who observed in a maize-barley double-cropping
experiment that applying the maximum dose of organic fertilizer allowed by Nitrates
Directive 91/676, (EEC, 1991) could only cover the N needs of the barley. Similarly,
Perramon et al. (2016) concluded that in high N-demanding double-cropping systems, it
is possible to increase the amount of N applied in organic form up to 250 kg N ha−1. Such
limitations on organic fertilizer applications should take into account that N needs, in
double-cropping systems, are higher than when only one crop per year is grown.
4.2 Soil NO3--N content
Soil nitrate accumulation observed in October, in the PSH and PSM treatments,
particularly in growing seasons, such as 2007, could increase the risk of N leaching during
autumn and winter in periods of heavy rain (Liu et al., 2003; Nevens and Reheul, 2005;
Brye et al., 2003).
Average soil NO3--N content was considerably higher in October than in June (Table
6), possibly because of the higher PS applications and N mineralization in late summer-
early autumn. This process may be affected by soil moisture and temperature (Qiu et al.,
2012). More favourable conditions (moisture and temperature) during the maize crop
season than during the winter cereal crop cycle, could increase N mineralization rates
(Yagüe and Quílez, 2015).
Pig slurry fertilization in a double-annual cropping
39
Several authors (Beauchamp, 1986; Schröder, 2005a; Qiu et al., 2012) have reported
that in contrast to the soil mineral N content which is immediately available to plants and
may be easily quantified, the release from organic forms is dependent on the
mineralization process. Therefore, any immobilized N would potentially be available for
mineralization in subsequent crops and years in double-cropping systems. In these
cropping systems, the residual soil NO3--N from previous crops could potentially be taken
up by the next crop partially avoiding N leaching of nitrates. Average triticale DM yield,
despite PSH and PSM plots being fertilized with only 80 kg ha-1 and PSL plots not being
fertilized in this crop, was higher than average maize DM yield throughout the
experiment. This fact could be attributed principally to high residual levels of soil
NO3--N observed after the maize harvest. Consequently, the total annual N fertilization
applied before maize sowing in the PSH, PSM and PSL treatments had an important
residual effect on the subsequent triticale DM yield.
These results are in agreement with those of Grignani et al. (2007) who observed that
in a double-annual crop rotation of maize and Italian ryegrass, the lower N uptake of late-
sown maize was compensated by the ryegrass, which exploited residual N as a catch crop.
Therefore, to reduce nitrate loading and improve N use efficiency, the N mineralized from
previous PS applications should be taken into account in a fertilization plan (Nicholson
et al., 1999). Krueger et al. (2012) also reported that a rye-maize double crop prevented
the build-up of soil NO3--N, thereby reducing the risk of off-site N transport. Yagüe and
Quílez (2013b) suggested that double-cropping also promotes higher efficiency in the use
of residual N of the slurry during the year following the application.
4.3 Unrecovered N and N efficiency
Total unrecovered N (maize + triticale) was greater in plots fertilized with maximum
PS rates than in plots fertilized with medium and low PS doses (Table 7). However, these

Capítulo 1
40
trends could be misinterpreted according to several authors (Scherer and Weimar, 1994;
Daudén and Quílez, 2004; Berenguer et al., 2008) because the NH4+-N can be fixed in the
interlayer of the clay minerals when PS is applied as fertilizer. A large part of the mineral
N applied with PS can be immobilized by microorganisms. This immobilization and/or
fixation of N could be key in the N budget, especially in double-cropping systems due to
part of the immobilized N can be mineralized in subsequent years.
Yagüe and Quílez (2015) suggested that soil organic matter mineralization (74 kg
N ha-1) probably contributed to the fertilizer replacement value of PS treatments because
of the residual effect of PS. Similarly, Hartmann et al. (2014) reported that the
quantification of organic N mineralization from slurry may be an important step to
improve N use efficiency and to reduce N lost to the environment. Additionally, Sieling
et al. (2014) reported a mineralization rate of 35-50% of organically bound slurry N. In
this experiment, there was an important supply of N from the soil due to N mineralization
(considered from 0 to 90 cm), as could be observed in average N uptake and N
mineralization in PS0 (119 and 112 kg N ha-1, respectively) (Table 5 and 7). On the other
hand, it is remarkable that, either ANRF or ANE, were very low in maize. Whereas, in
triticale, ANRF, was considerably great compared to 41% (López-Bellido et al., 2006)
and 24% (Bosch-Serra et al., 2015) achieved in other rainfed conditions areas. This high
N efficiency in triticale, could be due to high residual soil NO3--N, which may have
supplemented partially the N requirements of the crop. Therefore, N mineralization and
residual effects from PS should be taken into account when recommending corresponding
PS fertilization in double-cropping systems (Kayser et al., 2010).
In this six-year trial, the residual effect of PS could have resulted in an important
increase in soil NO3--N levels in the October sampling dates corresponding to initial soil
NO3--N in triticale. These high levels of soil NO3
--N content could lead to increase

Pig slurry fertilization in a double-annual cropping
41
unrecovered N (possibly by lixiviation) during the triticale season. This triticale residual
effect resulted in a 26% increase in unrecovered N in the PSH treatment compared to the
PSM treatment, although triticale in both treatments was fertilized with the same dose of
PS (80 kg N ha-1).
Unrecovered N (mainly probably due to N leaching) were influenced by PS
fertilization rates and by initial soil NO3--N content (Fig. 3E and F). In the growing
seasons with a high initial soil NO3--N content, unrecovered N were also very elevated
suggesting, an over fertilization in high PS fertilized treatments. We observed low N
uptake and consequently low DM yield in maize due mainly to the large variations in
rainfall during its growth. This fact may contribute to high residual soil NO3--N after
maize harvesting, increasing the risk of NO3--N lixiviation. The levels of N mineralization
observed in maize could also have increased these nitrate levels. A decrease in the dose
of N fertilization in the PS treatments in the summer crop may, therefore be worth
considering. Furthermore, under rainfed Mediterranean conditions, the fact that the
greatest probability of high rainfall is from October to January, as well as the very low
crop water absorption during autumn, could significantly increase the risk of N losses by
leaching. Due to a lower plant N recovery, a higher negative impact on the environment
(via N leaching or denitrification) can be expected after slurry application, especially in
autumn applications (Bergström and Kirchmann, 2006; Bhogal et al., 2000; Giola et al.,
2012). In our cropping conditions, in order to avoid part of these N losses, instead of PS
application before the crop is sown in October, PS fertilization could be applied as side
dressing at triticale tillering. In agreement with Sieling et al. (2014), slurry should be
applied in early spring in order to reduce any negative environmental impact. This is also
in line with other studies, such as those by Petersen (1996) and Jackson and Smith (1997)

Capítulo 1
42
who reported higher N use efficiency in cereals when the slurry is applied in spring
instead in autumn.
5. Conclusions
In our six-year study of a triticale-maize double-annual cropping system, the optimal
rate of PS fertilization to maize DM yields, varied greatly from year to year depending
especially on weather conditions during the experiment. In triticale, DM yields were
clearly influenced by initial soil NO3--N and rates PS fertilizer application.
Unrecovered N was affected by PS fertilization rate and initial soil NO3--N content.
The PS fertilization treatments with 170 and 250 kg N ha-1 applied before maize sowing
had an important effect on DM yield of the subsequent triticale crop due to a residual
effect which increased soil NO3--N levels. A high initial soil NO3
--N content may lead to
over fertilization in high PS fertilized treatments and consequently to an increase in N
losses by lixiviation.
In our cropping conditions, to avoid part of these N losses, it is suggested a reduction
in the dose of N fertilization in the PS treatments in the summer crop. Furthermore,
instead of PS application before the crop is sown in October, PS fertilization could be
applied as side dressing at triticale tillering.
The application of N, in the form of PS, at rates higher than the legally permitted by
the Nitrates Directive 91/676 (EEC, 1991) in NVZs, may result in better yields. However,
may originate in significantly lower N use efficiency and a higher potential environmental
impact.
In view of these results, PS fertilization recommendations should never be made
using fixed rate of N applications based on yield goals. Further studies are necessary to
establish optimum PS fertilization rates, taking into account the potential N residual

Pig slurry fertilization in a double-annual cropping
43
effects and N mineralization/immobilization, and also with a view to achieving higher
efficiencies of the N applied in slurry.
6. References
Abad, A., Lloveras, J., Michelena, A., 2004. Nitrogen fertilization and foliar urea effects
on durum wheat yield and quality and on residual nitrate in irrigated Mediterranean
conditions. Field Crops Res. 87, 257–269.
Angás, P., Lampurlanés, J., Cantero-Martínez, C., 2006. Tillage and N fertilization:
effects on N dynamics and barley yield under semiarid Mediterranean conditions.
Soil Till. Res. 87, 59–71.
Beauchamp, E.G., 1986. Availability of nitrogen from three manures to corn in the field.
Can. J. Soil Sci. 66, 713–720.
Berenguer, P., Santiveri,F., Boixadera,J., Lloveras, J., 2008. Fertilisation of irrigated
maize with pig slurry combined with mineral nitrogen. Eur. J. Agron. 28, 635–645.
Berenguer, P., Santiveri,F., Boixadera,J., Lloveras, J., 2009. Nitrogen analysation of
irrigated maize under Mediterranean conditions. Eur. J. Agron. 30, 163–171.
Bergström, L., Kirchmann, H., 2006. Leaching and crop uptake of nitrogen and phos-
phorus from pig slurry as affected by different application rates. J. Environ. Qual.
35, 1803–1811.
Bhogal, A., Rochford, A.D., Sylvester-Bradley, R., 2000. Net changes in soil and
cropnitrogen in relation to the performance of winter wheat given wide-
rangingannual nitrogen applications at Ropsley, UK. J. Agric. Sci. 135, 139–149.
Biau, A., Santiveri, F., Mijangos, I., Lloveras, J., 2012. The impact of organic and mineral
fertilizers on soil quality parameters and the productivity of irrigated maizecrops in
semiarid regions. Eur. J. Soil Biol. 53, 56–61.

Capítulo 1
44
Borrelli,L., Castelli,F., Ceotto,E., Cabassi,G., Tomasoni, C., 2014. Maize grain and silage
yield and yield stability in a long-term cropping system experiment in Northern Italy.
Eur. J. Agron. 55, 12–19.
Bosch-Serra, A.D., Ortiz, C., Yagüe, M.R., Boixadera, J., 2015. Strategies to optimize
nitrogen efficiency when fertilizing with pig slurries in dryland agricultural systems.
Eur. J. Agron. 67, 27–36.
Brye, K.R., Norman, J.M., Gower, S.T., Bundy, L.G., 2003. Methodological limitations
and N-budget differences among a restored tallgrass prairie and maize
agroecosystems. Agric. Ecosyst. Environ. 97, 181–198.
Cavalli, D., Cabassi, G., Borrelli, L., Geromel, G., Bechini, L., Degano, L., Marino
Gallina, P., 2016. Nitrogen fertilizer replacement value of undigested liquid cattle
manure and digestates. Eur. J. Agron. 73. 34–41.
Cela, S., Santiveri, F., Lloveras, J., 2011a. Residual effects of pig slurry and mineral
Nitrogen fertilizer on irrigated wheat. Eur. J. Agron. 34, 257–262.
Cela, S., Santiveri, F., Lloveras, J., 2011b. Optimum nitrogen fertilization rates for
second-year corn succeeding alfalfa under irrigation. Field Crops Res. 123, 109–
116.
Chantigny, M.H., Angers, A.D., Masse, D., Morvan, T., Pomar, C., 2004. Dynamics of
pig slurry nitrogen in soil and plant as determined with 15N. Soil Sci. Soc. Am. J. 68,
637–643.
Dauden, A., Quilez,D., Martinez,C., 2004. Residual effects of pig slurry on yield and N
uptake of a subsequent wheat crop. Soil Use Manage. 20, 156– 162.
Demurtas, C.E., Seddaiu, G., Ledda, L., Cappai, C., Doro, L., Carletti, A., Roggero, P.P.,
2016. Replacing organic with mineral N fertilization does not reduce nitrate leaching

Pig slurry fertilization in a double-annual cropping
45
in double crop forage systems under Mediterranean conditions. Agric. Ecosyst.
Environ. 44, 78–86.
EEC, 1991. Council Directive of 12 December 1991 concerning the protection of waters
against pollution caused by nitrates from agricultural sources. Off. J. Eur. Commun.,
91/676/EEC.
Eurostat. 2013. Number of pigs. European Comission, Luxembourg.
http://epp.eurostat.ec.europa.eu/portal/page/portal/eurostat/home/
Giola, P., Basso, B., Pruneddu, G., Giunta, F., Jones, J.W., 2012. Impact of manure and
slurry applications on soil nitrate in a maize–triticale rotation: field study and long
term simulation analysis. Eur. J. Agron. 38, 43–53.
Gollany, H.T., Molina, J.E., Clapp, C.E., Allmaras, R.R., Layese, M.F., Baker, J.M.,
Cheng, H.H., 2004. Nitrogen leaching and denitrification in continuous corn as
related to residue management and nitrogen fertilization. Environ. Manage. 33, 289–
298.
Grignani, C., Zavattaro, L., Sacco, D., Monaco, S., 2007. Production, nitrogen and carbon
balance of maize-based forage systems. Eur. J. Agron. 26, 442–453.
Guo, R., Li, X., Christie, P., Chen, Q., Zhang, F., 2008. Seasonal temperatures have more
influence than nitrogen fertilizer rates on cucumber yield and nitrogen uptake in a
double cropping system. Environ. Pollut. 151, 443–451.
Hanway, J.J, Ritchie, S.W., 1984. How a corn plant develops: special report. 48, Iowa
State University.
Hartmann, T.E., Yue, S., Schulz, R., Chen, X., Zhang, F., Müller, T., 2014. Nitrogen
dynamics, apparent mineralization and balance calculations in a maize – wheat
double cropping system of the North China Plain. Field Crops Res. 160, 22–30.

Capítulo 1
46
Hernández,D., Polo, A., Plaza, C., 2013. Long-term effects of pig slurry on barley yield
and N use efficiency under semiarid Mediterranean conditions. Eur. J. Agron. 44,
78–86.
Jackson, D.R., Smith, K.A., 1997. Animal manure slurries as a source of nitrogen for
cereals; effect of application time on efficiency. Soil Use Manage. 13, 75–81.
Jensen, L.S., Pedersen, I.S., Hansen, T.B., Nielsen, N.E., 2000. Turnover and fate of N-
15-labelled cattle slurry ammonium-N applied in the autumn to winter wheat. Eur.
J. Agron. 12, 23–35.
Kayser, M., Muller, J., Isselstein, J., 2010. Nitrogen management in organic farming:
comparison of crop rotation residual effects on yields, N leaching and soil
conditions. Nutr. Cycling Agroecosyst. 87, 21–31.
Kempers, A. J., 1974. Determination of sub- microquantities of ammonium and nitrates
in soils with fenol, sodium nitroprusside and hypochlorite. Geoderma 12, 201–206.
Krueger, E.S., Ochsner, T.E., Baker, J.M., Porter, P.M., Reicosky, D.C., 2012. Rye–corn
silage double-cropping reduces corn yield but improves environmental impacts.
Agron. J. 104, 888–896.
Liu, X., Ju, X., Zhang, F., Pan, J., Christie, P., 2003. Nitrogen dynamics and budgets in a
winter wheat–maize cropping system in the North China Plain. Field Crops Res.
83, 111–124.
López-Bellido, R.J., López-Bellido, L., 2001a. Efficiency of nitrogen in wheat under
Mediterranean conditions: effect of illage, crop rotation and N fertilization. Field
Crops Res. 71, 31–46.
López-Bellido, L., López-Bellido, R.J., Castillo, J.E., López-Bellido, F.J. 2001b. Effects
of long-term tillage, crop rotation and nitrogen fertilization on bread-making quality
of hard red spring wheat. Field Crops Res. 72, 197–210.
Pig slurry fertilization in a double-annual cropping
47
López-Bellido, L., López-Bellido, R.J., López-Bellido, F.J., 2006. Fertilizer nitrogen
efficiency in durum wheat under rainfed mediterranean conditions: effect of
split application. Agron. J. 98, 55–62.
Lloveras. J., 1987. Traditional cropping systems in Northwestern Spain (Galicia). Agric.
Syst. 23, 259–275.
MAGRAMA. 2012. Encuesta sobre superficies y rendimientos de cultivo Resultados
2012 (ESYRCE). Gobierno de Espana, Madrid.
www.magrama.gob.es/es/estadistica/temas/estadisticasagrarias/Boletin2012web_tc
m7- 283312.pdf.
Monaco, S., Hatch, D.J., Sacco, D., Bertora, C., Grignani, C., 2008. Changes in chemical
and biochemical soil properties induced by 11-yr repeated additions of different
organic materials in maize-based forage systems. Soil Biol. Biochem. 40, 608–615.
Morvan, T., Leterme, P., Arsense, G.G., Mary, B., 1997. Nitrogen transformation after
the spreading of pig slurry on bare soil and ryegrass using 15N-labelled ammonium.
Eur. J. Agron. 7, 181–188.
Nevens, F., Reheul, D., 2005. Agronomical and environmental evaluation of a long-term
experiment with cattle slurry and supplemental inorganic N applications in silage
maize. Eur. J. Agron. 22, 349–361.
Nicholson, F.A., Chambers, B.J., Smith, K.A., Harrison, R., 1999. Spring applied organic
manures as a source of nitrogen for cereal crops: experiments using field scale
equipment. J. Agric. Sci. 133, 353–363.
Pardo, G., Cavero, J., Aibar, J., Zaragoza, C., 2009. Nutrient evolution in soil and cereal
yield under different fertilization type in dryland. Nutr. Cycling Agroecosyst
84, 267–279.

Capítulo 1
48
Perego, A., Giussani, A., Fumagalli, M., Sanna, M., Chiodini, M., Carozzi, M., Alfieri,
L., Brenna, S., Acutis, M., 2013. Crop rotation, fertilizer types and application
timing affecting nitrogen leaching in nitrate vulnerable zones in Po Valley. Ital. J.
Agrometeorol. 18, 39–50.
Perramon, B., Bosch-Serra, A.D., Domingo, F., Boixadera, J., 2016. Organic and mineral
fertilization management improvements to a double-annual cropping system under
humid Mediterranean conditions. Eur. J. Agron. 76, 28–40.
Petersen, J., 1996. Fertilization of spring barley by combination of pig slurry and mineral
nitrogen fertilizer. J. Agric. Sci. 127, 151–159.
Qiu, S., Ju, X., Lu, X., Li, L., Ingwersen, J., Streck, T., Christie, P., Zhang, F., 2012.
Improved nitrogen management for an intensive winter wheat/summer maize
double-cropping system. Soil Sci. Soc. Am. J. 76, 286–297.
Ramos, C., Agut, A., Lidon, A.L., 2002. Nitrate leaching in important crops of the
Valencian Community region (Spain). Environ. Pollut. 118, 215–223.
Scherer, H.W., Weimar, S., 1994. Fixation and release of ammonium by clay minerals
after slurry application. Eur. J. Agron. 3, 23–28.
Schröder, J. 2005a. Revisiting the agronomic benefits of manure: a correct assessment
and exploitation of its fertilizer value spares the environment. Bioresour. Technol.
96, 253–261.
Schröder, J.J., Jansen, A.G., Hilhorst, G.J., 2005b. Long-term nitrogen supply from cattle
slurry. Soil Use and Manage. 21, 196–204.
Sexton, B. T., Moncrief, J.F., Rosen, C.J., Gupta, S.C., Cheng, H.H., 1996. Optimizing
nitrogen and irrigation inputs for corn based on nitrate leaching and yield on a
coarse-textured soil. J. Environ. Qual. 25, 982–992.

Pig slurry fertilization in a double-annual cropping
49
Shang, Q., Gao, C., Yang, X., Wu, P., Ling, N., Shen, Q., Guo, S., 2014. Ammonia
volatilization in Chinese double rice-cropping systems: a 3-year field measurement
in long-term fertilizer experiments. Biol. Fertil. Soils 50, 715–725.
Sieling, K., Ni, K., Kage, H., 2014. Application of pig slurry-First year and residual
effects on yield and N balance. Eur. J. Agron. 59, 13–21.
Sørensen, S.G., Jensen, E.S., 1995. Mineralization–immobilization and plant uptake of
nitrogen as influenced by the spatial distribution of cattle slurry in soils of different
texture. Plant Soil 173, 283–291.
Sørensen, P., Amato, M., 2002. Remineralisation and residual effects of N after
application of pig slurry to soil. Eur. J. Agron. 16, 81–95.
Tomasoni, C., Borrelli, L., Ceotto, E., 2011. Effect of integrated forage rotation and
manure management on yield, nutrient balance and soil organic matter. Ital. J.
Agron. 6, 55–60.
Trindade, H., Coutinho, J., Jarvis, S., Moreira, N., 2001. Nitrogen mineralization in sandy
loam soils under an intensive double-cropping forage system with dairy-cattle slurry
applications. Eur. J. Agron. 15, 281–293.
Trindade, H., Coutinho, J., Jarvis, S., Moreira, N., 2009. Effects of different rates and
timing of application of nitrogen as slurry and mineral fertilizer on yield of herbage
and nitrate-leaching potential of a maize/Italian ryegrass cropping system in north-
west Portugal. Grass Forage Sci. 64, 2–11.
Villar-Mir, J. M., Villar-Mir, P., Stockle, C.O., Ferrer, F., Aran, M., 2002. On-farm
monitoring of soil nitrate-nitrogen in irrigated cornfields in the Ebro Valley
(northeast Spain). Agron. J. 94, 373–380.
Wachendorf,M., Büchter, M., Volkers, K.C., Bobe,J., Loges, R., Taube, F., 2006.
Performance and environmental effects of forage production on sandy soils. IV.

Capítulo 1
50
Impact of grass under-storey, slurry application and mineral N fertilizer on nitrate
leaching under maize for silage. Grass Forage Sci. 61, 243–252.
Yagüe, M.R., Quílez, D., 2010a. Response of maize yield, nitrate leaching, and soil
nitrogen to pig slurry combined with mineral nitrogen. J. Environ. Qual. 39, 686–
696.
Yagüe, M.R., Quílez, D., 2010b. Cumulative and residual effects of swine slurry and
mineral nitrogen in irrigated maize. Agron. J. 102, 1682–1691.
Yagüe, M.R., Quílez, D., 2010c. Direct and residual response of wheat to swine slurry
application method. Nutr. Cycling Agroecosyst. 86, 161–174.
Yagüe, M.R., Iguácel, F., Orús, F., 2013a. Fertilización con purín: resultados
agronómicos en doble cultivo anual de cebada-maíz y efecto residual en cebada
(2006-2012). Informaciones técnicas Gobierno de Aragón 213.
Yagüe, M.R., Quílez, D., 2013b. Residual effects of fertilization with pig slurry: double
cropping and soil. Agron. J. 105, 70–78.
Yagüe, M.R., Quílez, D., 2015. Pig slurry residual effects on maize yields and nitrate
leaching: a study in lysimeters. Agron. J. 107, 278–286.
Zadoks, J.C., Chang, T.T., Konzak, C.F., 1974. A decimal code for the growth stages of
cereals. Weed Res. 14, 415–421.
Zebarth, B.J., Paul, J.V. Schmidt, O., McDougall, R., 1996. Influence of the time and rate
of liquid-manure application on yield and nitrogen utilization of silage corn in south
coastal British Columbia. Can. J. Soil Sci. 76, 153–164.

CAPÍTULO 2
EFFECTS OF PIG SLURRY FERTILIZATION ON FORAGE YIELD
AND QUALITY IN A DOUBLE CROPPING SYSTEM


53
CAPÍTULO 2
EFFECTS OF PIG SLURRY FERTILIZATION ON FORAGE YIELD
AND QUALITY IN A DOUBLE CROPPING SYSTEM
Keywords: Pig slurry, nitrogen, double cropping, forage, quality, crude protein.
Abbreviations:
DM: dry matter
PS: pig slurry
NVZs: nitrate vulnerable zones
CP: crude protein
DP: digestible protein
CF: crude fibre
ADF: acid detergent fibre
NDF: neutral detergent fibre
ADL: acid detergent lignin
NEL: net energy lactation
NUE: nitrogen use efficiency
RESUMEN
El purín de cerdo se aplica ampliamente como fertilizante en sistemas de cultivo forrajero
en zonas vulnerables a la contaminación por nitratos del NE de España. Se llevó a cabo
un ensayo de seis años con una rotación de doble cultivo anual de maíz y triticale en un
área mediterránea subhúmeda de secano. Se aplicaron cuatro dosis diferentes de N (0,
170, 250 y 330 kg N ha-1 año-1) para evaluar su efecto sobre el rendimiento de materia
seca, la calidad de los forrajes y la concentración de elementos minerales en los cultivos.
Para la fibra bruta, la fibra ácida detergente, la fibra neutra detergente, la lignina ácida
detergente y la energía neta de lactación, no hubo diferencias significativas entre los

Capítulo 2
54
tratamientos de fertilización. Sin embargo, el contenido en proteína bruta y proteína
digestible dependió de la dosis de fertilizante aplicado. El contenido total medio de
proteína bruta (maíz + triticale) con la dosis de 330 kg N ha-1 año-1 (139,9 g kg-1 de MS)
fue significativamente superior que cuando se aplicaron 250 y 170 kg N ha-1 año-1 (130,7
y 124,6 g kg-1 de materia seca, respectivamente). P, K, Ca y Mg no fueron afectados por
la dosis de fertilización aplicado ni en el maíz ni en el triticale. La eficiencia del uso del
nitrógeno (maíz + triticale) con las dosis de 330 y 250 kg N ha-1 año-1 fue de
aproximadamente un 43 y 25%, respectivamente, inferior a la obtenida cuando fueron
aplicados 170 kg N ha-1 año-1. Los resultados sugieren que, las dosis de fertilización
superiores a las legalmente permitidas por la Directiva de nitratos en zonas vulnerables a
la contaminación por nitratos, pueden resultar en mejores rendimientos y contenidos de
CP, sin embargo, con la aplicación de estas dosis altas de N, disminuyó la NUE en
sistemas de doble cultivo, en condiciones subhúmedas mediterráneas.
ABSTRACT
Pig slurry (PS) is widely applied as fertilizer in forage cropping systems in nitrate
vulnerable zones (NVZs) of the NE of Spain. A six-year trial was conducted in a maize-
triticale double cropping forage rotation in a rainfed sub-humid Mediterranean area. Four
different N rates, in the form of PS, were applied (0, 170, 250 and 330 kg N ha-1 year-1),
to evaluate their effect on DM yield, forage quality and mineral element concentrations
of the crops in the rotation. The corresponding PS rates were defined as zero (PS 0), low
(PSL) medium (PSM) and high (PSH). The average annual dry matter (DM) yields (maize
+ triticale) for the different annual PS fertilization treatments (PS0, PSL, PSM and PSH)
were statistically different respective values of 12.6, 17.7, 20.2 and 22.0 Mg DM ha-1. For
crude fibre (CF), acid detergent fibre (ADF), neutral detergent fibre (NDF), acid detergent
lignin (ADL) and net energy lactation (NEL), there were no significant differences among

Effects of pig slurry on forage yield and quality
55
PS treatments. However, crude protein (CP) and digestible protein (DP) concentration
depended on the PS rate applied. Total average CP content (maize + triticale) in the PSH
treatment (139.9 g kg-1 of DM) was significantly higher than in the other PSM and PSL
treatments (130.7, 124.6 and g kg-1 of DM, respectively). P, K, Ca y Mg plant
concentration were not affected by PS fertilization rate in both maize and triticale. Total
nitrogen use efficiency NUE (maize + triticale) in the PSH and PSM treatments were
approximately 43 and 25%, respectively lower than those to the PSL treatments. The
results suggest that the application of N, in the form of PS, at rates higher than the legally
permitted by the Nitrates Directive in NVZs, may result in better yields and CP contents,
however they decreased the NUE in double-cropping systems, practiced in rainfed sub-
humid Mediterranean conditions.
1. Introduction
Intensive pig farming has developed significantly in many areas of Europe in the
most recent decades. In particular, in Mediterranean areas this animal production has an
important economic impact. At the same time, the resulting pig slurry (PS) is a valuable
source of nitrogen (N) for crops (Daudén et al., 2004), and also P, K and micronutrients.
These nutrients can potentially be used as a source of fertilizer and might be important
by-products of livestock production when they are effectively managed and used for crop
production (Ul-Allah et al., 2014). If they are used appropriately, PS can fully or partially
replace significant amounts of mineral fertilizers depending on the crop, the soil type and
the climate (Berenguer et al., 2008; Jensen et al., 2000; Yagüe and Quílez, 2010). In many
European areas PS is a commonly used as fertilizers in the agricultural land being the
cheapest solution for their disposal. An effort to adequately manage PS must be done to
avoid environmental and health hazards (Hernández et al., 2013), which is one of the
main issues affecting N over fertilization in Europe. For this reason, in the European

Capítulo 2
56
Union (EU) farming practices are restricted by limiting to a maximum of 170 kg N ha-1
year-1 the application of N arising from livestock manures and slurries in nitrate
vulnerable zones (NVZs) (EEC, 1991).
A double-cropping forage system (summer crop - winter crop) is widely followed in
rainfed areas with an intensive agricultural management system. In NE Spain it is
normally associated with intensification of dairy farming systems where animals are fed
with the forages produced in the farm. In fact, in order to maximize the amount of feed
energy produced per unit area, and to reduce forage and manure transportation, farmers
tend to cultivate double-cropping for forages in the areas surrounding the dairy cattle
sheds (Tomasoni et al., 2011; Borrelli et al., 2014). This practice also has economic
advantages, because mineral N fertilizer alone is seldom applied due to the high amounts
of PS available in these regions.
Amount of N fertilizer application to maximize both yield and nutritive value of crop
silage are also not unequivocal in the literature. Cox and Cherney (2001) found that N
fertilizer consistently increases N content of maize forage but its effect on fiber were less
consistent. Significant effects of nitrogen fertilizer on forage qualities of oat (Iqbal et al.,
2013; Collins et al., 1990), sorghum (Restelatto et al., 2014), switchgrass (Lemus et al.,
2008) and forage corn (Keskin et al., 2005) have been reported. In Mediterranean areas,
several authors have analysed N fertilizer effects on production and forage quality mainly
in maize (Carpici et al., 2010), and rangeland (Balabanli et al., 2010), being the
information scarce in the literature in the case of double cropping systems (Tomasoni et
al., 2011).
However, inconsistent results have been reported on the effects of fertilization on
crude protein (CP), neutral detergent fibre (NDF) and acid detergent fibre (ADF)
concentrations. Min et al. (2002) reported that application at high rates of N increased CP

Effects of pig slurry on forage yield and quality
57
concentration compared with the control treatment, but ADF and NDF were not affected.
Others authors also reported that NDF concentration of grasses decreased when
increasing N fertilization rate (Johnson et al., 2001; Adeli et al., 2005). However,
Belanger and McQueen (1998) observed that an increase in NDF concentration with
increasing N fertilization. Other researchers reported that the increased of N fertilization
had almost no effect on NDF concentrations (Anderson et al., 1993; Rogers et al., 1996;
Cuomo and Anderson, 1996).
On the other hand, forage and animal scientists are also aware of the importance of
the mineral concentrations of forages, mainly of Ca, Mg and K (Kidambi et al. 1989).
Nevertheless, research is limited on how PS fertilization rate affects mineral element (Mut
et al., 2006; Kering et al., 2011; Albayrak and Turk, 2011).
The objective of this study was to evaluate and compare the effects of PS fertilizers
on the forage quality indicators and mineral element concentrations of a six-year double
cropping system under rainfed sub-humid conditions of the Mediterranean area.
2. Material and methods
2.1 Experimental site and crop management
A field plot trial was conducted in Torelló, Spain (42° 02' 01" N, 02° 15' 12" E;
altitude 485 m a.s.l.) over six seasons from 2006-2007 to 2011–2012. The double
cropping annual forage rotation was the common one used in the area with maize (Zea
mays L.) and triticale (Triticosecale Withmack) as crops.
The site is characterized by a sub-humid Mediterranean climate with an average
annual rainfall of 651 mm (1985-2006) and an average annual temperature of 13.1°C.
The climate is characterized by significant dry periods in winter and summer and two
main rainy periods, in spring and autumm. Crops are usually grown under rainfed

Capítulo 2
58
conditions. In this experiment, plots were not irrigated. An automated weather station
close to the experimental field (Meteorological Observatory of Torelló) registered daily
maximum and minimum temperatures, precipitation and air humidity. Monthly mean
temperatures and monthly precipitation during the experiment are shown in Fig. 1.
Fig. 1. Mean air temperature and total monthly precipitation, for the experimental period (2006–
2012). Historical periods (1985–2006) are shown as solid lines. (M: maize; T: triticale).
Total precipitation recorded during the trial period was highly variable between the
six experimental seasons taking into account the sum of rainfall of both summer (June-
October) and winter crops (November-May) with a maximum of 994 mm in 2011/12 and
a minimum of 555 mm in 2006/07. For the period 2006-12, the annual average
temperature was 13.2°C, with a maximum of 14.0 °C in 2006/07 and a minimum of 12.6
°C in 2009/10 (Fig.1). The soil is a well-drained loam, calcareous and moderately-alkaline
pH. The main soil properties of the field site are presented in Table 1.

Effects of pig slurry on forage yield and quality
59
Table 1. Selected soil properties for the different depths at the beginning of the experiment
(2006).
Depth
0-30 cm 30-60 cm 60-90 cm
pH 8.3 8.3 8.3
EC 1:5 (dS m-1) 0.22 0.15 0.17
Organic matter (%) 1.75 1.23 0.88
Nitric Nitrogen (mg NO3- -N kg -1) 6.46 4.76 7.70
N (%) 0.13 0.10 0.06
C:N ratio 7.45 6.70 5.70
P (mg kg -1) 34 22 11
K (mg kg -1) 197 79 62
Sand (%) 31.7 32.1 34.6
Silt (%) 47.2 44.9 44.9
Clay (%) 21.1 23 20.5
Maize and triticale rotation was managed according to the common farming practices
normal in the area. Summer cereal (maize) is normally seeded in June after the harvest of
the winter cereal (triticale, wheat or barley), which is usually seeded in October-
November after harvesting the maize (Table 2). Additional details of the cropping
practices are given in Ovejero et al. (2016) (Capítulo 1).
Table 2. Sowing and harvest dates for the study period (2006–2012).
Growing
season
Maize Triticale
Sowing Harvest Sowing Harvest
2006-2007 06/02/06 10/11/06 11/10/06 05/25/07
2007-2008 06/11/07 a 10/27/07 05/30/08
2008-2009 06/30/08 10/27/08 11/16/08 06/10/09
2009-2010 06/25/09 10/29/09 11/05/09 06/03/10
2010-2011 06/18/10 10/19/10 10/30/10 05/28/11
2011-2012 06/22/11 10/10/11 10/26/11 06/04/12
a Maize crop failed in this growing season due to shortage of rainfall during the
summer.

Capítulo 2
60
2.2 Experimental design
The experimental design was a randomized block with four PS treatments and three
replications. The plot surface was 480 m2, to allow common commercial farm machines
to be used. Before the experiment started, the field was conventionally fertilized with PS
for a period of more than 15 years. The fertilizer applications were randomized in the first
year and applied to the same plots thereafter. The four levels of N in the form of PS were:
zero (PS0), low (PSL): 170 kg N ha-1 year-1, medium (PSM): 250 kg N ha-1 year-1 and
high (PSH): 330 kg N ha-1 year-1. The PS was applied twice a year in the PSH and PSM
treatments and once a year in PSL, just before the sowing of the crops (Table 3). In control
plots (PS0), only 80 kg K2O ha-1 year-1 were applied entirely before sowing maize, in
order to avoid deficits in K. No fertilization with phosphorus was applied throughout the
experiment in the PS0 treatment, as the levels of this element in the soil were sufficient
for the correct development of both crops (Table 1).
The pig slurry was collected every year from a pig-fattening farm close to the
experimental site. The slurry in the storage pit was stirred the day of application and
pumped to a tanker equipped with a splash plate. The PS was applied by surface spreading
and incorporated several hours after, by a pass of a cultivator into the top 15 cm of soil.
During application, the tank of the spreader was calibrated to apply the target PS rates by
measuring the electrical conductivity and density of PS in order to adjust the speed of the
tractor.

Effects of pig slurry on forage yield and quality
61
Table 3. Description of the target fertilization treatments. PS fertilizers were applied at sowing in
winter and summer crops according to the double-annual cropping system (maize-triticale).
2.3 Slurry, soil and plant analysis.
A composite slurry sample was taken in the field from each tank before application,
and the samples were frozen and stored at -20°C until they were analysed in a reference
laboratory. The following analytical methods were used: pH by potentiometry (1:5;
slurry: distilled water), electrical conductimetry at 25°C, gravimetric dry matter content
at 105 ºC, organic matter by calcination at 550°C, organic nitrogen by the Kjeldahl
method, and ammonium nitrogen by distillation and titration according to methods 4500-
NH3 B-C from APHA (2012). Total phosphorus and potassium were analysed by acid
digestion (wet) and further determined using inductively coupled plasma atomic emission
spectrometry (USEPA, 1992). The real amount of N applied and taken into account for
calculations in this paper, was established according to the physiochemical characteristics
of the PS (Table 4).
Treatment Description Maize at sowing
(kg N ha-1)
Triticale at sowing
(kg N ha-1)
Total PS
(kg N ha-1)
PS0 Control 0 0 0
PSL Pig slurry low rate 170 0 170
PSM Pig slurry medium rate 170 80 250
PSH Pig slurry high rate 250 80 330

Capítulo 2
62
Table 4. Average physicochemical characteristics of pig slurry applied from 2006 to 2012 in the
experimental field.
Parameter Average from
2006 to 2012
pH 8,4 ± 0,2
Electrical conductivity (dSm−1) 21,6 ± 3,5
Dry matter (kg DM Mg-1) 69 ± 20
Organic matter (kg OM Mg-1) 50,9 ± 16,4
Ammonium-N (kg N m-3) 3,4 ± 0,8
Organic N (kg N m-3) 1,7 ± 1,0
Total N (kg N m-3) 5,1 ± 1,4
P (kg m-3) 1,5 ± 0,5
K(kg m-3) 2,8 ± 0,8
Soil NO3--N content was determined in each growing season just before PS
fertilization at sowing of each crop (October and June). For each plot, a mixture of two
soil cores at 0.30-m intervals to a depth of 0.90m were mixed to obtain a composite soil
sample. Three composite samples were thus analysed per plot for each sampling time.
Soil nitrate were analysed in a certified laboratory by colorimetric method (Kempers,
1974).
Total fresh crops yield was obtained directly in the field by harvesting a central row
of the maize and triticale (32m x 4, 2m and 30, 4m x 2, 25 m, respectively) of each plot
with a commercial reaping-chopping machine. For the dry matter (DM) determination, a
crop subsample per plot was collected and stored at 4◦C for a maximum of 48 h before
analysing DM contents, forage quality parameters and mineral element concentrations.
The DM was determined by drying the wet forage at 60◦C for 48 hours. N, digestible
protein (DP), crude fibre (CF), acid detergent fibre (ADF), neutral detergent fibre (NDF),
acid detergent lignin (ADL) and net energy lactation (NEL) contents were determined
with near infrared reflectance spectroscopy (NIRS), previously calibrated. P, Ca, Mg and
K contents of samples were determined using inductively coupled plasma atomic

Effects of pig slurry on forage yield and quality
63
emission spectroscopy (ICP-AES) (USEPA, 1992). Crude protein (CP) content was
calculated by multiplying total N by 6.25 constant (AOAC, 1980). In the 2006 maize
growing season, only was measured the N content and consequently the CP content.
However, in 2007 maize growing seasons, none of the parameters indicated previously
were measured because of the maize failed to grow. The nitrogen use efficiency (NUE:
Kg kg-1) was calculated, for each crop, as kg DM per kg of N applied (Islam and García,
2012).
2.4 Statistical analysis
Statistical analyses of the data were performed using the IBM SPSS statistical
software for Windows, version 23.0 (IBM Corp., Armonk, NY, USA). A mixed-design
analysis of variance model (ANOVA), taking into account the growing seasons as
repeated measures, was carried out to evaluate the response of the variables measured to
PS fertilization. In the mixed-design ANOVA model, the PS treatment was a between-
subjects variable (a fixed effects factor) and the growing season was a within-subjects
variable (a random effects factor). DM yield analysis was done separately for each crop
and year (one-way ANOVA) in order to detect differences associated with fertilization
treatment. If Anova test resulted in statistically significant differences, Duncan`s test was
performed in pairwise comparisons. A confidence level of 95% was selected for all
statistical comparisons. CP data for maize and triticale were plotted against initial soil
NO3--N content + N applied. Linear, quadratic, power, and logarithmic equations were
tested for their suitability to describe the relationship between CP response and initial soil
NO3--N content + N applied. The equation with the highest coefficient of determination
(r2) value was judged the most appropriate. In these regression equations, CP was the
dependent variable (y) and the initial soil NO3--N content + N applied the independent

Capítulo 2
64
variable (x). The relationship between variables was established with a regression
analysis (p < 0.05).
3. Results
3.1 DM yield
Total average DM yield (maize + triticale) was affected by PS fertilizer rate, growing
season and its interaction (Table 5). In this rainfed system, the yield response to PS
treatments varied between years due to the climatic factors, mainly rainfall and its
distribution (Fig.1). The overall mean DM yields differed significantly across cropping
systems.
Average maize DM yield varied greatly with the growing season, ranging from 4.6
to 14.2 Mg ha-1 in the 2006/07 and the 2011/12 growing seasons, respectively (Table 6).
No maize was harvested in 2007 because it failed to grow due to a shortage of rainfall
during that summer.
Triticale DM yields were affected significantly by the PS fertilization rate and the
growing season and its interaction (Table 5). Average triticale DM yield for the six-year
trial in the PSH and PSM treatments was 13.3 and 12.3 Mg ha-1, respectively, whereas in
maize these PS treatments yielded 10.5 and 9.4 Mg ha-1, respectively. However, when no
PS was applied, as it happened in PS0, the average DM yield in maize (8.1 Mg ha-1) was
32% higher than in triticale (6.1 Mg ha-1) (Table 6). In the 2007/08 triticale growing
season the only significant differences were observed between control plots (PS0) and the
remaining treatments. In addition, in the 2011/12 growing season the only significant
differences were found between PS0 and the PSL and PSM treatments. In contrast, in the
2006/07 growing season, triticale DM yield did not respond to applied PS (Table 6).

Effects of pig slurry on forage yield and quality
65
Six-year average total annual DM yields (maize + triticale) for the different PS
fertilization rates were statistically different among the PS0, PSL, PSM and PSH
treatments (Table 5). In 2007/08 maize crop failed and the total yield in this growing
season only corresponds to triticale (Table 6). In the 2007/08 and 2011/12 growing
seasons, the only significant differences were observed between control plots (PS0) and
the remaining treatments. In contrast, in 2006/07, which it was the driest growing season,
total DM yield did not respond to applied PS (Table 6).
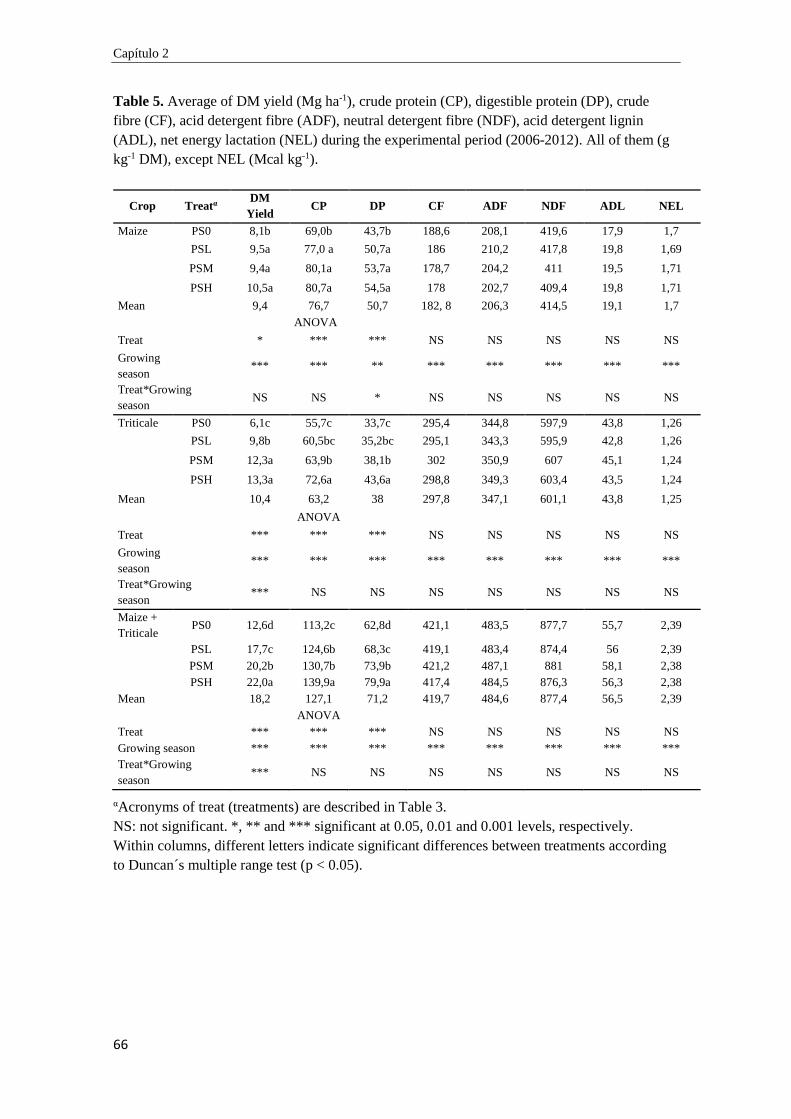
Capítulo 2
66
Table 5. Average of DM yield (Mg ha-1), crude protein (CP), digestible protein (DP), crude
fibre (CF), acid detergent fibre (ADF), neutral detergent fibre (NDF), acid detergent lignin
(ADL), net energy lactation (NEL) during the experimental period (2006-2012). All of them (g
kg-1 DM), except NEL (Mcal kg-1).
Crop Treatα DM
Yield CP DP CF ADF NDF ADL NEL
Maize PS0 8,1b 69,0b 43,7b 188,6 208,1 419,6 17,9 1,7
PSL 9,5a 77,0 a 50,7a 186 210,2 417,8 19,8 1,69
PSM 9,4a 80,1a 53,7a 178,7 204,2 411 19,5 1,71
PSH 10,5a 80,7a 54,5a 178 202,7 409,4 19,8 1,71
Mean 9,4 76,7 50,7 182, 8 206,3 414,5 19,1 1,7 ANOVA
Treat * *** *** NS NS NS NS NS
Growing
season *** *** ** *** *** *** *** ***
Treat*Growing
season NS NS * NS NS NS NS NS
Triticale PS0 6,1c 55,7c 33,7c 295,4 344,8 597,9 43,8 1,26
PSL 9,8b 60,5bc 35,2bc 295,1 343,3 595,9 42,8 1,26
PSM 12,3a 63,9b 38,1b 302 350,9 607 45,1 1,24
PSH 13,3a 72,6a 43,6a 298,8 349,3 603,4 43,5 1,24
Mean 10,4 63,2 38 297,8 347,1 601,1 43,8 1,25
ANOVA
Treat *** *** *** NS NS NS NS NS
Growing
season *** *** *** *** *** *** *** ***
Treat*Growing
season *** NS NS NS NS NS NS NS
Maize +
Triticale PS0 12,6d 113,2c 62,8d 421,1 483,5 877,7 55,7 2,39
PSL 17,7c 124,6b 68,3c 419,1 483,4 874,4 56 2,39 PSM 20,2b 130,7b 73,9b 421,2 487,1 881 58,1 2,38 PSH 22,0a 139,9a 79,9a 417,4 484,5 876,3 56,3 2,38
Mean 18,2 127,1 71,2 419,7 484,6 877,4 56,5 2,39 ANOVA
Treat *** *** *** NS NS NS NS NS
Growing season *** *** *** *** *** *** *** ***
Treat*Growing
season *** NS NS NS NS NS NS NS
αAcronyms of treat (treatments) are described in Table 3.
NS: not significant. *, ** and *** significant at 0.05, 0.01 and 0.001 levels, respectively.
Within columns, different letters indicate significant differences between treatments according
to Duncan´s multiple range test (p < 0.05).

Effects of pig slurry on forage yield and quality
67
Table 6 . Yield during the experiment and the average values from 2006 to 2012.
αAcronyms of treatments are described in Table 3.
NS: not significant. *, ** and *** significant at 0.05, 0.01 and 0.001 levels, respectively. a Maize crop failed in this growing season due to shortage of rainfall during the summer.
Within columns, different letters indicate significant differences between treatments according to
Duncan´s multiple range test (p < 0.05).
3.2 Forage quality parameters
Table 5 summarizes the effect of the different PS treatments on the forage quality
parameters evaluated tested in the field trials. For most of the parameters, there were no
significant differences (p < 0.05) due to the application of the among the PS fertilization
treatments. Moreover, no clear trend was observed in most of the forage quality over six-
year study according to the PS treatment applied, the exceptions being the crude protein
(CP) and digestible protein (DP) content for both maize and triticale.
Crop Treatmentα Yield (Mg DM ha -1)
2006 2007a 2008 2009 2010 2011
Maize PS0 5.1 - 8.4b 6.2 7.0c 13.7 PSL 4.3 - 10.1ab 8.1 10.9b 14.1
PSM 4.5 - 10.8a 7.6 10.2b 14.0
PSH 4.8 - 11.8a 8.4 12.5a 14.8
Mean 4.6 - 10.3 7.6 10.1 14.2
Significance NS - * NS ** NS
Treat
2006/07 2007/08 2008/09 2009/10 2010/11 2011/12
Triticale PS0 8.1 6.7c 7.9c 4.8c 4.7c 4.5b PSL 10.4 9.8b 11.7b 9.1b 10.0b 8.0ab
PSM 9.8 10.7b 14.0a 13.1a 15.2a 11.0a
PSH 11.2 11.5a 16.1a 13.7a 16.4a 11.0a
Mean 9.9 9.7 12.4 10.2 11.5 8.6
Significance NS *** *** *** *** *
Treat
2006/07 2007/08 2008/09 2009/10 2010/11 2011/12
Maize PS0 11.7 6.7b 16.3d 10.9c 11.7d 18.2b
+ PSL 14.7 9.8a 21.8c 17.2b 20.8c 22.1a
Triticale PSM 14.3 10.7a 24.9b 20.7a 25.3b 25.0a PSH 16.0 11.5a 27.9a 22.1a 28.9a 25.8a
Mean 14.2 9.7 22.7 17.7 21.7 22.8
Significance NS *** *** *** *** **
Treat

Capítulo 2
68
Total average CP and DP concentration (maize + triticale) were influenced by the PS
fertilization rate and the growing season. However, no interaction was detected between
these two variables neither in CP nor in DP. Total average CP content in the PSH
treatment was significantly higher than in the other PSM, PSL and PS0 treatments.
Average DP contents (maize + triticale) throughout the experiment for the different PS
fertilization rates were statistically different among the PS0, PSL, PSM and PSH
treatments (Table 5).
CP and DP contents were affected by the PS fertilizer rate and the growing season
either in maize or triticale. The forage CP contents of the treatments varied greatly,
increasing significantly when PS was applied. Average maize CP and DP content
throughout the trial was higher than in triticale (Table 5). Regarding maize CP content,
only were found significant differences between PS0 and the other PS treatments (Table
5), similar maize CP content was observed among the PSH, PSM and PSL treatments. In
triticale, when taking into account the six-year average, CP content and DP in PSH were
significantly higher than the remaining treatments (Table 5).
3.3 Mineral element concentrations
The average (six year) content of the mineral element are presented in Table 7. There
were no significant differences between PS treatments in the content of the
macronutrients either in maize or in triticale.
In general, the macronutrients content by the maize was slightly higher than in
triticale crop (Table 7). Only in K concentration content by triticale there was an
interesting trend during the study. Average K content in triticale in the PSH and PSM
treatments was about 22% higher than in the PSL and PS0 treatments (Table 7).

Effects of pig slurry on forage yield and quality
69
Table 7. Analysis of variance and average of mineral element concentrations (% on DM) during
the experimental period.
αAcronyms of treatments are described in Table 3.
NS: not significant. *, *** significant at 0.05, and 0.001 levels, respectively.
Crop Treatmentα P
(%)
K
(%)
Ca
(%)
Mg
(%)
Maize PS0 0,21 1,00 0,31 0,16 PSL 0,19 0,91 0,3 0,16
PSM 0,21 0,98 0,32 0,17
PSH 0,21 1,02 0,31 0,16
ANOVA
Block NS NS NS NS
Treat NS NS NS NS
Growing season *** *** *** ***
Treat*Growing season NS NS * *
Triticale PS0 0,17 0,75 0,26 0,07 PSL 0,15 0,78 0,28 0,07
PSM 0,16 0,93 0,27 0,08
PSH 0,17 0,94 0,28 0,08
ANOVA
Block NS NS NS NS
Treat NS NS NS NS
Growing season *** *** *** ***
Treat*Growing season NS NS * *

Capítulo 2
70
3.4 Soil NO3--N content
The evolution of soil NO3--N content during the experiment is presented in Table 8.
A great variation in soil NO3--N content was observed throughout the growing seasons
according to the amount of PS applied to the previous crop. The highest levels of soil
NO3--N content were observed in October 2007 after maize, as N uptake during the
growing season was negligible in that year due to the failure of maize. The soil NO3--N
levels were considerably higher after maize (October) than after triticale (June) in each
growing season for the different PS rates. After 2009, a general decline in soil NO3--N
content was observed each year, which was more notable in June than in October (Table
8).
Relationships between the sum of initial soil NO3--N content + N applied by PS
fertilization (sometimes called available N) and the CP during the six-year study for each
crop are presented in Fig. 2. Regression analysis showed significant relationship between
CP and soil NO3--N content + N applied in each crop being less marked in maize than in
triticale.

Effects of pig slurry on forage yield and quality
71
Table 8. Evolution of soil NO3- content (kg NO3
--N ha-1) during the experiment and the average values from 2006 to 2012, after triticale harvest (June)
and after maize harvest (October). Depth 0-90 cm.
Treatmentα 2006 2007 2008 2009 2010
2011 2012
Junea Oct June Oct June Oct June Oct June Oct June Oct June
PS0 85 84
50 146
48 93
14 25
22 20
10 22
22
PSL 85 123
57 323
68 178
21 99
25 70
10 40
32
PSM 85 131
93 332
80 154
31 166
36 89
19 77
42
PSH 85 162
160 637
243 217
38 151
27 122
18 116
46
Means 85 125 90 359 110 161 26 110 27 75 14 64 35
αAcronyms of treatments are described in Table 3. a Same initial level in each treatment corresponds to initial soil analysis.

Capítulo 2
72
Fig. 2. Relationships between CP and initial soil NO3−-N + N applied by PS fertilization for each
crop in the six-year study. *** Significant at 0.001 levels.
3.5 Nitrogen use efficiency
Across the experiment and according to the sum of both maize and triticale forage
yields, differences were found in NUE due to the PS fertilization rate and the growing
season and its interaction (Table 9). When increasing the N rates, in the form of PS, from
PSL to PSM to maize+ triticale, NUE decreased significantly from 109.4 to 82.2 kg per
kg of N applied, respectively. Similarly, total average NUE for the PSM treatment were
approximately 32% higher than in the PSH treatment (62.2 kg kg-1) (Table 9).
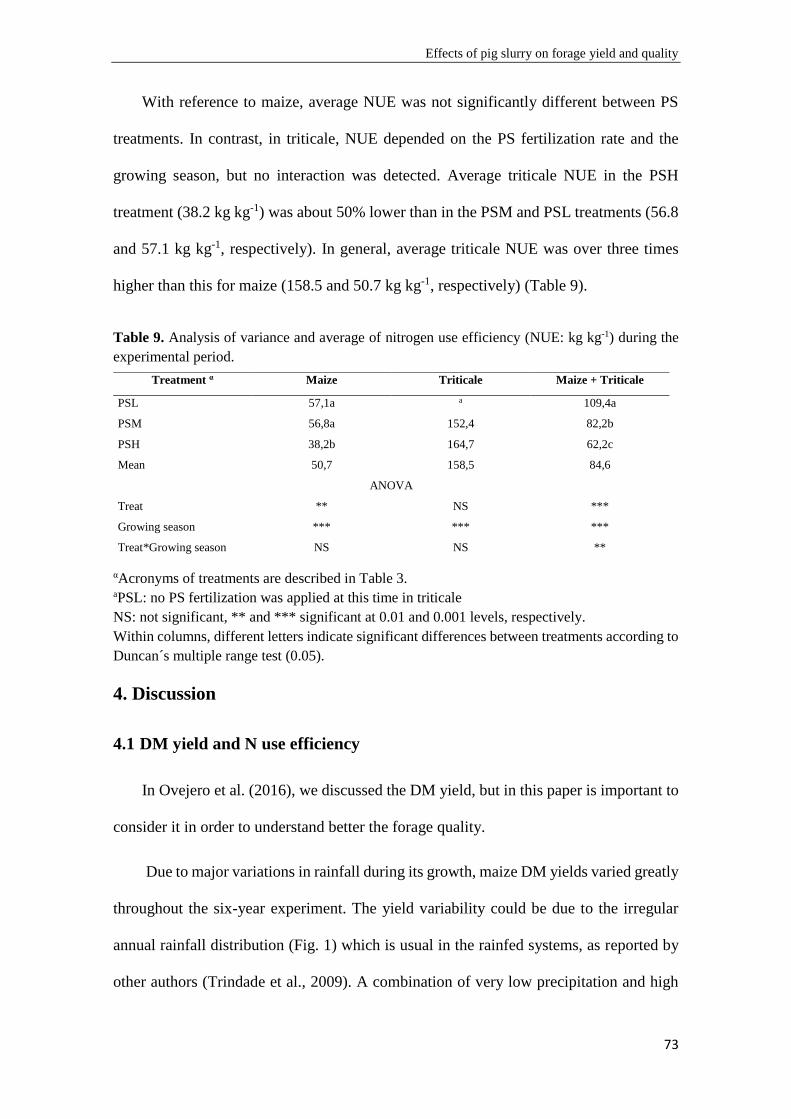
Effects of pig slurry on forage yield and quality
73
With reference to maize, average NUE was not significantly different between PS
treatments. In contrast, in triticale, NUE depended on the PS fertilization rate and the
growing season, but no interaction was detected. Average triticale NUE in the PSH
treatment (38.2 kg kg-1) was about 50% lower than in the PSM and PSL treatments (56.8
and 57.1 kg kg-1, respectively). In general, average triticale NUE was over three times
higher than this for maize (158.5 and 50.7 kg kg-1, respectively) (Table 9).
Table 9. Analysis of variance and average of nitrogen use efficiency (NUE: kg kg-1) during the
experimental period.
αAcronyms of treatments are described in Table 3. aPSL: no PS fertilization was applied at this time in triticale
NS: not significant, ** and *** significant at 0.01 and 0.001 levels, respectively.
Within columns, different letters indicate significant differences between treatments according to
Duncan´s multiple range test (0.05).
4. Discussion
4.1 DM yield and N use efficiency
In Ovejero et al. (2016), we discussed the DM yield, but in this paper is important to
consider it in order to understand better the forage quality.
Due to major variations in rainfall during its growth, maize DM yields varied greatly
throughout the six-year experiment. The yield variability could be due to the irregular
annual rainfall distribution (Fig. 1) which is usual in the rainfed systems, as reported by
other authors (Trindade et al., 2009). A combination of very low precipitation and high
Treatment α Maize Triticale Maize + Triticale
PSL 57,1a a 109,4a
PSM 56,8a 152,4 82,2b
PSH 38,2b 164,7 62,2c
Mean 50,7 158,5 84,6
ANOVA
Treat ** NS ***
Growing season *** *** ***
Treat*Growing season NS NS **

Capítulo 2
74
temperatures in some years during June and July, can lead to a decrease in maize DM
yield. In maize, it is known that drought during the reproductive stage affects grain
production (Di Paolo and Rinaldi, 2008). In 2007, the low precipitation during the
growing season (June- October: 237.5 mm) was insufficient for crop growth (Fig.1). This
fact, suggests that other more drought -tolerant crops such as forage sorghum should be
further considered in the crop rotation.
In general, our maize DM yields, in double cropping can be considered very low
compared to those of other areas under irrigation, such as the Po Valley in Northern Italy
(Grignani et al., 2007; Borrelli et al., 2014) or other rainfed areas (Lloveras, 1987;
Trindade et al., 2009; Perramon et al., 2016). The six-year average DM in triticale was
higher than in maize. The highest triticale DM yields obtained in the PSH treatments (13.3
Mg ha−1), were close to maximum values found in other areas under similar
environmental conditions of 16.3 in Delogu et al. (2002), 14.78 in Mut et al. (2006) and
16.3 Mg ha−1 in Bilgili et al. (2009). Our triticale DM yields were even higher than the
productions obtained in other similar systems of 10.7 in Lithourgidis et al. (2006) and
12.5 Mg ha−1 in Budakli et al. (2014), respectively. Increase in DM yields due to N
fertilization is well documented by many authors (Power, 1986; Hall et al., 2003;
Scarbrough et al., 2004).
Taking into account the average the six-year trial, when applying 330 kg N ha-1
year-1 the largest total DM yields (maize + triticale) were achieved. These results are in
agreement with Trindade et al. (2009) who reported that in some double cropping
systems, located in NVZs, may result efficient the utilization of greater amounts of slurry-
N. Similarly, Perramon et al. (2016) concluded that manure rate with 250 kg N ha-1 year-
1 should be considered in the framework of the legislation concerning fertilization in
NVZs to be applied in high N-demanding double- cropping systems.

Effects of pig slurry on forage yield and quality
75
Nitrogen-use efficiency (NUE) considerations are also important owing to the high
amounts of N required by forage crops to achieve its potential high biomass yield. Double
annual cropping systems compared with a monoculture allow better N use efficiency
(Zavattaro et al., 2012) and yield increments, as described for maize by Borrelli et al.
(2014). In triticale, NUE, was considerably great compared to maize. This high N
efficiency in triticale, could be due to use of residual soil NO3--N from the preceding crop,
which includes organic matter mineralization from the PS applied to it (Yagüe and Quílez,
2013). Improved prediction of the rate of mineralization is required in order that this N
can be used effectively (Trindade et al., 2001). Therefore, recommendations for
fertilisation should not be based on fixed rates of N applications in the form of PS. Testing
initial soil NO3--N previous PS fertilization could help to produce more accurate N
fertiliser recommendations. According to our results, fertilization rates above the legally
permitted by the Nitrates Directive 91/676 (EEC, 1991) in NVZs decreased the NUE.
Total NUE (maize + triticale) in the PSH and PSM treatments were approximately 43 and
25%, respectively lower than those to the PSL treatments. Further experiments are needed
for improving the N-efficiency, including band spreaders to the detriment of the broadcast
spreaders for slurry application in order to decrease ammonia volatilization.
4.2 Forage quality parameters
Precipitation was highly variable between growing season for the two crops (Fig.1).
Despite variability in weather, PS fertilization consistently had a positive impact on CP
content. CP content of forage is one of the most important criteria for DM forage quality
evaluation (Caballero et al., 1995; Assefa and Ledin, 2001). An increase in CP content
due to N fertilization has also been reported in numerous studies (Rubio et al., 1996;
Gillen and Berg, 1998; Guevara et al., 1997; Marsalis et al., 2010; Rostamza et al., 2011;
Restelatto et al., 2014). The highest average CP contents in maize were obtained when

Capítulo 2
76
PSH and PSM were applied. In addition, the CP content in PSH and PSM, respectively
were about 4% higher than in PSL, being this small difference significant.
The triticale CP content in PSH throughout the six-year trial was approximately 13
and 20 % higher than in PSM and PSL, respectively. The CP contents of triticale used in
the present study were similar to those reported by several researchers in Mediterranean-
type climates (Buyukburc and Karadag, 2002; Lithourgidis et al., 2006; Bilgili et al.,
2009). Delogu et al. (2002) reported higher CP contents (108 g kg-1 of DM) in the mean
of nine triticale varieties in the Po Valley (Northern Italy).
PSL represented the amount of N provided by organic materials that the EU Nitrates
Directive allows to be applied in nitrate vulnerable zones (170 kg N ha-1 year-1) (EEC,
1991). The highest total CP contents (maize + triticale) could not be achieved whether
only 170 kg N ha-1 year-1 are applied taking it into account this normative. This limit
seems reasonable if only one crop is cultivated annually, but in double cropping, there is
a considerable increase in N demand, and this limit may prevent appropriate nutrient
supply (Perramon et al., 2016). Indeed, the EU has allowed derogations of the Directive
concerning this specific aspect (Van der Straeten et al., 2012), and in some regions or
countries it allows the application of higher N amounts of organic origin, up to a
maximum of 250 kg N ha-1 year-1 (EEC 2005, 2006, 2007a,b, 2008, 2011). On the other
hand, maize and triticale CP content were both clearly influenced by initial soil NO3--N
and PS fertilization rates (Fig. 2). This suggests that PS fertilization should be based on
initial soil NO3--N levels and could be considered a good tool for improving N
fertilization recommendations.
Possible modifications of the present cropping system that should be studied in order
to improve the CP content include: (i) use of other maize and triticale varieties; (ii) timing
of slurry application, avoiding the spreading of slurry at the sowing of the winter crop

Effects of pig slurry on forage yield and quality
77
and delaying the application to this crop till late winter; and (iii) changes of the rate of PS
taking into account the crop N requirements.
Other important quality characteristics for forages are the concentrations of fibres
(NDF and ADF) (Haferkamp et al., 1987; Karn et al., 2006). Contrarily to CP, these
parameters are expected to be present in low levels to a better forage quality. In present
study, NDF was not affected by PS rates either maize or triticale. Others authors also
reported that increased N fertilization had almost no effect on NDF concentrations
(Anderson et al., 1993; Rogers et al., 1996; Cuomo and Anderson, 1996; Min et al., 2002).
In contrast to these results, Johnson et al. (2001) and Adeli et al. (2005) reported that NDF
concentration decreased with increasing N fertilization rate. On the other hand, Belanger
and McQueen (1998) observed that, an increase in NDF concentration with increasing N
fertilization.
In the case of ADF, similar to maize, analysis of variance revealed no effect of PS
fertilization on the concentration of this component. This lack of significant differences
agrees with other studies (Castro et al., 2000; Cazzato et al., 2013). However, other
studies contradict these results and the ADL was influenced significantly by N
fertilization, being the highest ADL values obtained from plots without N (Balabanli et
al., 2010; Albayrak and Turk, 2011).
4.3 Mineral element concentrations
In our six-year trial N supply by slurry did not affect mineral element concentrations
in both maize and triticale. However, Albairak and Turk (2011) reported that nitrogen
treatments significantly increased P and K concentration while they decreased Ca and Mg
content. In this way, Kering et al. (2011) found that, except for forage K concentration,

Capítulo 2
78
N application significantly increased forage P, Mg, and Ca concentrations in
bermudagrass in the southern of United States.
5. Conclusions
In our six-year study of a triticale-maize double-annual cropping system, the best
overall (maize + triticale), N rate in the form of PS, necessary to achieve the highest DM
yields, was when applying 330 kg N ha-1 year-1. The most of the forage quality parameters
analysed was not affected by PS fertilization rates. However, CP and DP concentration
depended on the PS fertilizer rate, increasing significantly when 330 kg N ha-1 year-1 were
applied. Both the CP contents and NUE were influenced by initial soil NO3--N content.
This suggests that PS fertilization should not be based on fixed rates of N applications in
the form of PS. Initial soil NO3--N analysis previous PS fertilization could help to adjust
N fertiliser recommendations. After six consecutive years of biannual applications of PS,
mineral element concentrations were not influenced by N supply in both maize and
triticale and no were found significant differences between PS treatments. In our cropping
conditions, the application of N, in the form of PS, at rates higher than the legally
permitted by the Nitrates Directive 91/676 (EEC, 1991) in NVZs, decreased the N use
efficiency. Taking into account these results, further works are needed to improve N
efficiency establishing N management strategies that take into consideration improved
fertilizer along with soil and crop management practices.
6. References
Adeli, A., Varco, J.J., Sistani, K.R., Rowe, D.E., 2005. Effects of swine lagoon effluent
relative to commercial fertilizer applications on warm-season forage nutritive value.
Agron. J. 97, 408-417.

Effects of pig slurry on forage yield and quality
79
Albayrak, S., Turk, M., 2011. Effects of fertilization on forage yield and quality of
crested wheatgrass (Agropyron cristatum L. Gaertn.). Bulg. J. Agric. Sci. 17, 642-
648.
Anderson, M.A., McKenna, J.R., Martens, D.C., Donohue, S.J., 1993. Nitrogen recovery
by timothy from surface application on dairy slurry. Commun. Soil Sci. Plant Anal.
24, 1139-1151.
APHA, 2012. Nitrogen (ammonia): 4500-NH3 B, preliminary distillation step and 4500-
NH3 C, titrimetric method. In: Rice, E.W., Bridgewater, L. (Eds.), Standard Methods
for the Examination of Water and Wastewater, second ed. American Public Health
Association, American Water Works Association, Water Environment Federation,
Washington, D.C, pp. 110-111.
AOAC (Association of Official Analytical Chemists), 1980. Official Methods of
Analysis, 11th ed. AOAC, Washington, DC, p. 125.
Assefa, G., Ledin, I., 2001. Effect of variety, soil type and fertilizer on the establishment,
growth, forage yield, quality and voluntary intake by cattle of oats and vetches
cultivated in pure stands and mixtures. Anim. Feed Sci. Technol. 92, 95-111.
Balabanli, C., Albayark, S., Yuksel, O., 2010. Effects of nitrogen, phosphorus and
potassium fertilization on the quality and yield of native rangeland. Turk. J. of Field
Crops 15, 164-168.
Belanger, G., McQueen, R.E., 1998. Analysis of the nutritive value of timothy grown
with varying N nutrition. Grass Forage Sci. 53, 109-119.
Berenguer, P., Santiveri, F., Boixadera, J., Lloveras, J., 2008. Fertilisation of irrigated
maize with pig slurry combined with mineral nitrogen. Eur. J. Agron. 28, 635–645.
Bilgili, U., Cifci, E.A., Hanoglu, H., Yagdi, K., Açıkgöz, E. 2009. Yield and quality of
triticale forage. J. Food Agric. Environ. 7, 556-560.

Capítulo 2
80
Borrelli, L., Castelli, F., Ceotto, E., Cabassi, G., Tomasoni, C., 2014. Maize grain and
silage yield and yield stability in a long-term cropping system experiment in
Northern Italy. Eur. J. Agron. 55, 12-19.
Budakli Carpici, E., Celik, N., 2014. Forage yield and quality of common vetch mixtures
with triticale and annual ryegrass. Turk J. Field Crops 19(1), 66-69.
Buyukburc, U., Karadag, Y., 2002. The amount of NO3-N transferred to soil by legumes,
forage and seed yield, and the forage quality of annual legume + triticale mixtures.
Turk. J. Agric. For. 26, 281-288.
Caballero, R., Goicoechea, E.L., Hernaiz, P.J., 1995. Forage yields and quality of
common vetch and oat sown at varying seeding ratios and seeding rates of common
vetch. Field Crops Res. 41, 135-140.
Carpici, E.B., Celik, N., Bayram, G., 2010. Yield and quality of forage maize as influ-
enced by plant density and nitrogen rate. Turk. J. Field Crop 15, 128-132.
Castro, M.P., Pineiro, J., Sau, F., 2000. Effect of seeding rates of oats, wheat and common
vetch on the yield, botanic composition and nutritive value of the mixture. In:
Legumes for Mediterranean forage crops, pastures and alternative uses (Ed. Sulas
L). CIHEAM-IAMZ, Zaragoza, pp. 207-211.
Cazzato E., Tufarelli V., Laudadio V., Stellacci A. M., Selvaggi M., Leoni B., Troccoli
C., 2013. Forage yield and quality of emmer (Triticum dicoccum Schübler) and spelt
(Triticum spelta L.) as affected by harvest period and nitrogen fertilization. Acta
Agriculturae Scandinavica, Section B: Soil Plant Sci. 63 (7), 571-578
Collins, M., Brinkman, M., Salman, A., 1990. Forage yield and quality of oat cultivars
with increasing rates of nitrogen fertilization. Agron. J. 82, 724–728.
Cox, W.J., Cherney, D.J.R., 2001. Row Spacing, Plant Density and Nitrogen Effects on
Corn Silage. Agron. J. 93, 597-602.

Effects of pig slurry on forage yield and quality
81
Cuomo, G.J., Anderson, B.E., 1996. Nitrogen fertilization and burning effects on rumen
protein degradation and nutritive value of native grasses. Agron. J. 88, 439-442.
Daudén, A., Quilez, D., Martinez, C., 2004. Residual effects of pig slurry on yield and N
uptake of a subsequent wheat crop. Soil Use Manage. 20, 156-162.
Delogu, G., Faccini, N., Faccioli, P., Reggiani, F., Lendini, M., Berardo, N., Odoardi, M.,
2002. Dry matter yield and quality evaluation at two phenological stages of forage
triticale grown in the Po Valley and Sardinia Italy. Field Crops Res. 74, 207-215.
Di Paolo, E., Rinaldi, M., 2008. Yield response of corn to irrigation and nitrogen
fertilization in a Mediterranean environment. Field Crops Res. 105, 202-210.
EEC, 1991. Council Directive of 12 December 1991 concerning the protection of
waters against pollution caused by nitrates from agricultural sources. Off. J. Eur.
Commun., 91/676/EEC.
EEC, 2005. Commission Decision 2005/880/EC, of 8 December 2005, granting a
derogation requested by the Netherlands pursuant to CouncilDirective 91 /676/EEC
concerning the protection of waters against pollutioncaused by nitrates from
agricultural sources, Off. J. Eur. Communities, L324.
EEC, 2006. Commission Decision 2006/1013/EC, of 22 December 2006, granting a
derogation requested by Germany pursuant to Council Directive 91/676/EEC
concerning the protection of waters against pollution caused by nitrates from
agricultural sources, Off. J. Eur. Communities, L382.
EEC, 2007a. Commission Decision 2007/697/EC, of 22 October 2007, granting a
derogation requested by Ireland pursuant to Council Directive 91/676/EEC
concerning the protection of waters against pollution caused by nitrates from
agricultural sources, Off. J. Eur. Communities, L284.

Capítulo 2
82
EEC, 2007b. Commission Decision 2007/863/EC, of 14 December 2007, granting
aderogation requested by the United Kingdom with regard to Northern Ireland
pursuant to Council Directive 91 /676/EEC concerning the protection of
watersagainst pollution caused by nitrates from agricultural sources, Off. J.
Eur.Communities, L337.
EEC, 2008. Commission Decision 2008/64/EC, of 21 December 2007, granting a
derogation requested by Belgium with regard to the region of Flanders pursuant to
Council Directive 91 /676/EEC concerning the protection of waters against pollution
caused by nitrates from agricultural sources, Off. J.Eur. Communities, L16.
EEC, 2011. Commission Implementing Decision 2011/721/EU, of 3 November 2011,
granting a derogation requested by Italy with regard to the Regions of Emilia
Romagna, Lombardia, Piemonte and Veneto pursuant to Council Directive 91
/676/EEC concerning the protection of waters against pollution caused by nitrates
from agricultural sources, Off. J. Eur. Communities, L287.
Gillen, R.L., Berg, W.A., 1998. Nitrogen fertilization of a native grass planting in
Western Oklahoma. J. Range Manage. 51, 436-441.
Grignani, C., Zavattaro, L., Sacco, D., Monaco, S., 2007. Production, nitrogen and carbon
balance of maize-based forage systems. Eur. J. Agron. 26, 442-453.
Guevara, J.C., Cavagnaro, J.B., Estevez, O.R., Le Houérou, H.N., Stasi, C.R., 1997.
Productivity, management and development problems in the arid rangelands of the
central Mendoza plains (Argentina). J. Arid Environ. 35, 575-600.
Haferkamp, M. R., Miller, F.R., Sneva, F.A., 1987. Mefluidide effects on forage quality
of crested wheatgrass. Agron. J. 79, 637-641.
Hall, M. H., Beegle, D.B., Bowersox, R.S., Stout, R.C., 2003. Optimum nitrogen
fertilization of cool-season grasses in the northeast USA. Agron. J. 95, 1023-1027.

Effects of pig slurry on forage yield and quality
83
Hernández, D., Polo, A., Plaza, C., 2013. Long-term effects of pig slurry on barley yield
and N use efficiency under semiarid Mediterranean conditions. Eur. J. Agron. 44,
78-86.
Iqbal, M., Iqbal, Z., Farooq, M., Ali, L., Fiaz, M., 2013. Impact nitrogenous fertilizer on
yield and quality of oat. Pak. J. Sci. 65, 1-4.
Islam, M.R., Garcia, S.C., 2012. Effects of sowing date and nitrogen fertilizer on forage
yield, nitrogen- and water-use efficiency and nutritive value of an annual triple-crop
complementary forage rotation. Grass Forage Sci. 67, 96–110.
Jensen, L.S., Pedersen, I.S., Hansen, T.B., Nielsen, N.E., 2000. Turnover and fate of N-
15-labelled cattle slurry ammonium-N applied in the autumn to winter wheat. Eur.
J. Agron. 12, 23–35.
Johnson, R.C., Reiling, B.A., Mislevy, P., Hall, M.B., 2001. Effects of nitrogen
fertilization and harvest date on yield, digestibility, fiber, and protein fractions of
tropical grasses. J. Anim. Sci. 79, 2439-2448.
Karn, J. F., Berdahl, J.D., Frank, A.B., 2006. Nutritive quality of four perennial grasses
as affected by species, cultivar, maturity, and plant tissue. Agron. J. 98, 1400-1409.
Kempers, A. J., 1974. Determination of sub- microquantities of ammonium and nitrates
in soils with fenol, sodium nitroprusside and hypochlorite. Geoderma 12, 201–206.
Kering, M.K., Guretzky, J., Funderburg, E., Mosali, J., 2011. Effect of nitrogen fertilizer
rate and harvest season on forage yield, quality, and macronutrient concentrations in
midland Bermuda grass. Commun. Soil Sci. Plan. 42, 1958-1971.
Keskin, B., Akdeniz, H., Yilmaz, I.H., Turan, M., 2005. Yield and quality of forage corn
(Zea mays L.) as influenced by cultivar and nitrogen rate. J. Agron. 4, 138-141.
Capítulo 2
84
Kidambi, S.P., Matches, A.G., Griggs, T.C., 1989. Variability for Ca, Mg, K, Cu, Zn and
K/(Ca+Mg) ratio among 3 wheat grassess and sainfoin on the southern high plains.
J. Range Manag. 42, 316-322.
Lemus, R., Brummer, E.C., Burras, C.L., Moore, K.J., Barker, M.F., Molstad, N.E., 2008.
Effects of N fertilization on biomass yield and quality in large fields of established
switchgrass in Southern Iowa, USA. Biomass Bioenergy 32, 1187-1194.
Lithourgidis, A.S., Vasilakoglou, I.B., Dhima, K.V., Dordas, C.A., Yiakoulaki, M.D.,
2006. Forage yield and quality of common vetch mixtures with oat and triticale in
two seeding ratios. Field Crop Res. 99, 106-113.
Lloveras. J., 1987. Traditional cropping systems in Northwestern Spain (Galicia). Agric.
Syst. 23, 259-275.
Marsalis, M., Angadi, S., Contreras-Govea, F., 2010. Dry matter yield and nutritive value
of corn, forage sorghum, and BMR forage sorghum at different plant populations
and nitrogen rates. Field Crop Res. 116, 52-57.
Min, D.H., Vough, L.R., Reeves, J.B., 2002. Dairy slurry effects on forage quality of
orchardgrass, reed canarygrass, and alfalfa-grass mixtures. Anim. Feed Sci. Technol.
95, 143-157.
Mut, Z., Ayan, I., Mut, H., 2006. Evaluation of forage yield and quality at two
phenological stages of triticale genotypes and other cereals grown under rainfed
conditions. Bangladesh J. Bot. 35, 45-53.
Ovejero, J., Ortiz, C., Boixadera, J., Serra, X., Ponsá, S., Lloveras, J., Casas, C., 2016.
Pig slurry fertilization in a double-annual cropping forage system under sub-humid
Mediterranean conditions. Eur. J. Agron. 81, 138-149.

Effects of pig slurry on forage yield and quality
85
Perramon, B., Bosch-Serra, A.D., Domingo, F., Boixadera, J., 2016. Organic and mineral
fertilization management improvements to a double-annual cropping system under
humid Mediterranean conditions. Eur. J. Agron. 76, 28-40.
Power, J. F., 1986. Nitrogen cycling in seven cool-season perennial grass species. Agron.
J. 78, 681-687.
Restelatto, R., Pavinato, P.S., Sartor, L.R., Paixão, S.J., 2014. Production and nutritional
value of sorghum and black oat forages under nitrogen fertilization. Grass Forage
Sci. 68, 1-12.
Rogers, J.R., Harvey, R.W., Poore, M.H., Mueller, J.P., Barker, J.C., 1996. Application
of nitrogen from swine lago on effluent to bermudagrass pastures: seasonal changes
in forage nitrogenous constituents and effects of energy and escape protein
supplementation on beef cattle performance. J. Anim. Sci. 74, 1126-1133.
Rostamza, M., Chaichi, M.R., Jahansouz, M.R., Alimadadi, A., 2011. Forage quality,
water use and nitrogen utilization efficiencies of pearl millet (Pennisetum
americanum L.) grown under different soil moisture and nitrogen levels. Agric.
Water Manage. 98, 1607-1614.
Rubio, H.O., Wood, M.K., Gomez, A., Reyes, G., 1996. Native forage quality, quantity,
and profitability as affected by fertilization in Northern Mexico. Range Manag. 49,
315-319.
Scarbrough, D. A., Coblentz, W.K., Coffey, K.P., Harrison, K.F., Smith, T.F., Hubbell,
D.S., Humphry III, J.B., Johnson, Z.B., Turner, J.E., 2004. Effects of nitrogen
fertilization rate, stockpiling initiation date, and harvest date on canopy height and
dry matter yield of autumn stockpiled bermudagrass. Agron. J. 96, 538-546.

Capítulo 2
86
Tomasoni, C., Borrelli, L., Ceotto, E., 2011. Effect of integrated forage rotation and
manure management on yield, nutrient balance and soil organic matter. Ital. J.
Agron. 6, 55-60.
Trindade, H., Coutinho, J., Jarvis, S., Moreira, N., 2001. Nitrogen mineralization in sandy
loam soils under an intensive double-cropping forage system with dairy-cattle slurry
applications. Eur. J. Agron. 15, 281–293.
Trindade, H., Coutinho, J., Jarvis, S., Moreira, N., 2009. Effects of different rates and
timing of application of nitrogen as slurry and mineral fertilizer on yield of herbage
and nitrate-leaching potential of a maize/Italian ryegrass cropping system in north-
west Portugal. Grass Forage Sci. 64, 2-11.
Ul-Allah, S., Khan, A.A., Fricke, T., Buerkert, A., Wachendorf, M., 2014. Fertilizer and
irrigation effects on forage protein and energy production under semi-arid conditions
of Pakistan. Field Crops Res. 159, 62-69.
USEPA, 1992. United States Environmental Protection Agency. Method 6010A.
Inductively coupled plasma-atomic emission spectroscopy. Kovar. J.K. Chapter 6.
methods of determination of P, K, Ca, Mg and others trace elements. In: Peters, J.
(Ed.), Recommended Methods of Manure Analysis. Publ. A3769. Univ. of
Wisconsin-Extension, Madison, WI.
Van der Straeten, B., Buysse, J., Nolte, S., Lauwers, L., Claeys, D., Van Huylenbroeck,
G., 2012. The effect of EU derogation strategies on the compliance costs of the
nitrate directive. Sci. Total Environ. 421–422, 94–101
Yagüe, M.R., Quílez, D., 2010. Response of maize yield, nitrate leaching, and soil
nitrogen to pig slurry combined with mineral nitrogen. J. Environ. Qual. 39, 686–
696.

Effects of pig slurry on forage yield and quality
87
Yagüe, M.R., Quílez, D., 2013. Residual effects of fertilization with pig slurry: double
cropping and soil. Agron. J. 105, 70–78.
Zavattaro, L., Monaco, S., Sacco, D., Grignani, C., 2012. Options to reduce N loss from
maize in intensive cropping systems in Northern Italy. Agric. Ecosyst. Environ. 147,
24–35.


CAPÍTULO 3
EFECTOS DE LA FERTILIZACIÓN CON PURÍN DE CERDO EN UN
DOBLE CULTIVO ANUAL DE CEBADA Y SORGO EN
CONDICIONES SUBHÚMEDAS MEDITERRÁNEAS


91
CAPÍTULO 3
EFECTOS DE LA FERTILIZACIÓN CON PURÍN DE CERDO EN
UN DOBLE CULTIVO ANUAL DE CEBADA Y SORGO EN
CONDICIONES SUBHÚMEDAS MEDITERRÁNEAS
Palabras clave: Doble cultivo, fertilización nitrogenada, sorgo, cebada, nitrógeno
mineral en suelo, purín de cerdo, calidad forrajera.
Abreviaturas:
MS: materia seca
ZVN: zonas vulnerables a la contaminación por nitratos
NAR: nitrógeno aparente recuperado
EAN: eficiencia agronómica del nitrógeno
RESUMEN
La alta concentración de explotaciones porcinas en el NE de España permite que la
utilización de purines sea una estrategia de fertilización atractiva para reducir los costes
de producción. Sin embargo, una inadecuada gestión de la fertilización con purín de cerdo
puede generar un problema medioambiental. En este contexto, un ensayo de campo de
tres años de duración fue llevado a cabo en una rotación de doble cultivo anual con cebada
y sorgo bajo condiciones mediterráneas subhúmedas de secano. Se aplicaron cuatro
tratamientos de fertilización con purín de cerdo (0, 170, 250 y 330 kg N ha-1 año-1) con el
objetivo de evaluar su efecto en la producción, la extracción del N, las pérdidas de N, el
contenido en NO3--N del suelo y en la calidad forrajera de los diferentes cultivos de cada
rotación. En el sorgo, el rendimiento de materia seca (MS) fue similar en todos los
tratamientos de fertilización con un máximo de 11.4 Mg MS ha-1 en la media de los tres
años del ensayo. Sin embargo, en la cebada, el rendimiento de MS cuando se aplicaron
330 kg N ha-1 año-1 (9.8 Mg MS ha-1) fue un 23 y un 39%, más alto que cuando se
aplicaron 250 (7,5. Mg MS ha-1) y 170 kg N ha-1 año-1 (6.0 Mg MS ha-1), respectivamente.

Capítulo 3
92
La aplicación de N, en forma de purín de cerdo, a dosis superiores a los 170 kg N ha-1
año-1 de fertilizante orgánico permitidos por la Directiva de nitratos en zonas vulnerables
a la contaminación por nitratos (ZVN), mejoró tanto el rendimiento de MS como la
calidad del forraje obtenido, en cuanto a proteína bruta (PB) y proteína digestible (PD).
Sin embargo, la aplicación de estas dosis originó mayores pérdidas de N, bien por
lixiviación de nitratos y/o volatilización o bien por inmovilización del N de la materia
orgánica del purín aplicado.
1. Introducción
El censo mundial de ganado porcino es de aproximadamente 960 millones de cabezas
de las cuales, alrededor del 60% se ubican en Asia, el 20% en Europa, y el 16 % en
América (FAOSTAT, 2013). A nivel nacional, en 2015, se alcanzó un censo de 28,3
millones de cabezas, lo que sitúa a España, por primera vez, como el país con mayor
censo de la UE-28 por delante de Alemania (27,5 millones) (EUROSTAT, 2015). Como
líder en la cabaña de ganado porcino en España, se encuentra Cataluña, con un 28% del
censo, seguida por Aragón con un 23%, representando entre ambas más del 50% del censo
total español (MAGRAMA, 2015).
En estas zonas se genera gran cantidad de deyecciones ganaderas que pueden ser
utilizadas directamente como fertilizante orgánico para los cultivos (Yagüe and Quílez,
2010). Sin embargo, una inadecuada gestión de los purines puede generar un problema
medioambiental. La pérdida de nitrógeno a la atmósfera debido a un incorrecto
almacenamiento y aplicación del purín, puede conducir a efectos adversos tales como la
deposición atmosférica que produce la acidificación o la eutrofización de las aguas
superficiales, y un aumento de gases de efecto invernadero, especialmente óxido nitroso
(N2O) (Mosier et al., 1998; Amon et al., 2006; Petersen y Miller, 2006; Sakamoto et al.,
Fertilización con purín en un doble cultivo de cebada y sorgo
93
2006; Ndegwa et al., 2008). Por otro lado, un exceso de fertilización nitrogenada
lleva asociado un riesgo de contaminación de las aguas freáticas por la lixiviación de
nitratos (Isidoro et al., 2006; Salmerón et al., 2010).
Conscientes de esta problemática la Comunidad Europea (CEE) desarrolló e
implementó la Directiva de nitratos (EEC, 1991). Según esta normativa, cada Estado
miembro debe identificar en su territorio zonas vulnerables a la contaminación por
nitratos (ZVN) donde no se permite que la cantidad de deyecciones animales aplicadas al
suelo supere los 170 kg N ha-1 año-1.
Por otra parte, en algunas explotaciones del NE de España, es habitual la práctica del
doble cultivo anual, combinando un cereal de invierno y un cereal de verano, donde
ambos cultivos se destinan como alimento para el ganado de las explotaciones de la zona.
La elevada disponibilidad de purín en esta zona, conlleva a que su uso como fertilizante
orgánico sea rentable económicamente, lo que provoca que la fertilización mineral sea
muy poco utilizada. Los cereales de invierno más frecuentes son la cebada, el trigo y el
triticale. Como cultivo de verano, tradicionalmente se ha utilizado el maíz. Sin embargo,
en los últimos años debido a que en condiciones mediterráneas las precipitaciones durante
el verano suelen ser escasas e irregulares, el sorgo es cada más utilizado por su resistencia
a la sequía (Ejeta y Knoll, 2007; Ramazanzadeh y Asgharipour, 2011; Reddy et al., 2008).
Sin embargo, a pesar de su tolerancia a la sequía, es sensible a déficits de agua en ciertos
estados fenológicos (Tuinstra et al., 1997; Reddy et al., 2009).
Los estudios publicados sobre los efectos de la fertilización del N en los sistemas de
doble cultivo se han realizado, principalmente, utilizando fertilizantes minerales (Guo et
al., 2008; Shang et al., 2014). Son menos numerosos los estudios que hayan analizado el
efecto de la fertilización orgánica en sistemas de doble cultivo en condiciones
mediterráneas. En esta línea, recientemente se han publicado artículos en Italia en

Capítulo 3
94
condiciones mediterráneas de regadío con maíz y otros cultivos (Tomasoni et al., 2011;
Giola et al., 2012; Cavalli et al., 2016; Demurtas et al., 2016). Los trabajos son más
escasos cuando se utiliza el sorgo como uno de los cultivos de la rotación. En un secano
húmedo del NE de España se utilizó el sorgo como doble cultivo con avena (Perramon et
al., 2016). González García et al. (2016), analizaron un doble cultivo de cebada y sorgo
en la comarca de Osona.
Este estudio se enmarca dentro del ensayo de fertilización de larga duración iniciado
en 2006, descrito en el Capítulo 1 de esta memoria de tesis. El objetivo específico fue
evaluar el efecto de diferentes dosis de purín de cerdo en el rendimiento, la extracción de
N del cultivo, el contenido de NO3--N en el suelo y las pérdidas de N, en una rotación
forrajera de doble cultivo con cebada y sorgo.
2. Material y métodos
2.1 Localización del experimento
El estudio se llevó a cabo durante 3 años en un campo experimental situado en el
municipio de Torelló en la comarca de Osona (Cataluña). En este ensayo se evaluó una
rotación de doble cultivo anual de cebada (Hordeum vulgare L.) y sorgo (Sorghum bicolor
L.) desde 2012 hasta 2015, en condiciones de secano, destinándose ambos cultivos a
forraje.
El clima es submediterráneo húmedo de tendencia continental, de transición entre el
clima mediterráneo y el de la Europa Central. La temperatura media anual oscila en torno
a 12 y 13 ºC, con una precipitación anual entre 650 y 750 mm. Los datos de pluviometría
y temperatura fueron registrados por la estación meteorológica automática de Torelló
cercana al campo experimental. Las principales características del suelo del campo se
detallan en el Capítulo 1 de la presente memoria de tesis.

Fertilización con purín en un doble cultivo de cebada y sorgo
95
2.2 Diseño experimental
En este ensayo se combinó la siembra en octubre de cebada con la siembra en junio
de sorgo. El diseño experimental es el mismo que el de la rotación de maíz y triticale
descrita en el Capítulo 1. Consta de bloques completamente aleatorizados con 3
repeticiones, incluyendo cada uno 4 tratamientos de fertilización con purín de cerdo (0,
170, 250 y 330 kg N ha-1 año-1). El tamaño de las parcelas utilizadas fue de 12m x 40m
para permitir la utilización de maquinaria convencional. Las dosis de N totales aplicadas
en este ensayo fueron las mismas que en la anterior rotación (2006-2012) con maíz y
triticale. La aplicación de cada una de las dosis de fertilizante se realizó en las mismas
parcelas experimentales cada año. En la Tabla 1 se detallan las dosis de nitrógeno teóricas
que se han aplicado en cada tratamiento a lo largo del ensayo (2012-2015).
Se utilizó como fertilizante orgánico el purín de cerdo de engorde, procedente de una
granja situada cerca del campo de ensayo. A diferencia de la rotación anterior (Capítulo
1), la fertilización de la cebada se realizó en cobertera, cuando el cultivo se encontraba en
la fase de ahijamiento, en febrero. La aplicación del purín en el sorgo se realizó en fondo
antes de la siembra (junio), sobre suelo desnudo. La fecha de ambas aplicaciones puede
variar de un año a otro, entre 10 y 20 días, en función de las condiciones meteorológicas,
principalmente de la pluviometría de la época (Tabla 2). Para la aplicación del purín se
utilizó una cuba de mangueras o tubos colgantes. El contenido de N del purín de cerdo
fue determinado in situ a partir de la conductividad eléctrica y la densidad del purín de la
cuba. Posteriormente, se ajustó la velocidad del tractor para aplicar los kg de N que
corresponden a cada tratamiento. En las parcelas control sólo se fertilizó manualmente
con cloruro potásico al 60%, antes de la siembra del sorgo. La dosis de la aplicación se
realizó basándose en las extracciones del cultivo, para compensar las necesidades de
potasio.

Capítulo 3
96
Tabla 1. Distribución de las dosis teóricas de N (kg N ha-1), aportadas en forma de purín de
cerdo, para cada tratamiento en cada cultivo de la rotación en el periodo experimental 2012-2015.
Unas horas después de cada aplicación de fondo, se realizó un pase con un cultivador
Chisel a unos 15 cm de profundidad para incorporar el purín, con el objetivo de minimizar
las pérdidas de nitrógeno por volatilización. En el caso de la aplicación de cobertera, el
purín no pudo ser enterrado al efectuarse la aplicación en el periodo de ahijamiento del
cereal de invierno.
2.3 Manejo del cultivo
Tanto la cebada como el sorgo fueron manejados según las prácticas habituales de la
zona de estudio, llevándose a cabo en ambos cultivos el mismo trabajo de fondo. Después
de la cosecha de cada cultivo se realizó un pase con cultivador Chisel a 15 cm de
profundidad.
La siembra de cada cultivo, se realizó mediante una sembradora neumática. Esta
sembradora dispone de un rodillo para facilitar el contacto de la semilla con la tierra y
asegurarse una correcta germinación. La cebada se sembró en noviembre con una
separación de 12 cm entre las filas y se cosechó a principios de junio en fase de grano
pastoso temprano, correspondiente al número 83 de la escala de Zadoks et al. (1974). El
sorgo se sembró normalmente en junio (dependiendo de las condiciones climáticas la
siembra podría retrasarse) con una separación de 75 cm entre las filas y unos 18 cm entre
Tratamiento Acrónimo del
tratamiento
Cobertera
(Cebada) Fondo (Sorgo) Total anual
Control T0 0 0 0
Dosis baja T1 0 170 170
Dosis media T2 80 170 250
Dosis alta T3 80 250 330

Fertilización con purín en un doble cultivo de cebada y sorgo
97
las semillas y se cosechó en octubre aproximadamente en fase de grano pastoso,
correspondiente al número 8 de la escala de Vanderlip (1993) (Tabla 2).
Tabla 2. Cultivos, variedades, fechas de siembra y de cosecha durante el ensayo (periodo 2012-
2015).
Campaña Cultivo Variedad (Ciclo) Fecha de siembra Fecha de cosecha
2012-2013
Cebada Cometa 23/11/2012 04/06/2013
Sorgo Superdolce 10 28/06/2013 08/10/2013
2013-2014 Cebada Ketos 06/11/2013 02/06/2014
Sorgo Grass II 20/06/2014 27/10/2014
2014-2015
Cebada Cometa 19/11/2014 05/06/2015
Sorgo Grass II 03/08/2015 26/10/2015
Para la cosecha de la cebada, se utilizó una segadora de 6 discos de 2,25 m de
anchura. Primero se realizó un pase por los extremos superior e inferior de cada parcela
para excluir los márgenes del muestreo y a continuación se segó la parte central de la
parcela. La superficie segada fue de 68,4 m2 (30,4 m de largo x 2,25 m de ancho). En el
caso del sorgo, se segó la mitad de la parcela utilizando una segadora-picadora
convencional de 5 m de anchura junto con un remolque autopesante (con balanza
incorporada). La superficie segada fue de unos 200 m2 (40 m de largo x 5 m de ancho).
En ambos cultivos la biomasa obtenida se destinó como forraje para la alimentación del
ganado.
2.4 Análisis de purín, suelo y planta
De cada cisterna de purín que se aplicó en el campo experimental se cogió una
muestra, que, debidamente identificada se congeló a -20 °C hasta su llegada al laboratorio
de análisis Applus (Sidamon. Lleida), donde se procedió a su análisis. La cantidad real de
N aplicado y tenido en cuenta para los cálculos en este trabajo, se estableció de acuerdo
con las características fisicoquímicas del purín (Tabla 3).

Capítulo 3
98
Tabla 3. Parámetros fisicoquímicos medios, unidades y métodos de análisis del purín de cerdo
aplicado de 2012 a 2015 en el campo experimental.
Durante todo el ensayo se llevó a cabo un seguimiento periódico del contenido en
NO3--N del suelo. El muestreo se realizó después de la cosecha del sorgo (octubre) y de
la cebada (junio). Además, al realizar una fertilización de cobertera durante el ahijamiento
de la cebada, se llevó a cabo otro muestreo de NO3--N del suelo en febrero. Las muestras
de suelo se extrajeron de 2 puntos escogidos al azar en cada parcela, y a 3 profundidades:
0-30, 30-60 y 60-90 cm. En cada parcela se obtuvo una sola muestra compuesta para cada
profundidad. El análisis de NO3--N se realizó en el laboratorio de análisis Applus
(Sidamon. Lleida) a partir de un extracto de la muestra fresca en agua desionizada, por
colorimetría (Kempers, 1974) en un autoanalizador de flujo continuo. El contenido de N-
NO3-, en los análisis efectuadas a lo largo del estudio, se expresó en kg N-NO3
- ha-1,
teniendo en cuenta la suma del contenido de N-NO3- en el perfil del suelo de 0 a 90 cm.
Para la determinación de la biomasa total en fresco, tanto del sorgo como de la
cebada, se pesó el forraje en el campo en el momento de la cosecha y se tomó una
submuestra. Posteriormente, se determinó en el laboratorio la materia seca (MS), secando
Parámetro Método de análisis Unidades Valores
pH Potenciometría. Dilución 1:5 8,4 ± 0,2
Conductividad eléctrica Conductimetría a 25 °C, dilución 1:5 dS m-1 23,2 ± 2,6
Materia seca Gravimetría, a 105°C kg MS Mg-1) 46 ± 12
Materia orgánica Gravimetría indirecta, calcinación a 550°C kg MO Mg-1) 29,8 ± 8,7
Nitrógeno Total Método Kjeldahl. (kg N m-3) 3,4 ± 1,1
Nitrógeno amoniacal Destilación y tritación
método 4500-NH3 B-C (APHA, 2012) (kg N m-3) 2,8 ± 0,2
Nitrógeno orgánico Método Kjeldahl.
Digestión ácida de la muestra seca a 105°C (kg N m-3) 1,1 ± 0,5
Fósforo Espectroscopia de emisión atómica
(ICP-AES)(USEPA, 1992) (kg P2O5 m-3) 0,7 ± 0,2
Potasio Espectroscopia de emisión atómica
(ICP-AES)(USEPA, 1992) (kg K2O m-3) 2,2 ± 0,1

Fertilización con purín en un doble cultivo de cebada y sorgo
99
la submuestra en una estufa de aire forzado a 60 °C durante 48 horas. En ambos cultivos,
el resultado final se expresó en kg MS ha-1.
Se determinó la calidad forrajera de cada uno de los cultivos a partir de los análisis
bromatológicos de la muestra seca realizados en el Laboratorio Agroalimentario del
IRTA en Cabrils. Los parámetros que se determinaron son: humedad, MS, nitrógeno (N),
proteína bruta (PB), proteína digestible (PD), fibra bruta (FB), fibra ácido detergente
(FAD), fibra neutro detergente (FND), lignina ácida detergente (LAD) y energía neta de
lactación (ENL). Los análisis de estos parámetros de la calidad forrajera se han realizado
mediante el método de espectrometría de infrarrojo cercano (NIR) previamente calibrado.
Para aquellas muestras que en determinados parámetros los valores obtenidos no
quedaron incluidos en la recta de calibración de NIR se realizó la determinación mediante
el método convencional (método Kjedahl para las proteínas y gravimétrico para las fibras
y ligninas). El contenido de PB se calculó multiplicando el contenido de N por la
constante 6.25 (AOAC, 1980). Los parámetros de calidad forrajera fueron expresados en
g kg-1 MS. La extracción de N por el cultivo se calculó multiplicando el contenido de N
en planta por el contenido de MS de la cosecha.
2.5 Pérdidas de N
Tal y como se ha descrito en el Capítulo 1, se calculó un balance de N en cada parcela,
separadamente por cada campaña y cultivo. Se estimó la mineralización de la materia
orgánica del suelo en las parcelas control, suponiendo que la lixiviación de nitratos, las
pérdidas de amoníaco y el N del agua de lluvia fueron insignificantes en parcelas no
fertilizadas, de acuerdo con la ecuación (Sexton et al., 1996):
- Nmin = Nf + Np – Ni (Ecuación 1)

Capítulo 3
100
Donde:
Nmin: N mineralizado en el tratamiento control (kg N ha-1)
Nf: Contenido de N-NO3- en el perfil del suelo (0-90 cm) después de la cosecha
(kg NO3--N ha-1)
Np: N extraído por el cultivo en la cosecha (kg N ha-1)
Ni: Contenido de NO3--N en el perfil del suelo (0-90 cm) antes de la siembra (kg
NO3--N ha-1)
Las pérdidas de Nitrógeno se estimaron a partir del balance de N en las parcelas
fertilizadas (Berenguer et al., 2009; Cela et al., 2011) según la ecuación:
- Pérdidas de N = Nf + Np – Ni – Nmin – Nfer (Ecuación 2)
Donde:
Nfer: N aplicado en la fertilización (kg N ha-1)
Un valor negativo de las pérdidas de N se interpretó como la suma de NO3--N
lixiviado, N perdido por volatilización del amoniaco y desnitrificación, N orgánico
aplicado, NH4+-N inmovilizado y fijado en las arcillas. Mientras que un valor positivo se
interpretó como aportes de N no contabilizados.
2.6 Eficiencia en el uso del nitrógeno
Se calcularon los siguientes parámetros relacionados con la eficiencia del nitrógeno
(López-Bellido y López-Bellido, 2001) para cada tratamiento de fertilización en ambos
cultivos:
- % de N aparentemente recuperado (NAR):
% NAR= [(Npf. - Np0) / Nfer]*100 (Ecuación 3)
Donde:
Npf: N extraído por el cultivo en el tratamiento de fertilización (kg N ha-1)

Fertilización con purín en un doble cultivo de cebada y sorgo
101
Np0: N extraído por el cultivo en el tratamiento control (kg N ha-1)
Nfer: N aplicado en el tratamiento de fertilización (kg N ha-1)
- Eficiencia agronómica de N (EAN) (kg kg -1)
EAN= (Rf - R0) / Nfer (Ecuación 4)
Donde:
Rf: Rendimiento en el tratamiento de fertilización (kg MS ha-1)
R0: Rendimiento en el tratamiento control (kg MS ha-1)
Nfer: N aplicado en el tratamiento de fertilización (kg N ha-1)
2.7 Análisis estadístico
Se realizó un modelo de análisis de varianza (ANOVA) de diseño mixto teniendo en
cuenta las campañas de cada cultivo como medidas repetidas, para evaluar la respuesta
de las diferentes variables a la fertilización. Si la interacción entre las campañas y el
tratamiento fue significativa, se realizaron análisis por separado de cada campaña
(ANOVA de un factor). Cuando fueron detectadas diferencias significativas entre
tratamientos, se realizó una separación de medias según el test de Duncan con un intervalo
de confianza del 95%. Los análisis estadísticos de los resultados se realizaron utilizando
el software IBM SPSS para Windows, versión 23.0 (IBM Corp., Armonk, NY, EE.UU.)
3. Resultados
3.1 Condiciones climáticas durante el periodo experimental
La precipitación total y la temperatura media registradas durante el periodo
experimental se presentan en la Figura 1. La precipitación total (suma de las
precipitaciones de la campaña del cultivo de la cebada y del sorgo) fue muy variable entre
los tres años del experimento. La precipitación en las campañas 2012/13 con 774,9 mm

Capítulo 3
102
y la 2013/14 con 997,4 mm fue superior a la precipitación media anual en el período
1985-2006 (651 mm). Sin embargo, la precipitación durante la campaña 2014/15 fue más
baja (609,9 mm). Cabe destacar que en la campaña 2013/14 la mayoría de las
precipitaciones ocurrieron durante el crecimiento del sorgo (de junio a octubre: 752,4
mm), con una diferencia de 400 mm respecto a la media de los meses del ciclo de cultivo
del sorgo en el periodo 1985-2006 (351,9 mm).
La diferencia en la temperatura media entre las campañas de cultivo analizadas fue
relativamente pequeña, variando de 13,1 °C en 2012/13 a 13,7 °C en 2013/14. La
temperatura media anual durante todo el período experimental fue 13,5 °C.
Figura 1. Temperatura media del aire y precipitación mensual total, para el período
experimental (2012-2015). Los períodos históricos (1985-2006) se muestran como líneas
sólidas. (C: cebada, S: sorgo).

Fertilización con purín en un doble cultivo de cebada y sorgo
103
3.2 Rendimiento de los cultivos
En el global del experimento, la producción de MS (cebada + sorgo) fue
significativamente afectada por el tratamiento de fertilización y la campaña del cultivo,
pero no por su interacción (Tabla 4). El rendimiento medio de los tres años
experimentales en las parcelas control (9.8 Mg MS ha-1) fue significativamente inferior
al del resto de tratamientos de fertilización. A su vez, el rendimiento en el tratamiento T3
(20.9 Mg MS ha-1) fue significativamente superior al de los tratamientos T2 y T1 (18.9 y
17.5 Mg MS ha-1, respectivamente) (Tabla 4).
En referencia a la cebada, en los tres años de estudio, los rendimientos de MS fueron
influenciados por el tratamiento de fertilización, la campaña y por la interacción entre
estos dos factores. El rendimiento de la cebada aumentó significativamente al aumentar
la dosis de fertilización. En el análisis llevado a cabo para cada año, se observó que el
rendimiento de cada tratamiento en la campaña 2012/13 fue considerablemente superior
al de las campañas 2013/14 y 2014/15. En cada una de estas campañas se detectaron
diferencias significativas entre los diferentes tratamientos de fertilización (Figura 2),
aumentando el rendimiento al incrementar la dosis de fertilización.
En cuanto al sorgo, el tratamiento de fertilización afectó significativamente al
rendimiento de MS en la media de los tres años. Sin embargo, únicamente se observaron
diferencias significativas entre T0 (7.0 Mg MS ha-1) y el resto de tratamientos de
fertilización T1, T2 y T3 (11.5, 11.4 y 11.1 Mg MS ha-1, respectivamente) (Tabla 4). Por
otro lado, no se observaron diferencias significativas ni en la campaña de cultivo ni en su
interacción con el tratamiento, debido a que el rendimiento de cada tratamiento fue similar
en cada uno de los años analizados (Figura 2).

Capítulo 3
104
Tabla 4. Efecto de la dosis de fertilización nitrogenada con purín de cerdo en el rendimiento, la
extracción de N, las pérdidas de N, el % de N aparentemente recuperado (NAR) y la eficiencia
agronómica del N (EAN) para cada cultivo y la suma de ambos en el conjunto de los tres años del
periodo experimental (2012-2015).
Cultivo Tratamientoα Rendimiento MS
(Mg/ha)
Extracción N
(kg ha-1)
Pérdidas N
(kg ha-1)
NAR
(%)
EAN
(kg kg-1)
Cebada T0 2,8d 25d β26 - -
T1 6,0c 57c -37c - -
T2 7,5b 78b -101b 63,6 55,8
T3 9,8a 114a -172a 106,0 80,7
Media 6,5 69 -78 84, 8 68,3
ANOVA
Tratamiento (T) *** *** ** * *
Campaña (C) *** *** ** *** ***
T x C ** *** NS NS NS
Sorgo T0 7,0b 59b β65 - -
T1 11,5a 130a -47 45,1 30,0a
T2 11,4a 132a -40 48,3 29,6b
T3 11,1a 148a -85 38,7 18,3b
Media 10,2 117 -43 44,0 26,0
ANOVA
Tratamiento (T) *** *** NS NS *
Campaña (C) NS *** NS NS NS
T x C NS NS NS NS NS
Cebada + Sorgo T0 9,8c 84c β91 - -
T1 17,5b 187b -84b 66,8 51,3a
T2 18,9b 210b -141b 54,0 39,1b
T3 20,9a 262a -257a 55,6 34,8b
Media 16,8 186 -161 58,8 41,8
ANOVA
Tratamiento (T) *** *** ** NS **
Campaña (C) *** *** * ** **
T x C NS ** NS NS NS
α Los acrónimos de los tratamientos se describen en la Tabla 1. β El valor corresponde a la mineralización estimada en T0 necesaria para calcular las pérdidas de
N en los otros tratamientos de fertilización.
Ausencia de valor (-) indica que no hubo fertilización en ese periodo.
NS: no significativo. *, ** y *** significativo para P<0.05, P<0.01 y P<0.001, respectivamente.
Dentro de cada variable y para cada cultivo, las letras diferentes indican diferencias significativas
entre los tratamientos de fertilización según el test de Duncan para P<0.05.

Fertilización con purín en un doble cultivo de cebada y sorgo
105
Figura 2. Rendimiento de los cultivos para cada una de las campañas del periodo experimental
en función de la dosis de fertilización nitrogenada. Los acrónimos de los tratamientos se describen
en la Tabla 1. Barras de error verticales indican la desviación estándar. *** significativo para
P<0.001. Dentro de cada año y para cada cultivo, las letras diferentes indican diferencias
significativas entre los tratamientos de fertilización según el test de Duncan para P<0.05.

Capítulo 3
106
3.3 Extracción de N por los cultivos
La extracción del N total, teniendo en cuenta la suma de los dos cultivos (cebada +
sorgo) en el global del experimento, respondió positivamente a la dosis de fertilización
aplicada, variando significativamente con la campaña y la interacción entre ambos
factores (Tabla 4). El patrón de significación entre tratamientos fue similar al comentado
para el rendimiento de MS total de ambos cultivos. En este sentido, la extracción de N en
T3 (262 kg N ha-1) fue significativamente superior al resto de tratamientos (Tabla 4). En
cada una de las campañas analizadas se observaron diferencias significativas entre los
diferentes tratamientos de fertilización (Tabla 5).
En el caso de la cebada, la media de la extracción de N de los tres años experimentales
fue afectada por el tratamiento de fertilización y la campaña, así como por su interacción
(Tabla 4). La extracción de N varió significativamente entre los diferentes tratamientos,
con un aumento gradual desde el control (T0) hasta la dosis alta (T3) (Tabla 4). Estas
diferencias significativas entre los tratamientos se observan en todas las campañas (Tabla
5). Cabe destacar que la media de la extracción de N de todos los tratamientos fue
considerablemente superior en la campaña 2012/13 respecto de las campañas 2013/14 y
2014/15 (Tabla 5).
En el sorgo, en el global del experimento, el tratamiento de fertilización afectó
significativamente a la extracción de N (Tabla 4). La extracción de N en el control (T0)
(59 kg N ha-1) fue significativamente inferior comparada con el resto de tratamientos de
fertilización T1, T2 y T3 (130, 132 y 148 kg N ha-1, respectivamente) entre los cuales no
hay diferencias significativas (Tabla 4).

Fertilización con purín en un doble cultivo de cebada y sorgo
107
Tabla 5. Extracción de N por los cultivos para cada una de las campañas del periodo experimental
en función de la dosis de fertilización nitrogenada.
Cultivo Tratamientoα Extracción N (kg ha -1)
2012/13 2013/14 2014/15
Cebada T0 49c 9b 18c
T1 111b 20b 39b
T2 136b 41a 57b
T3 202a 53a 88a Media 124 31 51
Significación *** ** **
2013 2014 2015
Sorgo T0 96 73 68
T1 125 123 120
T2 130 145 131
T3 164 175 183
Media 129 129 125
2012/13 2013/14 2014/15
Cebada
+
Sorgo
T0 90c 58c 104c
T1 201b 123b 236b
T2 237b 171a 223b T3 326a 180a 281a Media 213 133 211
Significación *** *** ***
α Los acrónimos de los tratamientos se describen en la Tabla 1.
NS: no significativo. ** y *** significativo para P<0.01 y P<0.001, respectivamente.
Dentro de cada campaña y para cada cultivo, las letras diferentes indican diferencias significativas
entre los tratamientos de fertilización según el test de Duncan para P˂0.05.
3.4 Contenido de NO3--N en el suelo.
Se observó una variación en el contenido de NO3--N en el suelo a lo largo del periodo
experimental según la cantidad de purín aplicado. Los niveles más altos de NO3--N en el
suelo se observaron en octubre de 2012 en T3 (487 kg NO3--N ha-1) (Figura 3). Sin
embargo, exceptuando el citado muestreo de octubre de 2012, los niveles de NO3--N del
suelo se podrían considerar bajos durante todo el periodo (Figura 3). Desde febrero hasta
octubre de 2013 el contenido de NO3--N fue superior en T3 comparado con los otros
tratamientos, además se observó un ligero incremento de los niveles en cada uno de ellos.
A partir de octubre de 2013, el contenido de NO3--N disminuyó de manera notoria en

Capítulo 3
108
los diferentes muestreos, siendo similar en cada tratamiento y por debajo de 60 kg
NO3--N ha-1. En el último muestreo efectuado en octubre de 2015, el contenido en NO3
-
-N se incrementó ligeramente, observándose de manera más evidente en los tratamientos
en los que se aplicó el fertilizante (Figura 3).
Figura 3. Contenido de NO3--N en suelo (0-90 cm) en las fechas de muestreo bajo los
diferentes tratamientos durante los 3 años del periodo experimental. Los acrónimos de los
tratamientos se describen en la Tabla 1.
3.5 Pérdidas de N
Teniendo en cuenta la suma de cebada y sorgo en el promedio de los tres años del
ensayo, se encontraron diferencias significativas en las pérdidas de N debido al
tratamiento de fertilización y la campaña de cultivo (Tabla 4). Las pérdidas de N en T3
(257 kg N ha-1) fueron significativamente superiores a las de T2 y T1 (141 y 84 kg N
ha-1, respectivamente (Tabla 4).
En la cebada, las pérdidas de N dependieron del tratamiento de fertilización y de la
campaña, sin embargo, no se detectó interacción entre estas dos variables. Las pérdidas
de N en T3 fueron significativamente más altas que en T2 y T1 (Tabla 4).
En referencia al sorgo, aunque el promedio de las pérdidas de N no fue
significativamente diferente entre los tratamientos de fertilización, las pérdidas de N en

Fertilización con purín en un doble cultivo de cebada y sorgo
109
T3 (85 kg N ha-1) fueron aproximadamente el doble que en T2 y T1 (40 y 47 kg N ha-1,
respectivamente) (Tabla 4). En general, la media de las pérdidas de N a lo largo del ensayo
de todos los tratamientos analizados, fueron casi el doble en cebada (78 kg N ha-1)
comparado con el sorgo (43 kg N ha-1), aunque se aplicaron dosis más elevadas de N en
el sorgo respecto a la cebada (Tabla 1 y 4).
3.6 Eficiencia en el uso del N
Considerando conjuntamente la cebada y el sorgo, el promedio del nitrógeno
aparentemente recuperado (NAR) no varió significativamente entre los diferentes
tratamientos de fertilización (Tabla 4). De igual forma, en el sorgo, el NAR no se vio
afectado por el tratamiento de fertilización, sin embargo, en la cebada, tanto el tratamiento
de fertilización como la campaña influyeron significativamente en el NAR (Tabla 4).
En el global del experimento, la eficiencia agronómica del nitrógeno (EAN) fue
afectada por el tratamiento de fertilización y la campaña, tanto en la suma de cebada y
sorgo, como en la cebada analizada individualmente. En el caso del sorgo la EAN solo se
vio influenciada por el tratamiento de fertilización (Tabla 4).
3.7 Calidad forrajera
La Tabla 6 resume el efecto de los diferentes tratamientos de fertilización con purín
de cerdo sobre los parámetros de calidad forrajera analizados durante el ensayo. Ni en las
fibras (FB, FAD, FND) ni en la energía neta de lactación (ENL), se detectaron diferencias
significativas (p> 0,05) entre los tratamientos de fertilización. Además, no se observó una
tendencia clara durante todo el estudio de acuerdo con el tratamiento de purín de cerdo
aplicado. En la lignina ácido detergente (LAD) se observó un efecto significativo del
tratamiento y de la campaña de cultivo, cuando se analizó la suma de la cebada y el sorgo,

Capítulo 3
110
así como el sorgo individualmente. Mientras que, en la cebada, la LAD sólo fue
significativamente diferente según el tratamiento de fertilización aplicado.
La concentración media total de PB y PD (cebada + sorgo) fue influenciada por el
tratamiento de fertilización, la campaña y su interacción. El contenido total de PB en T3
(151.6 g kg-1 de MS) fue significativamente superior que en T2, T1 y T0 (136.4, 127.1 y
111.0 g kg-1 de MS, respectivamente) (Tabla 6). En el análisis estadístico efectuado por
campañas, la PB y la PD variaron significativamente dependiendo del tratamiento de
fertilización aplicado en las campañas 2012/13 y 2013/14 (Tabla 7).

Fertilización con purín en un doble cultivo de cebada y sorgo
111
Tabla 6. Efecto de la dosis de fertilización nitrogenada con purín de cerdo en los parámetros de
calidad forrajera para cada cultivo y suma de ambos en el conjunto de los tres años del periodo
experimental (2012-2015).
α Los acrónimos de los tratamientos se describen en la Tabla 1.
NS: no significativo. *, ** y *** significativo para P˂0.05, P˂0.01 y P˂0.001, respectivamente.
Dentro de cada variable y para cada cultivo, las letras diferentes indican diferencias significativas
entre los tratamientos de fertilización según el test de Duncan para P˂0.05.
Cultivo Tratamientoα PB
(g kg-1 MS)
PD
(g kg-1 MS)
FB
(g kg-1 MS)
FAD
(g kg-1 MS)
FND
(g kg-1 MS)
LAD
(g kg-1 MS)
ENL
(Mcal kg -1)
Cebada T0 57,9b 39,2 220,9 258,7 520,2 30,4b 1,55
T1 57,5b 38,3 230,9 265,7 530,1 33,4ab 1,53
T2 62,8ab 41,9 227,2 263,8 517,0 34,5a 1,54
T3 68,9a 44,9 240,9 282,8 540,3 36,5a 1,48
Media 61,8 41,1 230, 0 267,7 526,9 33,7 1,52
ANOVA
Tratamiento (T) * NS NS NS NS * NS
Campaña (C) ** * *** ** NS NS **
T x C ** * NS NS NS NS NS
Sorgo T0 53,1c 29,1b 324,8 396,1 675,3a 42,9b 1,15
T1 69,6b 40,9a 302,4 371,2 627,9b 45,8b 1,22
T2 73,7ab 42,8a 317,6 381,3 635,3b 49,0ab 1,19
T3 82,7a 47,8a 312,8 382,8 630,1b 56,1a 1,19
Media 69,8 40,2 314,4 382,9 642,2 48,5 1,19
ANOVA
Tratamiento (T) ** ** NS NS * * NS
Campaña (C) *** *** ** * * ** *
T x C NS NS NS NS NS NS NS
Cebada + Sorgo T0 111,0c 68,4c 545,7 654,8 1195,6 73,3c 2,70
T1 127,1b 79,2bc 533,3 636,9 1158,0 79,2bc 2,75
T2 136,4b 84,7ab 544,8 645,1 1152,3 83,4ab 2,73
T3 151,6a 92,7a 553,7 665,6 1170,4 92,6a 2,66
Media 131,6 81,2 544,4,7 650,6 1169,1 82,1 2,71
ANOVA
Tratamiento (T) ** ** NS NS NS ** NS
Campaña (C) *** *** * NS NS * NS
T x C ** ** NS NS NS NS NS

Capítulo 3
112
Tabla 7. Contenido de proteína bruta (PB) y digestible (PD) del forraje de los cultivos para cada
una de las campañas del periodo experimental en función de la dosis de fertilización nitrogenada.
Cultivo Tratamientoa PB (g kg-1 DM) PD (g kg-1 DM)
2012/13 2013/14 2014/15 2012/13 2013/14 2014/15
Cebada T0 51,9c 52,1 69,8 34,2c 34,9 48,6
T1 60,8bc 49,6 62,1 39,4bc 33,4 42,0
T2 68,1b 59,7 60,4 43,6b 41,1 40,9
T3 84,0a 60,5 62,3 51,6a 41,4 41,6
Media 66,2 55,5 63,6 42,2 37,7 43,3
Significancia *** NS NS ** NS NS
2013 2014 2015 2013 2014 2015
Sorgo T0 96 96 73 68 73 68
T1 125 125 123 120 123 120
T2 130 130 145 131 145 131
T3 164 164 175 183 175 183
Media 129 129 129 125 129 125
2012/13 2013/14 2014/15 2012/13 2013/14 2014/15
Cebada
+
Sorgo
T0 91,2c 94,0b 147,8 53,4c 60,3b 91,4
T1 113,3b 104,4b 163,7 70,9b 67,7b 99,0
T2 125,1b 127,1a 157,1 77,7b 80,7a 95,7
T3 158,9a 126,3a 169,6 97,7a 81,1a 99,4
Media 122,1 113,0 159,6 74,9 72,4 96,4
Significancia *** * NS ** * NS
a Los acrónimos de los tratamientos se describen en la Tabla 1.
NS: no significativo. *, ** y *** significativo para P˂0.05, P˂0.01 y P˂0.001, respectivamente.
Dentro de cada campaña y para cada cultivo, las letras diferentes indican diferencias significativas
entre los tratamientos de fertilización según el test de Duncan para P˂0.05.
4. Discusión
4.1 Rendimiento y extracción de N del cultivo
Debido a que las precipitaciones durante el ciclo del sorgo fueron superiores a la
media del periodo histórico 1985-2016 (351 mm) para el mismo periodo, el rendimiento
medio del sorgo a lo largo del experimento fue similar en cada una de las campañas. Por
otro lado, se observó que, tanto el rendimiento de MS como la extracción de N en el sorgo
fueron similares en todos los tratamientos de fertilización. Esto podría ser debido a que
las elevadas precipitaciones durante el ciclo del sorgo, unido a las altas temperaturas
registradas durante los meses de verano, podrían haber inducido un incremento de la tasa
de mineralización. Este incremento pudo ocasionar que el rendimiento en los tratamientos

Fertilización con purín en un doble cultivo de cebada y sorgo
113
que habían recibido menos dosis de fertilizante se igualara o incluso superara al obtenido
en el tratamiento T3. El rendimiento máximo de MS en la media de los 3 años
experimentales de nuestro estudio de 11.4 Mg MS ha-1, fue superior al obtenido por
Perramón et al. (2016) (8.2 Mg MS ha-1) en el sorgo de un doble cultivo con avena en
condiciones húmedas situado en una comarca limítrofe a la del presente estudio. Sin
embargo, González García et al. (2016), en un estudio realizado en la comarca de Osona,
publicaron para el sorgo forrajero en doble cultivo, rendimientos de 12.7 Mg MS ha-1.
A diferencia del sorgo, el rendimiento de MS y la extracción de N en la cebada varió
considerablemente a lo largo de los 3 años experimentales. Las escasas precipitaciones
durante el periodo de crecimiento del cultivo (marzo-mayo), concretamente en las
campañas 2013/14 y 2014/15 limitaron su crecimiento (Figura 1), provocando una gran
variación en el rendimiento de MS obtenido respecto al alcanzado en la campaña 2012/13
(Figura 2). Aparte del contenido de agua en el suelo durante el cultivo, los cereales de
invierno pueden ser influenciados por diferentes factores, entre los que se incluyen la
respuesta a la fertilización nitrogenada y el contenido inicial de NO3--N en el suelo (Pardo
et al., 2009; López-Bellido et al., 2001b). En este estudio, los rendimientos de MS y la
extracción del N de la cebada fueron claramente afectados por la dosis de fertilización
nitrogenada. El rendimiento de MS en T3 fue un 23 y un 39%, más alto que en T2 y T1,
respectivamente.
En el global de la rotación, teniendo en cuenta la suma de cebada y sorgo en los tres
años de estudio, los rendimientos de MS (20.9 Mg MS ha-1) y las extracciones de N (262
kg N ha-1) más altos se alcanzaron cuando se aplicaron 330 kg N ha-1 año-1 (T3). Esta
dosis de fertilización es superior a los 170 kg N ha-1 año-1 de fertilizante orgánico
permitidos por la Directiva de nitratos en ZVN (EEC, 1991). Estos resultados son
similares a los obtenidos por Trindade et al. (2009) que observó que en algunos sistemas

Capítulo 3
114
de doble cultivo podría resultar eficiente la aplicación de grandes cantidades de purín. En
este sentido, Perramon et al. (2016) concluyeron que en sistemas de doble cultivo podría
ser factible la aplicación de dosis superiores a las permitidos por la Directiva de nitratos.
4.2 Contenido de NO3--N en el suelo, pérdidas de N y eficiencia en el uso
del N
La acumulación de NO3--N en el suelo observada en octubre de 2012, podría
incrementar el riesgo de lixiviación del N durante el otoño y el invierno siguientes, si
ocurrieran fuertes episodios de precipitación (Liu et al., 2003; Nevens and Reheul, 2005;
Brye et al., 2003). Los niveles de NO3--N en el suelo fueron más altos en este muestreo
debido a que no hubo extracciones de N del maíz anterior. La escasez de precipitaciones
durante su periodo de cultivo no permitió una correcta nascencia, derivando en una
ausencia de cultivo en esta campaña. De manera general el contenido de NO3--N en el
suelo fue más alto en octubre que en junio o en febrero. Esto fue probablemente debido a
que las dosis de fertilización aplicadas al cultivo de verano son más altas y tal vez también
por un incremento de la mineralización de la materia orgánica a final del verano-
principios de otoño. En este periodo se dan condiciones más favorables en cuanto a
humedad y temperatura que podrían afectar a la tasa de mineralización neta (Qiu et al.,
2012; Yagüe and Quílez, 2015). Por otro lado, a partir de octubre de 2013 el contenido
en NO3--N fue similar para todos los tratamientos. Por lo tanto, las diferencias
significativas observadas entre T3 y T2 en el rendimiento de MS de la cebada en la
campaña 2014/15, podrían ser atribuidas al efecto residual del purín aplicado en el sorgo
anterior, dado que en estos tratamientos la dosis de fertilización fue la misma. Este
comentario valdría para T0 y T1 ya que en el cultivo de la cebada no fueron fertilizados,
sin embargo, se observó una diferencia entre ellos de 3.2 Mg MS ha-1. Este efecto residual
del purín en sistemas de doble cultivo también fue observado por Grignani et al. (2007).

Fertilización con purín en un doble cultivo de cebada y sorgo
115
La eficiencia en el uso del N es también importante en sistemas de doble cultivo
debido a las altas cantidades de N requeridas por los cultivos forrajeros en estos sistemas.
Los dobles cultivos mejoran la eficiencia en el uso del N comparado con un sistema de
un cultivo anual (Zavattaro et al., 2012) y permiten incrementar la producción (Borrelli
et al., 2014). En este estudio, la eficiencia en el uso del N fue mayor en la cebada que en
el sorgo. Esta alta eficiencia en el uso del N en la cebada puede ser debido al uso del NO3-
-N residual del cultivo precedente, que incluye la mineralización de la materia orgánica
del purín aplicado en dicho cultivo (Yagüe and Quílez, 2013; Hartmann et al., 2014). La
alta eficiencia en el uso del N podría haberse visto favorecida por el hecho de que se
efectuara la aplicación del fertilizante en cobertera, que evita en parte las pérdidas de
lixiviación respecto si se aplica en fondo sobre suelo desnudo (Sieling et al., 2014). Esta
aplicación, se llevó a cabo mediante una cuba de mangueras colgantes, además, tuvo lugar
en un periodo de bajas temperaturas (febrero), por lo que ambas situaciones habrían
ayudado a disminuir las pérdidas por volatilización.
Las pérdidas de N totales (cebada + sorgo) en el global del experimento fueron
significativamente afectadas por la dosis de fertilización, siendo más altas en T3 que en
el resto de tratamientos. En este estudio de tres años de duración, el efecto residual del
purín aplicado en el sorgo, podría haber resultado en un aumento del contenido de NO3--
N inicial en la cebada. Este contenido de NO3--N en el suelo, podrían conllevar un
incremento de las pérdidas de N, probablemente por lixiviación durante el cultivo de la
cebada. Esto podría explicar en parte que las pérdidas de N fueran más elevadas en la
campaña de cultivo de la cebada respecto a la del sorgo, pese haber recibido dosis más
bajas de N. El efecto residual del purín incrementó las pérdidas en un 70% en T3
comparado con T2 en el global de las tres campañas de la cebada, aunque en ambos
tratamientos se aplicó la misma dosis de fertilizante en este periodo.

Capítulo 3
116
Estos resultados indican que la aplicación de dosis de N por encima del máximo legal
permitido por la Directiva de nitratos en ZVN (EEC, 1991), incrementa las pérdidas de N
respecto a cuándo se aplican sólo 170 kg N ha-1 año-1. Si estas pérdidas son atribuidas a
la lixiviación de NO3--N a las aguas subterráneas o bien por volatilización de amoníaco
se incrementaría el riesgo de contaminación medioambiental. Sin embargo, si estas
pérdidas de N son debido al NH4+-N inmovilizado y fijado en las arcillas, este N podría
estar disponible para el siguiente cultivo de la rotación en sistemas de doble cultivo en
condiciones subhúmedas mediterráneas (Schröder, 2005).
4.3 Calidad forrajera
El tratamiento de fertilización tuvo un efecto positivo en el contenido en PB y PD.
El contenido en proteína es uno de los criterios más importantes para la evaluación de la
calidad forrajera de la MS (Assefa and Ledin, 2001). El incremento del contenido en PB
con la fertilización nitrogenada ha sido publicado en numerosos estudios (Gillen and
Berg, 1998; Guevara et al., 1997; Rostamza et al., 2011). Los niveles más altos de PB,
tanto en cebada como en sorgo se alcanzaron en el tratamiento T3 (330 kg N ha-1 año-1).
En cebada, en los tres años de experimento, el contenido de PB en T3 fue
aproximadamente un 11 y un 17% superiores a los obtenidos en T2 y T1, respectivamente.
El contenido de PB obtenido en el presente estudio fue más bajo que el publicado por
González García et al. (2016) (125 g kg-1 MS). De manera similar, en el sorgo, la media
total de PB obtenida durante los tres años experimentales en T3 fue aproximadamente un
11 y 16% más alta que la alcanzada en T2 y T1, respectivamente. En el sorgo los niveles
máximos de PB alcanzados (82.7 g kg-1 MS) fueron más altos que los obtenidos por
Marsalis et al. (2010) (72 g kg-1 MS). Sin embargo, fueron considerablemente más bajos
que los alcanzados por Restelatto et al. (2014) (158 g kg-1 MS).

Fertilización con purín en un doble cultivo de cebada y sorgo
117
En el global del experimento, teniendo en cuenta la suma de cebada y sorgo, los
niveles de PB más altos obtenidos durante los tres años del experimento fueron
alcanzados en el tratamiento T3. Por lo tanto, si únicamente se aplican las dosis permitidas
por la Directiva de nitratos de 170 kg N ha-1 año-1, podría no alcanzarse el % de PB que
se lograría si se aplicaran dosis más altas, teniendo en cuenta que en los sistemas de doble
cultivo los requerimientos de N son más elevados que cuando sólo se siembra un cultivo
por año.
5. Conclusiones
En este experimento de tres años de duración, de un sistema de doble cultivo anual
con cebada y sorgo, el rendimiento de MS en la cebada fue muy variable dependiendo de
las condiciones climáticas durante su ciclo de cultivo. Además, varió significativamente
entre tratamientos dependiendo de la dosis de fertilizante aplicado. Contrariamente, en el
sorgo, las producciones fueron similares a lo largo del experimento, y el rendimiento no
varió significativamente entre los tratamientos que recibieron N en forma de purín de
cerdo.
Las pérdidas de N fueron afectadas significativamente por la dosis de fertilización.
El efecto residual del purín aplicado en el sorgo, provocó un incremento del 70% de las
pérdidas de N en la cebada.
La mayoría de los parámetros de calidad forrajera analizados no fueron afectados por
la dosis de fertilización nitrogenada. Sin embargo, el contenido de PB y la PD dependió
de la dosis de fertilización, incrementándose significativamente cuando se aplicaron 330
kg N ha-1 año-1.
La aplicación de N, en forma de purín de cerdo, a dosis superiores a las legalmente
permitidas por la Directiva de nitratos, mejoró tanto el rendimiento de MS como la calidad

Capítulo 3
118
del forraje obtenido, en cuanto a PB y PD. Sin embargo, la aplicación de estas dosis más
altas originó mayores pérdidas de N, bien por lixiviación de nitratos y volatilización o
bien por inmovilización del N de la materia orgánica del purín aplicado.
6. Referencias
Amon, B.V., Kryvoruchko, T., Amon, S., Zechmeister-Boltenstern, S., 2006. Methane,
nitrous oxide and ammonia emissions during storage and after application of dairy
cattle slurry. Agric. Ecosyst. Environ. 112, 153-162.
APHA, 2012. Nitrogen (ammonia): 4500-NH3 B, preliminary distillation step and 4500-
NH3 C, titrimetric method. In: Rice, E.W., Bridgewater, L. (Eds.), Standard Methods
for the Examination of Water and Wastewater, second ed. American Public Health
Association, American Water Works Association, Water Environment Federation,
Washington, D.C, pp. 110-111.
Assefa, G., Ledin, I., 2001. Effect of variety, soil type and fertilizer on the establishment,
growth, forage yield, quality and voluntary intake by cattle of oats and vetches
cultivated in pure stands and mixtures. Anim. Feed Sci. Technol. 92, 95-111.
Association of Official Analytical Chemists (AOAC), 1980. Official Methods of
Analysis, 11th ed. AOAC, Washington, DC, p. 125.
Berenguer, P., Santiveri, F., Boixadera, J., Lloveras, J., 2009. Nitrogen analysation of
irrigated maize under Mediterranean conditions. Eur. J. Agron. 30, 163–171.
Borrelli, L., Castelli, F., Ceotto, E., Cabassi, G., Tomasoni, C., 2014. Maize grain and
silage yield and yield stability in a long-term cropping system experiment in
Northern Italy. Eur. J. Agron. 55, 12-19.
Brye, K.R., Norman, J.M., Gower, S.T., Bundy, L.G., 2003. Methodological limitations
and N-budget differences among a restored tallgrass prairie and maize
agroecosystems. Agric. Ecosyst. Environ. 97, 181–198.

Fertilización con purín en un doble cultivo de cebada y sorgo
119
Cavalli, D., Cabassi, G., Borrelli, L., Geromel, G., Bechini, L., Degano, L., Marino
Gallina, P., 2016. Nitrogen fertilizer replacement value of undigested liquid cattle
manure and digestates. Eur. J. Agron. 73. 34–41.
Cela, S., Santiveri, F., Lloveras, J., 2011. Optimum nitrogen fertilization rates for second-
year corn succeeding alfalfa under irrigation. Field Crops Res. 123, 109-116.
Demurtas, C.E., Seddaiu, G., Ledda, L., Cappai, C., Doro, L., Carletti, A., Roggero, P.P.,
2016. Replacing organic with mineral N fertilization does not reduce nitrate leaching
in double crop forage systems under Mediterranean conditions. Agric. Ecosyst.
Environ. 44, 78–86.
EEC, 1991. Council Directive of 12 December 1991 concerning the protection of
waters against pollution caused by nitrates from agricultural sources. Off. J. Eur.
Commun., 91/676/EEC.
Ejeta, G., Knoll, K.E., 2007. Marker-assisted selection in sorghum. R.K. Varshney, R.
Tuberosa (Eds.), Genomics-Assisted Crop Improvement, springer, Netherlands.
187–205.
Eurostat. 2015. Number of pigs. European Comission, Luxembourg.
http://ec.europa.eu/eurostat/statistics-explained/index.php/Main_Page.
Faostat. 2013. Organización de las Naciones Unidas para la alimentación y la agricultura.
Dirección de estadística http://faostat3.fao.org/download.
Gillen, R.L., Berg, W.A., 1998. Nitrogen fertilization of a native grass planting in
Western Oklahoma. J. Range Manage. 51, 436-441.
Giola, P., Basso, B., Pruneddu, G., Giunta, F., Jones, J.W., 2012. Impact of manure and
slurry applications on soil nitrate in a maize–triticale rotation: field study and long
term simulation analysis. Eur. J. Agron. 38, 43–53.

Capítulo 3
120
González García, S. Baucells, F., Feijoo, G., Moreira, M.T., 2016. Environmental
performance of sorghum, barley and oat silage production for livestock feed using
life cycle assessment. Resources, conservation, and recycling 111, 28-41.
Grignani, C., Zavattaro, L., Sacco, D., Monaco, S., 2007. Production, nitrogen and carbon
balance of maize-based forage systems. Eur. J. Agron. 26, 442-453.
Guevara, J.C., Cavagnaro, J.B., Estevez, O.R., Le Houérou, H.N., Stasi, C.R., 1997.
Productivity, management and development problems in the arid rangelands of the
central Mendoza plains (Argentina). J. Arid Environ. 35, 575-600.
Guo, R., Li, X., Christie, P., Chen, Q., Zhang, F., 2008. Seasonal temperatures have more
influence than nitrogen fertilizer rates on cucumber yield and nitrogen uptake in a
double cropping system. Environ. Pollut. 151, 443–451.
Hartmann, T.E., Yue, S., Schulz, R., Chen, X., Zhang, F., Müller, T., 2014. Nitrogen
dynamics, apparent mineralization and balance calculations in a maize – wheat
double cropping system of the North China Plain. Field Crops Res. 160, 22–30.
Isidoro, D., Quílez, D., Aragüés, R., 2006. Environmental impact of irrigation in La
Violada District (Spain): II. Nitrogen fertilization and nitrate export patterns in
drainage water. J. Environ. Qual. 35, 776-785.
Kempers, A. J., 1974. Determination of sub- microquantities of ammonium and nitrates
in soils with fenol, sodium nitroprusside and hypochlorite. Geoderma 12, 201–206.
Liu, X., Ju, X., Zhang, F., Pan, J., Christie, P., 2003. Nitrogen dynamics and budgets in a
winter wheat–maize cropping system in the North China Plain. Field Crops Res.
83, 111–124.
López-Bellido, R.J., López-Bellido, L., 2001. Efficiency of nitrogen in wheat under
Mediterranean conditions: effect of illage, crop rotation and N fertilization. Field
Crops Res. 71, 31-46.

Fertilización con purín en un doble cultivo de cebada y sorgo
121
López-Bellido, L., López-Bellido, R.J., Castillo, J.E., López-Bellido, F.J. 2001b. Effects
of long-term tillage, crop rotation and nitrogen fertilization on bread-making quality
of hard red spring wheat. Field Crops Res. 72, 197–210.
MAGRAMA, 2015. Anuario de estadística. Available at:
http://www.magrama.gob.es/es/estadistica/temas/estadisticasagrarias/ganaderia/en
cuestas-ganaderas/#para4 (verified 11.10.16).
Marsalis, M., Angadi, S., Contreras-Govea, F., 2010. Dry matter yield and nutritive value
of corn, forage sorghum, and BMR forage sorghum at different plant populations
and nitrogen rates. Field Crop Res. 116, 52-57.
Mosier, A.R., Kroeze, C., Nevison, C., Oenema, O., Seitzinger, S., Van Cleemput, O.,
1998. Closing the global N2O budget: nitrous oxide emissions through the
agricultural nitrogen cycle. Nutr. Cycl. Agroecosyst. 52, 225-248.
Ndegwa, P.M., Hristov, A.N., Arogo, J., Sheffield, R.E., 2008. A review of ammonia
emission mitigation techniques for concentrated animal feeding operations. Biosyst.
Eng. 100, 453-469.
Nevens, F., Reheul, D., 2005. Agronomical and environmental evaluation of a long-term
experiment with cattle slurry and supplemental inorganic N applications in silage
maize. Eur. J. Agron. 22, 349–361.
Pardo, G., Cavero, J., Aibar, J., Zaragoza, C., 2009. Nutrient evolution in soil and cereal
yield under different fertilization type in dryland. Nutr. Cycling Agroecosyst
84, 267–279.
Perramon, B., Bosch-Serra, A.D., Domingo, F., Boixadera, J., 2016. Organic and mineral
fertilization management improvements to a double-annual cropping system under
humid Mediterranean conditions. Eur. J. Agron. 76, 28–40.

Capítulo 3
122
Petersen, S.O., Miller, D.N., 2006. Perspective greenhouse gas mitigation by covers on
livestock slurry tanks and lagoons. J. Sci. Food Agric. 86, 1407-1411.
Qiu, S., Ju, X., Lu, X., Li, L., Ingwersen, J., Streck, T., Christie, P., Zhang, F., 2012.
Improved nitrogen management for an intensive winter wheat/summer maize
double-cropping system. Soil Sci. Soc. Am. J. 76, 286–297.
Ramazanzadeh, S., Asgharipour, M., 2011. Physiological growth responses of sorghum
genotypes to impairment of plant photosynthesis using potassium iodide. Aust. J.
Basic Appl. Sci. 5, 1884–1890.
Reddy, B., Ashok, K.A., Sanjana, R.P., 2008. Genetic improvement of sorghum in the
semi-arid tropics. Sorghum Improvement in the New Millennium. International
Crops Research Institute for the Semi-Arid Tropics 105–123.
Reddy, B.V., Ramesh, S., Reddy P.S., Kumar, A.A., 2009. 3 genetic enhancement for
drought tolerance in sorghum. Plant Breeding Reviews 31, 189.
Restelatto, R., Pavinato, P.S., Sartor, L.R., Paixão, S.J., 2014. Production and nutritional
value of sorghum and black oat forages under nitrogen fertilization. Grass Forage
Sci. 68, 1-12.
Rostamza, M., Chaichi, M.R., Jahansouz, M.R., Alimadadi, A., 2011. Forage quality,
water use and nitrogen utilization efficiencies of pearl millet (Pennisetum
americanum L.) grown under different soil moisture and nitrogen levels. Agric.
Water Manage. 98, 1607-1614.
Sakamoto, N., Tani, M., Umetsu, K., 2006. Effect of novel covering digested dairy slurry
store on ammonia and methane emissions during subsequent storage. Int. Congr.
Ser. 1293, 319-322.

Fertilización con purín en un doble cultivo de cebada y sorgo
123
Salmerón, M., Cavero, J., Quílez, D., Isla, R., 2010. Winter cover crops affect
monoculture maize yield and nitrogen leaching under irrigated Mediterranean
conditions. Agronomy J. 102, 1700-1709.
Schröder, J. 2005. Revisiting the agronomic benefits of manure: a correct assessment and
exploitation of its fertilizer value spares the environment. Bioresour. Technol. 96,
253–261.
Sexton, B. T., Moncrief, J.F., Rosen, C.J., Gupta, S.C., Cheng, H.H., 1996. Optimizing
nitrogen and irrigation inputs for corn based on nitrate leaching and yield on a
coarse-textured soil. J. Environ. Qual. 25, 982–992.
Shang, Q., Gao, C., Yang, X., Wu, P., Ling, N., Shen, Q., Guo, S., 2014. Ammonia
volatilization in Chinese double rice-cropping systems: a 3-year field measurement
in long-term fertilizer experiments. Biol. Fertil. Soils 50, 715–725.
Sieling, K., Ni, K., Kage, H., 2014. Application of pig slurry-First year and residual
effects on yield and N balance. Eur. J. Agron. 59, 13–21.
Tomasoni, C., Borrelli, L., Ceotto, E., 2011. Effect of integrated forage rotation and
manure management on yield, nutrient balance and soil organic matter. Ital. J.
Agron. 6, 55–60.
Trindade, H., Coutinho, J., Jarvis, S., Moreira, N., 2009. Effects of different rates and
timing of application of nitrogen as slurry and mineral fertilizer on yield of herbage
and nitrate-leaching potential of a maize/Italian ryegrass cropping system in north-
west Portugal. Grass Forage Sci. 64, 2-11.
Tuinstra, M., Grote, E., Goldsbrough, P., Ejeta, G., 1997. Genetic analysis of post-
flowering drought tolerance and components of grain development in Sorghum
bicolor (L.) Moench. Mol. Breed 3, 439–448.

Capítulo 3
124
USEPA, 1992. United States Environmental Protection Agency. Method 6010A.
Inductively coupled plasma-atomic emission spectroscopy. Kovar. J.K. Chapter 6.
methods of determination of P, K, Ca, Mg and others trace elements. In: Peters, J.
(Ed.), Recommended Methods of Manure Analysis. Publ. A3769. Univ. of
Wisconsin-Extension, Madison, WI.
Vanderlip, R. L., 1993. How a sorghum plant develops? Rev. version. Manhattan, KS.
Cooperative Extensión Service, Kansas State University. 20 p.
Yagüe, M.R., Quílez, D., 2010. Response of maize yield, nitrate leaching, and soil
nitrogen to pig slurry combined with mineral nitrogen. J. Environ. Qual. 39, 686–
696.
Yagüe, M.R., Quílez, D., 2013. Residual effects of fertilization with pig slurry: double
cropping and soil. Agron. J. 105, 70–78.
Yagüe, M.R., Quílez, D., 2015. Pig slurry residual effects on maize yields and nitrate
leaching: a study in lysimeters. Agron. J. 107, 278–286.
Zadoks, J.C., Chang, T.T., Konzak, C.F., 1974. A decimal code for the growth stages of
cereals. Weed Res. 14, 415–421.
Zavattaro, L., Monaco, S., Sacco, D., Grignani, C., 2012. Options to reduce N loss from
maize in intensive cropping systems in Northern Italy. Agric. Ecosyst. Environ. 147,
24–35.

CAPÍTULO 4
LA VOLATILIZACIÓN DE AMONIACO TRAS LA FERTILIZACIÓN
CON PURÍN DE CERDO EN CONDICIONES MEDITERRÁNEAS


127
CAPÍTULO 4
LA VOLATILIZACIÓN DE AMONIACO TRAS LA
FERTILIZACIÓN CON PURÍN DE CERDO EN CONDICIONES
MEDITERRÁNEAS
Palabras clave: pérdidas de Nitrógeno, aplicación de purín, volatilización de amoniaco,
cámaras abiertas semiestaticas.
Abreviaturas:
CIC: capacidad de intercambio catiónico
MS: materia seca
NH3: amoniaco
NH4+: amonio
NAT: nitrógeno amónico total
RESUMEN
El uso de purín de cerdo como fuente de nutrientes para el cultivo se está
incrementando en áreas donde la densidad ganadera es alta, debido a su bajo coste. Sin
embargo, la aplicación del purín puede causar pérdidas de amoníaco (NH3), generando
baja eficiencia en el uso del nitrógeno por los cultivos, así como impactos ambientales en
el medio. El objetivo de este estudio de campo fue evaluar el efecto de diferentes
estrategias de fertilización con purín sobre las pérdidas de N debidas a la volatilización
del NH3. Las mediciones se realizaron durante los cinco días posteriores a la aplicación
de cobertera y fondo, respectivamente, durante una campaña de doble cultivo de cebada
y sorgo. Se analizaron 3 dosis de N; 80 kg N ha-1 en forma de purín, en la aplicación de
cobertera y 170 y 250 kg N ha-1 en la de fondo. Las pérdidas de NH3-N acumuladas
durante los días posteriores a la cobertera y fondo fueron del 38.2 y 51.3% de nitrógeno
amónico total (NAT) aplicado, respectivamente. En la aplicación de fondo las pérdidas

Capítulo 4
128
acumuladas de NH3-N cuando se aplicaron 250 kg N ha-1 fueron un 37% mayores
respecto a cuándo sólo se aplicaron 170 kg N ha-1. La época de aplicación del fertilizante
afectó a la diferencia en la volatilización de cada periodo, ya que las pérdidas de NH3-N
en la aplicación de fondo fueron aproximadamente un 34% superiores respecto a las
emisiones durante la aplicación de cobertera. En ambas aplicaciones, la mayoría del NH3-
N perdido por volatilización ocurrió en las primeras 24 horas. La incorporación del purín,
efectuada tras las primeras 24 horas posteriores a la aplicación de fondo, podría no ser
efectiva en su objetivo de reducir las emisiones de NH3.
1. Introducción
La volatilización del amoníaco (NH3) es una de las vías principales de la pérdida de
N del fertilizante nitrogenado aplicado a los sistemas suelo-cultivo (Ma et al., 2010). Estas
pérdidas pueden resultar en reducciones significativas de su valor como fuente de N y en
escasa eficiencia de uso de nitrógeno por los cultivos (Bouwman et al., 2002; Rochette et
al., 2008). Este NH3 también actúa como un contaminante atmosférico que puede tener
un efecto perjudicial sobre el medio ambiente, ya que la deposición de NH3 atmosférico
en ambientes sensibles al N puede conducir a la acidificación del suelo y a la eutrofización
de las aguas superficiales (Schulze et al., 1989). La agricultura es el principal sector
responsable de las emisiones de NH3 a la atmósfera, que representaron un 94% del total
de emisiones europeas en 2011 (EEA, 2013). La aplicación agrícola de purines ganaderos
contribuye entre el 30% y el 50% de las emisiones totales en los países europeos para
sistemas de estiércol líquido (Reidy et al., 2008), que representan más de la mitad de la
producción de estiércol en la mayoría de los países de Europa Central (Menzi, 2002). En
las zonas donde se producen altos

La volatilización de amoniaco tras la fertilización con purín
129
volúmenes de purín de cerdo, la solución más barata para su disposición es utilizarlo como
fertilizante agrícola (Bosch-Serra et al., 2015). En estos purines, el N amoniacal es la
forma predominante, representando el 65-70% del N total (Yagüe et al., 2012). En el NE
de España, donde las densidades de ganado intensivo son altas y las aplicaciones de purín
en los cultivos son frecuentes, existe una gran necesidad de reducir las emisiones de NH3.
La volatilización de NH3 a partir del fertilizante nitrogenado aplicado en superficie
es influida por muchas características del suelo que interactúan con factores climáticos y
por lo tanto son de difícil predicción (McGinn y Janzen, 1998). Concretamente, la
volatilización de NH3 depende de las características del purín aplicado (pH, MS,
concentración de amonio, etc.) de las condiciones atmosféricas (temperatura del aire,
velocidad del viento, humedad, eventos de lluvia...), las características del cultivo (índice
de área foliar, altura…) y de las características del suelo (pH, CIC, etc.) (Ferguson y
Kissel, 1986; Clay et al., 1990; Sommer y Christensen, 1992; Sommer y Hutchings,
2001).
Se han empleado diferentes técnicas para medir la pérdida de NH3 de fertilizantes
nitrogenados aplicados en suelos agrícolas (Misselbrook et al., 2005a; McGinn y Janzen,
1998; Cabrera et al., 2001; Pacholski et al., 2006) y todas tienen alguna limitación
(Sintermann et al., 2011). Las técnicas de medición pueden clasificarse según la escala
de medida (laboratorio, parcelas pequeñas, escala de campo) o por el método utilizado
(balance de N, cámara cerrada, cámara abierta, métodos micrometeorológicos) (Sanz et
al., 2010). Los métodos micrometeorológico (directo) y de balance 15N (indirecto)
permiten estimaciones absolutas de la pérdida de N-NH3 en el campo debido a que no
perturban el entorno superficial (McGinn y Janzen, 1998; Misselbrook et al., 2005a). Hoy
en día, los métodos micrometeorológicos y de túnel de viento son comúnmente utilizados
y se consideran como los más precisos (Denmead, 1983; Sommer et al., 1995). Sin

Capítulo 4
130
embargo, al evaluar los efectos de la dosis de N sobre las emisiones de NH3 en ensayos
de campo con varios tratamientos y repeticiones, estos métodos micrometeorológicos no
pueden ser utilizados satisfactoriamente. En estos casos, son más utilizadas las cámaras
semiestáticas, ya que se adaptan fácilmente a las parcelas pequeñas, permiten monitorear
tratamientos múltiples en la misma campaña de cultivo, tienen un bajo coste y requieren
reactivos y materiales comúnmente disponibles (Grant et al., 1996). Sin embargo, las
estimaciones absolutas de la pérdida de N-NH3 pueden ser subestimadas (Pozzi et al.,
2012) porque según Søgaard et al. (2002) la velocidad del viento aumenta, en un 4% por
m/s, la volatilización total de NH3. Recientemente, Araujo et al. (2009) y Jantalia et al.
(2012) han desarrollado una cámara abierta semiestática simple, con movimiento de aire
libre en el interior.
En Cataluña (NE de España) hay una concentración de alrededor del 27% (7,7
millones de cerdos) de la cabaña porcina en España (MAGRAMA, 2015). En los cultivos
de esta región, el purín de cerdo en fondo (antes de la siembra del cultivo de verano) se
aplica generalmente mediante una cuba con plato esparcidor en abanico. En el cereal de
invierno, la aplicación de cobertera en bandas, mediante una cuba de tubos colgantes, ha
comenzado a utilizarse en España como una estrategia para reducir los costes de
fertilización y como un intento de mejorar el manejo del purín a lo largo del año,
dividiendo en dos periodos las dosis de aplicación (Bosch-Serra et al., 2014).
Existen algunos estudios relacionados con la evaluación del uso de purines de cerdo
en cereales de invierno; Petersen (1996) y Sieling et al. (1998) estudiaron la eficiencia
del uso del N, Sommer et al. (1997) y Meade et al. (2011) midieron las pérdidas de NH3
en el ahijamiento bajo condiciones climáticas del norte de Europa. En las zonas
mediterráneas, la información sobre las emisiones de amoníaco es escasa (Génermont y
Cellier, 1997; Morvan et al., 1997; Sanz et al., 2010; Yagüe y Bosch-Serra, 2013). En

La volatilización de amoniaco tras la fertilización con purín
131
condiciones semiáridas mediterráneas, hay poca información sobre la volatilización de
NH3 después de la aplicación de diferentes estrategias de fertilización teniendo en cuenta
la aplicación de fondo y cobertera (Ovejero et al., 2013, 2014; Bosch-Serra et al., 2014).
No hay información disponible en la bibliografía referente a la volatilización de NH3 en
las zonas mediterráneas subhúmedas cuando se utilizan diferentes dosis de fertilizantes
nitrogenados en sistemas de doble cultivo.
El objetivo de este estudio fue evaluar y cuantificar las pérdidas de volatilización de
N-NH3 después de la aplicación de diferentes dosis de fertilización con purín de cerdo en
un sistema de doble cultivo anual en condiciones subhúmedas de secano.
2. Material and métodos
2.1 Localización del experimento
Este estudio se realizó en Torelló, en el norte de Cataluña, España (42 ° 02 '01 "N,
02 ° 15' 12" E, altitud 485 m) y se incluyó en el experimento de larga duración sobre dosis
de fertilización con purín de cerdo, que se ha descrito en los capítulos anteriores. El suelo
donde se ubicó el ensayo es un suelo franco-arcilloso bien drenado, pH básico (8,3 suelo:
agua, 1: 2,5). La capa principal del suelo (0-0,30 m) tiene un contenido bajo de materia
orgánica (<2%), no es salina (conductividad eléctrica, 1: 5 p / v, 0,22 dS/m), la CIC es
baja (7,7 cmol/kg) y tiene un contenido de carbonato cálcico cercano al 25%. La región
tiene un clima mediterráneo subhúmedo, con una temperatura media de 13.1 ° C y una
precipitación de 651 mm/año (promedio para 1985-2006). Los datos de pluviometría y
temperatura fueron registrados por la estación meteorológica automática de Torelló
cercana al campo experimental.

Capítulo 4
132
2.2 Diseño experimental
El experimento se llevó a cabo durante la cobertera de la cebada (Hordeum vulgare
L.) de 2014/15 y durante la aplicación de fondo del cultivo del sorgo (Sorghum bicolor
L.) de 2015. Para ello, a partir del diseño experimental descrito en los capítulos anteriores,
se utilizaron las parcelas que recibían la dosis correspondiente según fuera fondo o
cobertera. Las dosis y tratamientos de fertilización nitrogenada aplicados en forma de
purín de cerdo (P), tanto en la aplicación de cobertera (80 kg N ha-1) como en la de fondo
(170 y 250 kg N ha-1), se detallan en la Tabla 1. Las parcelas control fueron elegidas entre
aquellas que no habían recibido purín de cerdo a lo largo del ensayo de larga duración
comentado anteriormente. El tamaño de las parcelas fue de 480 m2 (12 m de ancho y 40
m de largo). El purín se recogió de una granja de cerdos de engorde situada cerca del
campo experimental y se aplicó en las parcelas en bandas mediante una cuba de tubos
colgantes. El contenido de N del purín fue determinado a partir de la conductividad
eléctrica del purín de la cuba. Después, se ajustó la velocidad del tractor para aplicar los
kg de nitrógeno que corresponden a cada tratamiento. El purín se aplicó en otoño, antes
de la siembra del sorgo, y fue incorporado en el suelo (15 cm) mediante un cultivador
chisel a las 24 h después de la aplicación. En febrero, el purín se aplicó antes del
ahijamineto de la cebada y no se enterró.
Tabla 1. Dosis de NH4+-N y N total aplicado en cobertera y en fondo en los diferentes
tratamientos de fertilización.
Tratamiento Dosis teórica
(kg N ha-1) MS (%) Cobertera 05/03/2015 Fondo 28/06/2015
NH4
+-N
(kg ha-1)
N total
(kg ha-1) NH4
+-N
(kg ha-1)
N total
(kg ha-1)
P80 80 6,6 64,7 110,4
P170 170 1,6 123,6 181,1
P250 250 1,4 153,4 225,5

La volatilización de amoniaco tras la fertilización con purín
133
2.3 Análisis de purín y humedad del suelo.
El contenido de NH4+-N y N total del purín se determinó en el laboratorio mediante
el método Kjeldahl. La dosis efectiva de N aplicada, se calculó a partir del peso de las
cubas antes y después de su aplicación sobre cada parcela.
Se obtuvieron muestras de suelo de dos puntos de la capa superficial (0-5 cm) en
cada fecha de muestreo y en el momento de la aplicación. Las muestras se recogieron
cerca de cada cámara de captación de amoníaco para analizar el cambio en la humedad.
En cada parcela se obtuvo una sola muestra compuesta para cada tratamiento. El
contenido de humedad volumétrica en el suelo se determinó mediante el método
gravimétrico (Campbell and Mulla, 1990), después de secarse en una estufa de aire
forzado a 105 ºC a peso constante.
2.4 Estimación de la volatilización de NH3
La cuantificación del N volatilizado se realizó utilizando el método de las cámaras
semiestáticas abiertas diseñadas por Araújo et al. (2009). Con esta técnica, el NH3 es
capturado por una cámara que consiste en un recipiente de tereftalato de polietileno (PET)
de 2 litros con el fondo cortado (Figura 1). La cámara tenía 25 cm de longitud y 10 cm de
diámetro. El fondo cortado se colocó con alambres unos 2 cm por encima de la parte
superior del recipiente para evitar la entrada del agua de lluvia. El interior de la cámara
tenía libre circulación de aire y una banda de esponja de poliuretano de 2,5 cm de ancho
por 25 cm de largo y 2 mm de espesor, suspendida verticalmente (Jantalia et al., 2012)
(Figura 1). El extremo inferior de la esponja se introdujo en un recipiente de plástico que
contenía 50 ml de una solución de ácido fosfórico al 10 % + glycerol al 4 % para mantener
la esponja humedecida y así capturar el amoníaco emitido por la superficie del suelo
(Figura 2). En cada parcela, se colocaron dos cámaras semiestáticas en la superficie del

Capítulo 4
134
suelo inmediatamente después de la aplicación del fertilizante y permanecieron en el
mismo lugar durante todo el periodo experimental (5 días). Los muestreos se realizaron a
las 5, 24, 48, 72, 96 y 120 h después de la aplicación de fertilizante.
Figura 1. Representación esquemática de las partes de la cámara abierta utilizada para medir el
NH3. Fuente Jantalia et al., 2012.
Figura 2. Cámara semiestática-abierta colocada en la parcela.

La volatilización de amoniaco tras la fertilización con purín
135
2.5 Muestreo y proceso de extracción del NH3
En los muestreos, las esponjas de cada botella se introdujeron en un recipiente de
plástico con 50 ml de cloruro potásico (KCl) 1M y a su vez fueron reemplazadas por una
esponja nueva. Una vez en el laboratorio, cada muestra (esponja + KCl 1 M) se agitó
durante 30 segundos, se filtró y se transfirió a unos recipientes de 150 ml. Los recipientes
de plástico, con la esponja en su interior, se volvieron a agitar y a lavar con 50 ml de KCl
1M dos veces más, para extraer el amonio contenido en las esponjas. De cada muestra se
determinó el contenido de N-NH3 por colorimetría mediante un espectrofotómetro. La
cantidad de N recuperada en la esponja y el recipiente se multiplicó por un factor de
corrección de 1,74 para estimar la volatilización real de NH3 de acuerdo con Alves et al.
(1994). La concentración de amoníaco puede expresarse como un flujo de emisión y
representada en el tiempo. El NH3 volatilizado captado por las esponjas se expresó como
pérdida acumulada de N-NH3 con el tiempo (kg N- NH3 ha-1) y cómo % de nitrógeno
amoniacal total (NAT) aplicado.
2.6 Análisis estadístico
Para determinar el efecto de la aplicación de purín de cerdo en las emisiones
acumuladas de NH3-N, así como en el porcentaje de NH3-N volatilizado según el NH4+-
N aplicado se llevó a cabo un análisis ANOVA de un factor (P<0,05). Los análisis
estadísticos de los resultados se realizaron utilizando el software estadístico IBM SPSS
para Windows, versión 23.0 (IBM Corp., Armonk, NY, EE.UU.).
3. Resultados y discusión
En la Figuras 3 y 4 se presenta el contenido de humedad en el suelo y la temperatura
media del aire, respectivamente, durante la fertilización de fondo y de cobertera. Durante
el periodo que duró el experimento no hubo precipitaciones, sin embargo, durante el

Capítulo 4
136
periodo de aplicación del fertilizante de cobertera (marzo), hubo días con niebla
principalmente al amanecer. Estos eventos de niebla no se consideraron relevantes en la
emisión acumulada de NH3-N. En cuanto a las temperaturas registradas durante los días
de muestreo se destaca una gran amplitud térmica (~20 ºC) en ambos muestreos, muy
común en climas mediterráneos continentales. Durante la aplicación de cobertera,
coincidiendo con el día de la aplicación, se registró una temperatura mínima por debajo
de 0ºC.
Figura 3. Contenido de agua en el suelo (0-5 cm) durante el periodo experimental en cobertera
(C) y en fondo (F).
Figura 4. Temperatura del aire registrada durante el periodo experimental en cobertera y en
fondo.

La volatilización de amoniaco tras la fertilización con purín
137
3.1 Efecto de la aplicación con purín de cerdo en cobertera en la
volatilización de NH3
En el ensayo de larga duración (expuesto en los capítulos anteriores) en el que fue
incluido el presente estudio de volatilización, sólo se aplicó una dosis de purín de cerdo
en el periodo de fertilización en cobertera. Por lo tanto, sólo se pudo comparar la
diferencia en la emisión acumulada respecto del control, no realizándose comparaciones
estadísticas.
Las pérdidas de NH3-N acumuladas durante los días posteriores a la cobertera fueron
del 38,2% de NAT aplicado (22,4% del N total aplicado con la fertilización) (Tabla 2).
Este porcentaje es inferior al valor máximo (55,1% del NAT aplicado) obtenido por
Bosch-Serra et al. (2014). En un estudio similar Yagüe y Bosch-Serra (2013) obtuvieron
una volatilización en primavera, del 35% del NAT aplicado. Los valores obtenidos en
nuestro ensayo también están por debajo de los de Thompson y Meisinger (2004) que, en
una aplicación de primavera, obtuvieron unas pérdidas del 71% del NAT aplicado.
Tabla 2. Volatilización acumulada de amoniaco (kg NH3-N ha-1) y el porcentaje que representa
del N amoniacal total aplicado (NAT) en los diferentes tratamientos de fertilización nitrogenada
aplicados durante el periodo de estudio.
Periodo Tratamiento Dosis aplicada Amoniaco volatilizado
NH4+-N (kg ha-1) NH3-N (kg ha-1) % NAT aplicado
Cobertera P80 65 (110) 24,7 38,2
Fondo P170 124 (181) 57,3 46,4 P250 153 (225) 78,7 51,3
Significación ** NS
NS: no significativo. ** significativo para P<0.01.
Valores entre paréntesis indican el N total aplicado en la fertilización.
Por otro lado, está bien documentado que la mayoría de las emisiones de NH3-N en
suelos agrícolas ocurre en unos pocos días después de la aplicación del fertilizante (De
Ruijter et al., 2010; Turner et al., 2012; Tian et al., 2015). En nuestro caso, el 72,2 % de
las pérdidas ocurrió en las primeras 24 horas (Figura 5). En este sentido en las primeras
5 horas ya se habían volatilizado el 40,3% de las pérdidas totales de NH3-N en el periodo

Capítulo 4
138
de estudio (Figura 5). Estos resultados son similares a los publicados por (Mattila, 1998)
que observó que, durante las primeras horas posteriores a la aplicación, la tasa de
volatilización fue muy elevada. Según Sommer y Sherlock (1996) estas pérdidas de NH3-
N son principalmente atribuidas tanto a la elevada concentración inicial de N amoniacal
como al elevado pH de la superficie del suelo debido a la aplicación de purín. En un
experimento llevado a cabo por Menéndez et al. (2006) observaron que, alrededor del
60% de las emisiones totales de NH3- N ocurrieron en las primeras 24 horas. Thompson
et al. (1990) y Bussink et al. (1994) observaron que el 45 y 60%, respectivamente, de las
emisiones totales de NH3- N sucedieron en las primeras 24 h después de la aplicación de
purín de vaca.
3.2 Efecto de la aplicación con purín de cerdo en fondo en la volatilización
de NH3
Se encontraron diferencias significativas en la emisión acumulada de NH3-N, entre
las dos dosis aplicadas en la fertilización de fondo (Tabla 2). Sin embargo, los valores del
% de NAT fueron similares en los dos tratamientos.
Las pérdidas acumuladas totales durante el periodo experimental en el tratamiento
P250 fueron aproximadamente un 37% mayores respecto del tratamiento P170. El
porcentaje del NAT aplicado en P250 fue aproximadamente un 10% mayor que en P170.
Nuestros resultados indican que las mayores pérdidas de NH3-N fueron un 51,3 % de
NAT aplicado (35% del N total aplicado con la fertilización). Este valor es superior al
observado por Sanz et al. (2010) (22% del NAT aplicado) en un ensayo con métodos
micrometeorológicos en la parte central de España. Sin embargo, es inferior al observado
por Yagüe y Bosch-Serra (2013) en condiciones de secano semiárido del Valle del Ebro
(61% del NAT aplicado) y al obtenido por Misselbrook et al. (2005). La elevada
volatilización observada en estos estudios se puede atribuir a un alto contenido de la MS

La volatilización de amoniaco tras la fertilización con purín
139
en el purín, ya que según algunos autores (Sommer y Hutchings, 2001; Thompson y
Meisinger, 2004), un alto contenidos en la MS del purín favorece el incremento de las
emisiones de amoniaco. Sin embargo, en nuestros resultados se puede observar que el
contenido de MS, del purín aplicado durante la fertilización de fondo, fue muy bajo (Tabla
1). En este sentido, el contenido de MS de purín aplicado en cobertera fue más alto, sin
embargo, las emisiones fueron inferiores a las observadas en la aplicación de fondo. En
este caso, todo parece indicar que el factor de la temperatura resultó determinante en
cuanto a las emisiones totales acumuladas, así como en las emisiones ocurridas en las
primeras 24 horas (Thompson y Meisinger, 2004). La volatilización de NH3, desde la
superficie del suelo a la que se ha aplicado el purín, incrementa al aumentar la temperatura
(Sommer et al., 1991). La incidencia de este factor puede resultar muy importante en las
aplicaciones de verano cuando las temperaturas superan fácilmente los 20 ºC. En nuestro
experimento, las altas temperaturas registradas durante la aplicación de fondo (en junio)
podrían haber incrementado las pérdidas por volatilización de NH3, por contra, las bajas
temperaturas durante la aplicación de cobertera (en marzo), podrían haber mitigado las
emisiones. Las pérdidas de NH3-N en la aplicación de fondo fueron aproximadamente un
34% superiores respecto a las emisiones durante la aplicación de cobertera. Por lo tanto,
la época de aplicación del fertilizante resulta crucial en las perdidas por volatilización, ya
que variables de gran relevancia sobre las emisiones como la temperatura y la humedad
varían estacionalmente. En este sentido y en el caso de la fertilización orgánica las
diferencias entre amoniaco volatilizado en invierno y primavera pueden llegar a ser un
50% mayores (Thompson y Meisinger, 2004).
Por otro lado, de manera similar a lo ocurrido durante la cobertera, las pérdidas
por volatilización en las primeras 5 horas fueron aproximadamente el 53% de las
emisiones totales durante el periodo de estudio. Además, si analizamos lo ocurrido en las

Capítulo 4
140
primeras 24 horas observamos que las pérdidas llegaron a ser del 94% del total emitido
durante los 5 días posteriores a la aplicación del fertilizante (Figura 6). Estas elevadas
emisiones durante este corto periodo de tiempo podrían ser explicadas en parte a que,
pasadas las 24 h fue incorporado el purín en el suelo y las pérdidas ocurridas a partir de
este momento pudieron ser consideradas insignificantes. A pesar de esto, nuestros
resultados están en concordancia con los obtenidos por otros autores; Sanz et al. (2010)
observó que la emisión dentro de las primeras 24 horas después de la aplicación del purín
fue entre el 63 y el 75% del total del NH3 volatilizado durante el periodo de medidas,
considerándose esta situación normal cuando se aplican purines en la superficie del suelo
(ej. Pain et al., 1989).
Dentro del marco legislativo del Decreto 136/09 (Generalitat de Catalunya, 2009)
se permite hasta un máximo de 2 días para efectuar la incorporación del purín en el suelo
en las aplicaciones acontecidas entre mayo y septiembre. Por lo tanto, coincidiendo con
las conclusiones a las que llegaron Yagüe y Bosch-Serra (2013), la práctica común de los
agricultores, amparada legalmente, de incorporar el purín trascurridas las primeras 24
horas y dentro de las 48 horas siguientes a la aplicación, podría no ser efectiva en la
reducción de las emisiones, debido a que un elevado porcentaje de las pérdidas de NH3-
N por volatilización podrían haber ocurrido ya trascurridas las primeras horas desde que
se aplicó.

La volatilización de amoniaco tras la fertilización con purín
141
Figura 5. Volatilización acumulada de amoniaco (kg NH3-N ha-1) durante los 5 días posteriores
a la aplicación en cobertera con purín de cerdo.
Figura 6. Volatilización acumulada de amoniaco (kg NH3-N ha-1) durante los 5 días posteriores
a la aplicación de fondo con purín de cerdo.

Capítulo 4
142
4. Conclusiones
En las condiciones experimentales de nuestro ensayo, las pérdidas de NH3-N
acumuladas durante los días posteriores a la cobertera fueron del 38,2% de NAT aplicado
(22,4% del N total aplicado con la fertilización) y en la aplicación de fondo de un 51,3 %
de NAT aplicado (35% del N total aplicado con la fertilización).
Las pérdidas de NH3-N en la aplicación de fondo fueron aproximadamente un 34%
superiores respecto a las emisiones durante la aplicación de cobertera. La época de
aplicación del fertilizante afectó a la diferencia en la volatilización de cada periodo,
debido probablemente a cambios en la temperatura.
Tanto en la aplicación de cobertera como en la de fondo, la mayoría del NH3-N
perdido por volatilización ocurrió en las primeras 24 horas, siendo estas pérdidas más
acusadas en la aplicación de fondo durante el verano. Por lo tanto, en las aplicaciones de
fondo, la incorporación del purín trascurrido ese tiempo, podría no ser efectiva en la
reducción de las emisiones de NH3.
5. Referencias
Alves, B.J.R., Santos, J.C.F., Boddey, R.M., Urquiaga, S., 1994. Métodos de
determinação do nitrogênio em solo e planta. In Hungria, M., et al. (eds.) Manual de
métodos empregados em estudos de microbiologia agrícola. Embrapa, Brasilia, D.F.,
Brasil. p. 449-469.
Araújo, E.S., Marsola, T., Miyazawa, M., Soares, L.H.B., Urquiaga, S., Boddey, R.M.,
Alves, B.J.R., 2009. Calibration of a semi-opened static chamber for the
quantification of volatilized ammonia from soil. (In Portuguese, with English
abstract.) Pesqi. Agropecu. Bras. 44, 769-776.

La volatilización de amoniaco tras la fertilización con purín
143
Bosch-Serra, A.D., Yagüe, M.R., Teira-Esmatges, M.R., 2014. Ammonia emissions from
different fertilizing strategies in Mediterranean rainfed winter cereals. Atmos.
Environ. 84, 204–212.
Bosch-Serra, A.D., Ortiz, C., Yagüe, M.R., Boixadera, J., 2015. Strategies to optimize
nitrogen efficiency when fertilizing with pig slurries in dryland agricultural systems.
Eur. J. Agron. 67, 27–36.
Bouwman, A.F., Boumans, L.J.M., Batjes, N.H., 2002. Estimation of global NH3
volatilization loss from synthetic fertilizers and animal manure applied to arable
lands and grasslands. Global Biogeochem. Cycl. 16, 8–1, 8–13.
Bussink, D.W., J.F. Huijsmans, and J.J.M.H. Ketelaars. 1994. Ammonia volatilization
from nitric-acid-treated cattle slurry surface applied to grassland. Neth. J. Agric. Sci.
42, 293–309.
Cabrera, M.L., Kissel, D.E., Davis, R.C., Qafoku, N.P., Segars, W.I., 2001. Design and
ammonia-recovery evaluation of a wind speed-sensitive chamber system. Soil Sci.
Soc. Am. J. 65, 1302–1306.
Campbell, G.S., Mulla, D.J., 1990. Measurement of soil water content and potential. In
Irrigation of Agricultural Crops. 127–141.
Clay, D.E., Malzer, G.L., Anderson, J.L, 1990. Ammonia volatilization from urea as
influenced by soil temperature, soil water content, and nitrification and hydrolysis
inhibitors. Soil Sci. Soc. Am. J. 54, 263–266.
Denmead, O.T., 1983. Micrometeorological method for measuring gaseous losses of
nitrogen in the field. In Gaseous Losses of Nitrogen from Plant-Soil Systems, 133–
157.
De Ruijter, F.J., Huijsmans, J.F.M., Rutgers, B., 2010. Ammonia volatilization from crop
residues and frozen green manure crops. Atmospheric Environment 44, 3362-3368.

Capítulo 4
144
EEA (European Environment Agency), 2013. (European Environment Agency) 2014
Ammonia (NH3) Emissions (APE 003) (Copenhagen) Assessment Published Jan
2014.
Ferguson, R.B., Kissel, D.E., 1986. Effects of soil drying on ammonia volatilization from
surface-applied urea. Soil Sci. Soc. Am. J. 50, 485–490.
Generalitat de Catalunya, 2009. DECRET 136/2009, d’1 de setembre, d’aprovació del
programa d’actuació aplicable a les zones vulnerables en relació amb la
contaminació de nitrats que procedeixen de fonts agràries i de gestió de lesdejeccions
ramaderes, DOGC 5457, 65858–65902.
Génermont, S., Cellier, P., 1997. A mechanistic model for estimating ammonia
volatilization from slurry applied to bare soil. Agric. For. Meteorol. 88, 145-167.
Gericke, D., Pacholski, A., Kage, H., 2011. Measurement of ammonia emissions inmulti-
plot field experiments. Biosyst. Eng. 108, 164–173.
Gericke, D., Bornemann, L., Kage, H., Pacholski, A., 2012. Modelling ammonia losses
after field application of biogas slurry in energy crop rotations. Water Air Soil Poll.
223, 29–47.
Grant, C.A., Jia, S., Brown, K.R., Bailey, L.D., 1996. Volatile losses of NH3 from surface
applied urea and urea ammonium nitrate with and without the urease inhibitors NBP
or ammonium thiosulphate. Can. J. Soil Sci. 76, 417-419.
Jantalia, C.P., Halvorson, A.D., Follett, R.F., Alves, B.J.R., Polidoro, J.C., Urquiaga, S.,
2012. Nitrogen source effects on ammonia volatilization as measured with semi-
static chambers. Agron. J. 104, 1595–1603.
Ma, B.L., Wu, T.Y., Tremblay, N., Deen, W., McLaughlin, N.B., Morrison, M.J.,
Stewart, G., 2010. On-farm assessment of the amount and timing of nitrogen
fertilizer on ammonia volatilization. Agron. J. 102, 134–144.
La volatilización de amoniaco tras la fertilización con purín
145
MAGRAMA, 2015. Anuario de estadística. Available at:
http://www.magrama.gob.es/es/estadistica/temas/estadisticasagrarias/ganaderia/en
cuestas-ganaderas/#para4 (verified 11.10.16).
Mattila, P.K. 1998. Ammonia volatilization from cattle slurry applied to grassland as
affected by slurry treatment and application technique-First year resorts. Nutr.
Cycling Agroecosyst. 51, 47–50.
McGinn, S.M., Janzen, H.H.. 1998. Ammonia sources in agriculture and their
measurement. Can. J. Soil Sci. 78, 139–148.
Meade, G., Pierce, K., O’Doherty, J.V., Mueller, C., Lanigan, G., Mc Cabe, T., 2011.
Ammonia and nitrous oxide emissions following land application of high and low
nitrogen pig manures to winter wheat at three growth stages. Agric. Ecosyst.
Environ. 140, 208-217.
Menéndez, S., Merino, P., Pinto, M., González-Mura, C., Estavillo, J.M., 2006. 4-
Dimethylpyrazol phosphate effect on nitrous oxide, nitric oxide, ammonia, and
carbon
dioxide emissions from grasslands. J. Environ. Qual. 35, 973–98.
Menzi, H., 2002. Manure management in Europe:results of a recent survey. In:Ven
govský, J.(Ed.). Recycling of Agricultural, Municipial and Industrial Residues in
Agriculture Ramiran 2002. University of Veterinary Medicine, Research Institute of
Veterinary Medicine, Košice, pp.93–102.
Misselbrook, T.H., Nicholson, F.A., Chambers, B.J., Johnson, R.A., 2005a. Measuring
ammonia emissions from land applied manure: An intercomparison of commonly
used samplers and techniques. Environ. Pollut. 135, 389–397.

Capítulo 4
146
Misselbrook, T.H., Nicholson, F.A. & Chambers, F.B. 2005b. Predicting ammonia losses
following the application of livestock manure to land. Bioresource Technology 96,
159–168.
Morvan, T., Leterme, P., Arsen, G., Mary, B., 1997. Nitrogen transformations after the
spreading of pig slurry on bare soil and ryegrass using 15N-labelled ammonium.
Eur. J. Agron. 7, 181-188.
Ni, K., Pacholski, A., Gericke, D., Kage, H., 2012. Analysis of ammonia losses after field
application of biogas slurries by an empirical model. J. Plant Nutr. Soil Sci. 175,
253–264.
Ovejero, J., Lampurlanés, J., Álvaro-Fuentes, J., Plaza-Bonilla, D., Cantero-Martínez, C.,
2013. Tillage and organic amendments fertilization effects on ammonia
volatilization in mediterranean dryland agroecosystems (in Spanish). Tierras de
Castilla y León. 209, 48 - 52.
Ovejero, J., Lampurlanés, J., Álvaro-Fuentes, J., Cantero-Martínez, C.,2014. Ammonia
volatilization from different organic amendments and soils management in the Ebro
Valley. (In Spanish). Interempresas Agricultura y Ganadería. 1067, 88 - 93.
Pain, B.F., Phillips, V.R., Clarkson, C.R., Klarenbeek, J.V., 1989. Loss of nitrogen
through ammonia volatilization during and following the application of pig or cattle
slurry to grassland. Journal of the Science of Food and Agriculture 47, 1–12.
Pacholski, A., Cai, G., Nieder, R., Richter, J., Fan, X., Zhu, Z., Roelcke, M., 2006.
Calibration of a simple method for determining ammonia volatilization in the field-
Comparative measurements in Henan Province, China. Nutr. Cycl. Agroecosyst. 74,
259–273.
Petersen, J., 1996. Fertilization of spring barley by combination of pig slurry and mineral
nitrogen fertilizer. J. Agric. Sci. 127, 151-159.

La volatilización de amoniaco tras la fertilización con purín
147
Pozzi, C., Halvorson, A.D., Follett, R.F., Rodrigues, B.j., Poliodoro, J.C., Urquiaga, S.,
2012. Nitrogen source effects on ammonia volatilization as measured with semi-
static chambers. Agron. J. 104, 1595-1603.
Reidy, B., Dämmgen, U., Döhler, H., Eurich-Menden, B., vanEvert, F.K., Hutch-ings,
N.J., Luesink, H.H., Menzi, H., Misselbrook, T.H., Monteny, G.-J., Webb, J., 2008.
Comparison of models used for national agricultural ammonia emission inventories
in Europe: liquid manure systems. Atmos. Environ. 42(14),3452–3464.
Rochette, P., Guilmette, D., Chantigny, M.H., Angers, D.A., MacDonald, J.D., Bertrand,
N., Parent, L.É., Côté, D., Gasser, M.O., 2008. Ammonia volatilization following
application of pig slurry increases with slurry interception by grass foliage. Can. J.
Soil Sci. 88, 585–593.
Sanz, A., Misselbrook, T., Sanz, M.J., Vallejo, A., 2010. Use of an inverse dispersion
technique for estimating ammonia emission from surface-applied slurry. Atmos.
Environ. 44, 999-1002.
Schulze, E.D., de Vries, W., Hauhs, M., Rosen, K., Rasmussen, L., Tamm, C.O., Nilsson,
J., 1989. Critical loads for nitrogen deposition on forest ecosystems. Water, Air, and
Soil Poll. 48, 451–456.
Sieling, K., Schröder, H., Hanus, H., 1998. Yield, N uptake, and apparent N-use
efficiency of winter wheat and winter barley grown in different cropping systems. J.
Agric. Sci. 131, 375-387.
Sintermann, J., Neftel, A., Ammann, C., Häni, C., Hensen, A., Loubet, B., Flechard, C.R.,
2011. Are ammonia emissions from field-applied slurry substantially overestimated
in European emission inventories?. Biogeosci. Discuss. 8, 10069-10118.

Capítulo 4
148
Søgaard, H.T., Sommer, S.G., Hutchings, N.J., Huijsmans, J.F.M., Bussink, D.W.,
Nicholson, F., 2002. Ammonia volatilization from field-applied animal slurry e the
ALFAM model. Atmos. Environ. 36, 3309-3319.
Sommer, S.G., J.E. Olesen, and B.T. Christensen. 1991. Effects of temperature, wind
speed and air humidity on ammonia volatilization from surface applied cattle slurry.
J. Agric. Sci. 117, 91–100.
Sommer, S.G., Christensen, B.T., 1992. Ammonia volatilization after injection of
anhydrous ammonia into arable soils of different moisture levels. Plant Soil 142,
143–146.
Sommer, S.G., Mikkelsen, H., Mellqvist, J., 1995. Evaluation of meteorological
techniques for measurement of ammonia loss from pig slurry. Agric. Forest
Meteorol. 74, 169–179.
Sommer, S.G., and R.R. Sherlock. 1996. pH and buffer component dynamics in the
surface layers of animal slurries. J. Agric. Sci. 127, 109–116.
Sommer, S.G., Friis, E., Bach, E., Schjorring, J.K., 1997. Ammonia volatilization from
pig slurry applied with trail hoses or broadspread to winter wheat: effects of crop
developmental stage, microclimate, and leaf ammonia absorption. J. Environ. Qual.
26, 1153-1160.
Sommer, S.G., Hutchings, N.J., 2001. Ammonia emission from field applied manure and
its reduction-invited paper. Eur. J. Agron. 15, 1–15.
Thompson, R.B., B.F. Pain, and Y.J. Rees. 1990. Ammonia volatilization from cattle
slurry following surface application to grassland. II. Influence of application rate,
wind speed and applying slurry in narrows bands. Plant Soil 125, 119-128.

La volatilización de amoniaco tras la fertilización con purín
149
Thompson, R.B., Meisinger, J.J., 2004. Gaseous nitrogen losses and ammonia
volatilization measurement following land application of cattle slurry in the mid-
Atlantic region of the USA. Plant and soil 266, 231-246.
Tian, Z., Wang, J.J. , Liu, S., Zhang, Z., Dodla, S.K., Myers, G., 2015. Application
effects of coated urea and urease and nitrification inhibitors on ammonia and
greenhouse gas emissions from a subtropical cotton field of the Mississippi delta
region. Sci.Tot. Envion. 533, 329-338.
Turner, D.A., Edis, R.E., Chen, D., Freney, J.R., Denmead, O.T., 2012. Ammonia
volatilization from nitrogen fertilizers applied to cereals in two cropping areas of
southern Australia Nutr. Cycl. Agroecosyst. 93, 113-126.
Yagüe, M.R., Bosch-Serra, A.D., Boixadera, J., 2012. Measurement and estimation of the
fertiliser value of pig slurry by physicochemical models: usefulness and contraints.
Biosyst. Eng. 111, 206–216.
Yagüe, M. R., Bosch-Serra, A. D., 2013. Slurry field management and ammonia
emissions under Mediterranean conditions. Soil Use Manage. 29, 397–400.


DISCUSIÓN GENERAL


153
DISCUSIÓN GENERAL
Bajo las condiciones subhúmedas mediterráneas de este estudio, la productividad en
el sistema de doble cultivo analizada a lo largo de esta tesis doctoral, fue
significativamente afectada por la dosis de fertilización nitrogenada en forma de purín de
cerdo. A lo largo de los nueves años de estudio, las condiciones climatológicas,
principalmente la cantidad de precipitaciones y su distribución en cada campaña de
cultivo, determinaron en gran medida el rendimiento de MS de los cultivos forrajeros que
conformaron las rotaciones utilizadas en el ensayo. La variabilidad en la producción
debido a una irregular distribución de la precipitación a lo largo del ciclo de cultivo es
muy común en sistemas de secano (Trindade et al., 2009). Este hecho pudo observarse
claramente a lo largo de los seis años de cultivo de maíz de la primera rotación entre 2006
y 2012 (Figura 1, Capítulo 1). En 2007 y 2012 (esta última campaña del maíz no fue
incluida en los análisis presentados en esta tesis) las bajas precipitaciones registradas en
el verano, durante el ciclo del cultivo del maíz, provocaron una mala nascencia del cultivo
que conllevó a que no hubiera cosecha en esos años. Por lo tanto, motivado por este hecho,
en la segunda rotación llevada a cabo entre 2012-2015 y presentada en el Capítulo 3, se
cambió el maíz por el sorgo debido a su mayor tolerancia a la sequía (Ejeta y Knoll, 2007;
Ramazanzadeh y Asgharipour, 2011) y por tratarse de un cultivo de verano habitual en la
zona de estudio. Este cambio de cultivo en la rotación tuvo un efecto positivo en cuanto
a la productividad, ya que, el rendimiento medio de todos los tratamientos fue un 10%
superior en el sorgo respecto del maíz. Sin embargo, el cambio realizado en los cultivos
de invierno fue mucho menos efectivo, debido a que el rendimiento medio fue
aproximadamente un 60 % mayor en el triticale que en la cebada. De manera general,
teniendo en cuenta la suma de los rendimientos de cada cultivo de la rotación, se ha
observado que el rendimiento medio obtenido en la rotación maíz-triticale ha sido

Fertilización con purín en sistemas de doble cultivo
154
aproximadamente un 9% mayor respecto al de la rotación cebada-sorgo principalmente
atribuido al elevado rendimiento obtenido en el triticale que fue incluso superior al del
maíz.
El rendimiento de cada cultivo se vio, en mayor o en menor medida, afectado
significativamente por la dosis de fertilización. Esta diferencia fue más notoria en la
cebada a lo largo de los tres años de cultivo, y en menor medida en el sorgo, donde sólo
hubo diferencias entre los tratamientos de fertilización y las parcelas control. A lo largo
de los nueve años de ensayo, teniendo en cuenta la suma del cultivo de invierno y de
verano, los rendimientos de MS más altos se alcanzaron cuando fueron aplicadas dosis
superiores a los 170 kg N ha-1 año-1 de fertilizante orgánico permitidos por la Directiva
de nitratos en ZVN (EEC, 1991). De manera similar a otros estudios (Trindade et al.,
2009; Yagüe et al., 2013a; Perramon et al., 2016), en sistemas de doble cultivo podría ser
factible la aplicación de dosis superiores a las permitidos por la Directiva de nitratos,
teniendo en cuenta que en estos sistemas hay una demanda mayor de N, comparado a
cuando sólo se siembra un cultivo por año.
Por otro lado, los sistemas de doble cultivo podrían mejorar la eficiencia en el uso
del N, comparado con un sistema de un cultivo anual (Zavattaro et al., 2012), lo que
podría conllevar a un incremento de la producción (Borrelli et al., 2014). En este estudio
de 9 años de duración se observó, que la eficiencia en el uso del N fue mayor en el cultivo
de invierno que en el de verano en las dos rotaciones estudiadas. Esta alta eficiencia en el
uso del N en el cereal de invierno pudo ser debida al aprovechamiento del NO3--N residual
del cereal de verano precedente, que incluye la mineralización de la materia orgánica del
purín aplicado en dicho cultivo (Yagüe y Quílez, 2013b; Hartmann et al., 2014; Sieling
et al., 2014). Similar

Discusión general
155
a lo observado por Grignani et al. (2007), el nitrato residual procedente del cereal de
verano podría ser aprovechado por el cereal de invierno en estos sistemas de doble cultivo,
lo que evitaría parcialmente el riesgo de lixiviación de nitratos. Sin embargo, este efecto
residual del purín contribuyó a que se incrementara el contenido de NO3--N del suelo en
octubre después de la cosecha del cereal de verano principalmente en la rotación maíz-
triticale. Esta acumulación de NO3--N en suelo, particularmente en los años en los que la
extracción de N por parte del maíz fue muy baja o incluso casi nula, junto con el aporte
de la fertilización realizada en fondo antes de la siembra del triticale, incrementaría el
riesgo de lixiviación de NO3--N durante el otoño e invierno si suceden fuertes episodios
de lluvia (Nevens y Reheul, 2005; Bergström y Kirchmann, 2006; Giola et al., 2012).
Este hecho motivó que, en la rotación cebada-sorgo la aplicación del purín se hiciera en
cobertera durante la época de ahijamineto del cultivo, en vez de la aplicación en fondo,
con el doble objetivo de minimizar el riesgo de lixiviación de NO3--N e incrementar la
eficiencia en el uso del N (Petersen, 1996; Jackson y Smith, 1997). En este sentido se
observó que, las pérdidas de N totales (calculadas a partir del balance de N, como N no
recuperado), teniendo en cuenta el ciclo de los dos cultivos de cada rotación, fueron
similares en las dos rotaciones analizadas en este estudio. Incluso, las pérdidas de N
fueron superiores durante el cultivo de la cebada que en el cultivo del triticale, debido
fundamentalmente a las elevadas extracciones de N del triticale y la menor extracción de
N en la cebada causada por una producción baja de MS. Este hecho también podría indicar
que, las pérdidas de N, inicialmente atribuidas en su mayor parte a la lixiviación de NO3-
-N, podrían estar causadas también, en un gran porcentaje, por la volatilización de NH3
durante las aplicaciones tanto de fondo como de cobertera, como pudimos observar en el
Capítulo 4 de esta memoria de tesis. Las pérdidas de N total en el conjunto de las dos
rotaciones, fueron significativamente afectadas por la dosis de fertilización, siendo más
Fertilización con purín en sistemas de doble cultivo
156
elevadas cuando se aplican dosis superiores a los 170 kg N ha-1 año-1 de fertilizante
orgánico permitidos por la Directiva de Nitratos en ZVN (EEC, 1991). Cuando estas
pérdidas son atribuidas a la lixiviación de NO3--N a las aguas subterráneas o bien por
volatilización de amoníaco se incrementa el riesgo de contaminación medioambiental.
Sin embargo, si estas pérdidas de N son debido al NH4+-N inmovilizado y fijado en las
arcillas, este N podría estar disponible para el siguiente cultivo de la rotación en sistemas
de doble cultivo (Sørensen y Amato, 2002; Chantigny et al., 2004; Schröder, 2005).
En referencia a la calidad forrajera, después de 9 años de aplicación continuada de
purín, el tratamiento de fertilización sólo ha mostrado un efecto positivo en el contenido
en PB y PD. No se observaron diferencias significativas entre los tratamientos de
fertilización aplicados, en el resto de los parámetros analizados. El incremento del
contenido en PB con la fertilización nitrogenada ha sido publicado en numerosos estudios
(Gillen and Berg, 1998; Rostamza et al., 2011). De manera similar a lo comentado para
el rendimiento, en el global del experimento, teniendo en cuenta la suma del cultivo de
invierno y verano en cada rotación, los niveles de proteína más altos se obtuvieron dosis
de N superiores a la permitida por la Directiva de Nitratos en ZVN (EEC, 1991).
Referencias
Bergström, L., Kirchmann, H., 2006. Leaching and crop uptake of nitrogen and phos-
phorus from pig slurry as affected by different application rates. J. Environ. Qual.
35, 1803–1811.
Borrelli,L., Castelli,F., Ceotto,E., Cabassi,G., Tomasoni, C., 2014. Maize grain and silage
yield and yield stability in a long-term cropping system experiment in Northern Italy.
Eur. J. Agron. 55, 12–19.

Discusión general
157
Chantigny, M.H., Angers, A.D., Masse, D., Morvan, T., Pomar, C., 2004. Dynamics of
pig slurry nitrogen in soil and plant as determined with 15N. Soil Sci. Soc. Am. J. 68,
637–643.
EEC, 1991. Council Directive of 12 December 1991 concerning the protection of waters
against pollution caused by nitrates from agricultural sources. Off. J. Eur. Commun.,
91/676/EEC.
Ejeta, G., Knoll, K.E., 2007. Marker-assisted selection in sorghum. R.K. Varshney, R.
Tuberosa (Eds.), Genomics-Assisted Crop Improvement, springer, Netherlands.
187–205.
Gillen, R.L., Berg, W.A., 1998. Nitrogen fertilization of a native grass planting in
Western Oklahoma. J. Range Manage. 51, 436-441.
Giola, P., Basso, B., Pruneddu, G., Giunta, F., Jones, J.W., 2012. Impact of manure and
slurry applications on soil nitrate in a maize–triticale rotation: field study and long
term simulation analysis. Eur. J. Agron. 38, 43–53.
Grignani, C., Zavattaro, L., Sacco, D., Monaco, S., 2007. Production, nitrogen and carbon
balance of maize-based forage systems. Eur. J. Agron. 26, 442–453.
Hartmann, T.E., Yue, S., Schulz, R., Chen, X., Zhang, F., Müller, T., 2014. Nitrogen
dynamics, apparent mineralization and balance calculations in a maize – wheat
double cropping system of the North China Plain. Field Crops Res. 160, 22–30.
Jackson, D.R., Smith, K.A., 1997. Animal manure slurries as a source of nitrogen for
cereals; effect of application time on efficiency. Soil Use Manage. 13, 75–81.
Nevens, F., Reheul, D., 2005. Agronomical and environmental evaluation of a long-term
experiment with cattle slurry and supplemental inorganic N applications in silage
maize. Eur. J. Agron. 22, 349–361.

Fertilización con purín en sistemas de doble cultivo
158
Perramon, B., Bosch-Serra, A.D., Domingo, F., Boixadera, J., 2016. Organic and mineral
fertilization management improvements to a double-annual cropping system under
humid Mediterranean conditions. Eur. J. Agron. 76, 28–40.
Petersen, J., 1996. Fertilization of spring barley by combination of pig slurry and mineral
nitrogen fertilizer. J. Agric. Sci. 127, 151–159.
Ramazanzadeh, S., Asgharipour, M., 2011. Physiological growth responses of sorghum
genotypes to impairment of plant photosynthesis using potassium iodide. Aust. J.
Basic Appl. Sci. 5, 1884–1890.
Rostamza, M., Chaichi, M.R., Jahansouz, M.R., Alimadadi, A., 2011. Forage quality,
water use and nitrogen utilization efficiencies of pearl millet (Pennisetum
americanum L.) grown under different soil moisture and nitrogen levels. Agric.
Water Manage. 98, 1607-1614.
Schröder, J. 2005. Revisiting the agronomic benefits of manure: a correct assessment and
exploitation of its fertilizer value spares the environment. Bioresour. Technol. 96,
253–261.
Sieling, K., Ni, K., Kage, H., 2014. Application of pig slurry-First year and residual
effects on yield and N balance. Eur. J. Agron. 59, 13–21.
Sørensen, P., Amato, M., 2002. Remineralisation and residual effects of N after
application of pig slurry to soil. Eur. J. Agron. 16, 81–95.
Trindade, H., Coutinho, J., Jarvis, S., Moreira, N., 2009. Effects of different rates and
timing of application of nitrogen as slurry and mineral fertilizer on yield of herbage
and nitrate-leaching potential of a maize/Italian ryegrass cropping system in north-
west Portugal. Grass Forage Sci. 64, 2-11.

Discusión general
159
Yagüe, M.R., Iguácel, F., Orús, F., 2013a. Fertilización con purín: resultados
agronómicos en doble cultivo anual de cebada-maíz y efecto residual en cebada
(2006-2012). Informaciones técnicas Gobierno de Aragón 213.
Yagüe, M.R., Quílez, D., 2013b. Residual effects of fertilization with pig slurry: double
cropping and soil. Agron. J. 105, 70–78.
Zavattaro, L., Monaco, S., Sacco, D., Grignani, C., 2012. Options to reduce N loss from
maize in intensive cropping systems in Northern Italy. Agric. Ecosyst. Environ. 147,
24–35.


CONCLUSIONES GENERALES


163
CONCLUSIONES GENERALES
1. En condiciones subhúmedas mediterráneas de secano, en un sistema de doble
cultivo anual, la aplicación de N, en forma de purín de cerdo, con dosis superiores
a los 170 kg N ha-1 año-1 de fertilizante orgánico permitidos por la Directiva de
nitratos en ZVN, mejoró significativamente la producción obtenida a lo largo de
los nueve años de duración del estudio.
2. Las condiciones climatológicas, principalmente la pluviometría y su distribución
en cada campaña de cultivo, determinaron, en gran medida, el rendimiento de MS
de los cultivos forrajeros que conformaron las rotaciones utilizadas en el ensayo.
3. El rendimiento medio obtenido en la rotación maíz-triticale (18.2 kg MS ha-1) fue
aproximadamente un 9% mayor respecto al de la rotación cebada-sorgo (16.8 kg
MS ha-1), principalmente atribuido al elevado rendimiento obtenido en el triticale,
que fue incluso superior al del maíz.
4. Los tratamientos de fertilización con 170 y 250 kg N ha-1 aplicados en fondo antes
del cultivo de verano tuvieron un importante efecto en el rendimiento del cereal
de invierno siguiente debido al efecto residual del purín que incrementó el
contenido de NO3--N en el suelo.
5. La eficiencia en el uso del N fue mayor en el cultivo de invierno que en el de
verano, principalmente debido al uso del NO3--N residual del cereal de verano
precedente.
6. En el global del experimento, las pérdidas de N total en ambas rotaciones fueron
significativamente afectadas por la dosis de fertilización, siendo más elevada
cuando
Fertilización con purín en sistemas de doble cultivo
164
fueron aplicadas dosis superiores a 170 kg N ha-1 año-1. La aplicación de estas
dosis (250 y 330 kg N ha-1 año-1) determinó mayores pérdidas de N, bien por
lixiviación de nitratos y volatilización o bien por inmovilización del N de la
materia orgánica del purín aplicado.
7. Después de 9 años de aplicación continuada de purín, sólo se observaron
diferencias significativas en el contenido de PB y PD, incrementando
significativamente cuando se aplicaron 330 kg N ha-1 año-1. En el resto de
parámetros de calidad forrajera analizados no hubo diferencias significativas entre
los tratamientos.
8. Las pérdidas de NH3-N en la aplicación de fondo y cobertera fueron un 35 y 22%,
respectivamente del N total aplicado. La mayoría del NH3-N perdido por
volatilización ocurrió en las primeras 24 horas, trascurrido ese tiempo, la
incorporación del purín podría no ser efectiva en la reducción de las emisiones de
NH3.
