
UNIVERSIDAD POLITÉCNICA DE VALENCIA
Departamento de Tecnología de Alimentos
Impacto del tratamiento por pulsos eléctricos de alta
intensidad y altas presiones hidrostáticas sobre la calidad y seguridad microbiológica de un alimento mezcla de
zumo de naranja y leche
TESIS DOCTORAL EUROPEA
Fernando Sampedro Parra
Valencia, Febrero 2008

El doctorando Fernando Sampedro ha disfrutado de una beca-contrato predoctoral FPU concedida por el Ministerio de Educación y Ciencia.
La presente tesis doctoral europea se engloba en los siguientes proyectos de
investigación:
Ayuda a grupos de investigación 03/147 de la Generalitat Valenciana (2003-2005).
“Optimización y validación de procesos mínimos de conservación de un nuevo alimento funcional líquido, mediante aplicación de pulsos eléctricos
de alta intensidad (PEAI), solos o con calor” del Ministerio de Ciencia y Tecnología-CICYT (2004-2006).
Ha contado con la participación de las siguientes unidades de investigación:
Laboratorio de Procesos de Conservación, Departamento de
Conservación y Calidad, Instituto de Agroquímica y Tecnología de Alimentos, Centro Superior de Investigaciones Científicas, Valencia,
España. Laboratory of Food Technology, Faculty of Applied Bioscience and
Engineering, Katholieke Universiteit Leuven, Leuven, Belgium. Food Safety Intervention Technologies Unit, Eastern Regional Research
Centre, Agricultural Research Service, United States Department of Agriculture, Wyndmoor, PA, USA.
La creciente demanda de alimentos con características lo más parecidas al producto
fresco, está impulsando el desarrollo de nuevas tecnologías “no térmicas” de conservación. Dentro de las más prometedoras se encuentran el tratamiento por Pulsos Eléctricos de Alta Intensidad (PEF) y la tecnología de Altas Presiones Hidrostáticas (HHP). Estas tecnologías permiten conservar, en mayor medida que los tratamientos térmicos, la calidad (sabor, aroma, color y vitaminas) de determinados alimentos frescos e inactivar microorganismos y enzimas, incrementando su vida útil en refrigeración y facilitando su comercialización. El objetivo general de la presente tesis doctoral ha sido el procesado por PEF y HHP solos o combinados con calor de una nueva bebida mezcla de zumo de naranja y leche incluyendo aspectos microbiológicos y de calidad. El plan de trabajo comenzó con la elaboración y caracterización físico-química y sensorial del nuevo producto eligiendo la formulación adecuada para desarrollar los estudios cinéticos y de vida útil. Los parámetros de calidad más importantes en el nuevo producto fueron la actividad enzimática y el contenido en aroma (concentración de compuestos volátiles). En el caso del zumo de naranja la pectin metil esterasa (PME) es una de las enzimas de mayor importancia. Se evaluó el efecto del tratamiento por PEF, HHP y calor en la inactivación de PME. Todas las tecnologías estudiadas lograron un nivel de inactivación enzimática del 90%. Se observó la aparición de dos fracciones con diferente resistencia al tratamiento, por ello, el modelo bifásico fue el que mejor describió las curvas de inactivación de PME mediante tratamiento combinado de HHP y calor en el producto. Posteriormente se estudió la variación en el contenido en aroma (concentración de compuestos volátiles) tras el tratamiento de HHP, PEF y calor en el producto siendo la tecnología por PEF la que mejor preservó el aroma original del producto fresco. Una vez establecidos los estudios relacionados con aspectos de calidad en el producto se realizaron los estudios microbiológicos. Se estudió la influencia de las variables del proceso por PEF en la inactivación de un microorganismo alterador (Lactobacillus plantarum) en el producto. La intensidad de campo eléctrica, tiempo de tratamiento y temperatura fueron las variables que más influyeron produciendo un aumento de la inactivación con un menor gasto energético. Más tarde, se estudiaron las cinéticas de inactivación de L. plantarum mediante la combinación de la tecnología de PEF y calor. A su vez, se eligió el modelo matemático de Weibull como el que mejor describía las curvas de supervivencia del microorganismo tras el tratamiento por PEF siendo el
parámetro tcw un índice de resistencia del microorganismo al tratamiento. Entre los
microorganismos patógenos, Salmonella typhimurium se ha demostrado como un problema de seguridad alimentaria en alimentos ácidos como el zumo de naranja por lo que se decidió estudiar
RESUMEN

sus cinéticas de inactivación por PEF en función de las características del alimento, pH y concentración de estabilizante (pectina). Una disminución del pH favoreció la inactivación mientras que el porcentaje de pectina no tuvo un efecto significativo. Finalmente se realizó un estudio de vida útil del producto en refrigeración tras el tratamiento de PEF y calor demostrando la viabilidad de la tecnología de PEF para obtener alimentos con similar vida útil que el tratamiento térmico pero con mejor calidad final.

The growing demand of food with characteristics similar to the fresh product is enhancing
the development of nonthermal preservation technologies. Among them High Hydrostatic Pressure (HHP) and Pulsed Electric Field (PEF) processing are the most promising. These technologies allow the preservation of food quality (flavor, aroma, color and vitamins) in a greater extent than thermal technology. The microbial and enzyme inactivation degree obtained through these technologies allow extending the shelf-life of the product at chilled storage facilitating its commercialization. The general objective of the present doctoral thesis was to study the PEF and HHP processing alone or combined with thermal treatment in a new beverage based on the mixture of orange juice and milk including microbiological and quality aspects. The work plan began with the preparation and physicochemical and sensorial characterization of the new product, choosing the adequate formulation for developing the kinetic and shelf-life studies. The main quality parameters in an orange juice based product were the enzyme activity and the aroma content (volatile compounds concentration). In an orange juice, pectin methyl esterase (PME) is one of the most relevant enzymes. A study of the influence of PEF, HHP and thermal processing on PME inactivation was developed. The different technologies could inactivate 90% of PME. The appearance of two fractions with different resistance to the treatment was observed and a biphasic model was used to describe PME inactivation curves by a combined HHP and thermal treatment. The study of the effect of the different processing technologies on aroma content (volatile compounds concentration) was also performed. The results revealed PEF technology as the best process to preserve the original aroma of the product. Once studies related to quality parameters were established, the microbiological aspects related to the new product were also performed. The influence of PEF processing variables on the inactivation of a spoilage microorganism (Lactobacillus plantarum) was carried out in the new product. Electric field, treatment time and temperature were the most influential variables, producing higher inactivation with lesser energy consumption. A kinetic study of PEF inactivation of L. plantarum was also developed. Weibull model was chosen as the one which best described microorganism survival curves after PEF
treatment and the tcw parameter could be considered as an index of the microorganism treatment
resistance. Within the pathogen microorganisms, it has been demonstrated that Salmonella
typhimurium could originate a food safety problem in acid foods such as orange juice. In order to study the microorganism behavior against PEF treatment a kinetic study was done based on the food characteristics such as pH and stabilizer concentration (pectin). It was found that any pH diminish favored inactivation while pectin concentration did not have a significant effect. Finally a shelf-life
SUMMARY

study after PEF and thermal treatment was carried out in the beverage stored at refrigeration temperature. The study showed the viability of PEF technology to obtain food with similar shelf-life than thermal treatment but better final product quality.

La creixent demanda d’aliments amb unes característiques pròximes als productes frescos,
està impulsant el desenvolupament de noves tecnologies “no tèrmiques” de conservació. Entre les que ofereixen més opcions de futur, es troben el tractament amb Polsos Elèctrics d’Alta Intensitat (PEF) i la tecnologia d’Altes Pressions Hidrostàtiques (HHP). Aquestes noves tecnologies permeten conservar en un alt grau la qualitat de determinats aliments frescos (sabor, aroma, color i vitamines) i, a més, inactivar microorganismes i enzimes, que incrementen la seua vida útil en refrigeració i faciliten la seua comercialització. L’objectiu general d’aquesta tesi doctoral ha estat l’estudi del processat d’una nova beguda (un barreig de suc de taronja i llet) per PEF i HHP sols o combinats amb calor, incloent-hi aspectes microbiològics i de qualitat. El pla de treball va començar amb l’elaboració i la caracterització físico-química i sensorial del nou producte i l’elecció de la formulació adequada per desenvolupar els estudis pertinents. Els paràmetres de qualitat més importants en els sucs de fruita son l’activitat enzimàtica i el contingut en aroma (concentració de compostos volàtils). En el cas del suc de taronja, la pectin metil esterasa (PME) és una de las enzimes de major importància. Per això es va realitzar un estudi per avaluar la influència de les diferents tecnologies de conservació (PEF, HHP i calor) en la inactivació enzimàtica. Les tecnologies estudiades van aconseguir un grau d’inactivació del 90%. Després de l’estudi es va observar l’aparició de dos fraccions amb diferent resistència al tractament. Així mateix, el model bifàsic va ser el que millor va descriure les corbes d’inactivació de PME, mitjançant el tractament combinat de HHP i calor en el producte. Es va estudiar també la variació en la concentració de compostos volàtils després del tractament de HHP, PEF i calor en el producte. La tecnologia de PEF va ser la que millor va preservar l’aroma original del producte fresc. Una vegada es van establir el estudis relacionats amb el paràmetres de qualitat es van estudiar els aspectes microbiològics. El inici va consistir en la realització d’un estudi per determinar la influència de les variables del procés per PEF en la inactivació d’un microorganisme alterador en el producte (Lactobacillus plantarum). La intensitat de camp elèctric, el temps de tractament i la temperatura, van ser les variables que més van influir, produint un augment de la inactivació i alhora una menor despesa energètica. A continuació es van estudiar las cinètiques d’inactivació de L. plantarum mitjançant la combinació de la tecnologia de PEF i calor. Al mateix temps, es va elegir el model matemàtic de Weibull per ser el que millor descrivia les corbes de supervivència del microorganisme després del tractament amb PEF. Es va
considerar el paràmetre tcw com a l’índex de resistència del microorganisme al tractament. Entre
els microorganismes patògens, s’ha demostrat últimament que Salmonella typhimurium pot
RESUM

ocasionar un problema de seguretat alimentària en aliments àcids, com és el cas del suc de taronja. Per aquest motiu, es va decidir estudiar les cinètiques d’inactivació d’aquest microorganisme per PEF, en funció de les característiques de l’aliment (pH i concentració d’estabilitzant). Una disminució del pH va afavorir la inactivació, mentre que el percentatge de pectina no va tenir un efecte significatiu. Finalment, es va realitzar un estudi de la vida útil del producte en refrigeració després del tractament de PEF i calor. El resultat d’aquesta última experiència va demostrar la viabilitat de la tecnologia de PEF per obtenir aliments amb una vida útil similar, però amb millor qualitat final.

INDEXES


GENERAL INDEX
1. FRAMEWORK 1
2. INTRODUCTION 5
2.1 HIGH NUTRITIONAL FOOD: FRUIT JUICE-MILK BASED PRODUCTS 6
2.2 THERMAL TREATMENT 6
2.2.1 Influence of thermal treatment on fruit juices quality 7
2.2.2 Methods for thermoresistance measurement 7
2.2.2.1 TDT tubes/disks 8
2.2.2.2 Capillary tubes 9
2.2.2.3 Industrial scale-up 9
2.3 NONTHERMAL PRESERVATION TECHNOLOGIES 10
2.4 HIGH HYDROSTATIC PRESSURE (HHP) 11
2.4.1 HHP treatment system 11
2.4.1.1 One step treatment 15
2.4.1.2 Multi-step treatment 15
2.4.1.3 Step-wise treatment 16
2.4.2 HHP technology related factors 16
2.4.2.1 Pressure level and treatment time 16
2.4.2.2 Temperature: adiabatic heating 17
2.4.2.3 Presurization/depresurization time 19
2.4.3 Food and packaging related factors 19
2.4.3.1 Type of packaging 19
2.4.3.2 Presence of air 20
2.4.3.3 Water activity 20
2.4.3.4 pH 21
2.4.4 HHP microbial inactivation 21
2.4.4.1 Spore inactivation 21
2.4.4.2 Vegetative cells inactivation 22
2.4.5 HHP enzyme inactivation 22

2.4.6 HHP advantages and disadvantages 24
2.4.6.1 Advantages 24
2.4.6.2 Disadvantages 24
2.5 PULSED ELECTRIC FIELD (PEF) 25
2.5.1 PEF treatment system 27
2.5.1.1 Treatment chambers 29
2.5.2 PEF technology related factors 30
2.5.2.1 Electric field strength (E) 30
2.5.2.2 Pulse waveform and polarity 31
2.5.2.3 Temperature (T) 33
2.5.2.4 Treatment time (t) 33
2.5.2.5 Pulse width (w) 34
2.5.3 Product related factors 34
2.5.3.1 Electrical conductivity 35
2.5.3.2 pH 35
2.5.3.3 Viscosity (particulate food) 36
2.5.3.4 Water activity 36
2.5.4 PEF microbial inactivation 36
2.5.4.1 Microorganism type 38
2.5.4.2 Microorganism inoculum size 38
2.5.4.3 Growth phase 39
2.5.5 PEF enzyme inactivation 39
2.5.6 PEF advantages and disadvantages 40
2.5.6.1 Advantages 40
2.5.6.2 Disadvantages 40
2.6 ORANGE JUICE ENZYME ACTIVITY 41
2.6.1 Pectins 41
2.6.2 Pectolytic enzymes: pectin methyl esterase (PME) 41
2.7 ORANGE JUICE MICROBIAL CHARACTERIZATION 42
2.7.1 Salmonella typhimurium 42

2.7.2 Lactobacillus plantarum 44
2.7.3 Orange juice microbial safety 45
2.8 INACTIVATION KINETIC MODELS 46
2.8.1 Microbial inactivation kinetic models 47
2.8.1.1 Bigelow 47
2.8.1.2 Hülsheger 47
2.6.1.3 Weibull 48
2.8.2 Enzyme inactivation kinetic models 49
2.8.2.1 Primary models 49
2.8.2.2 Secondary models 51
2.8.3 z parameter 51
2.8.4 Model fit validity 53
2.8.5 Goodness of fit 53
3 OBJETIVES 55
4. RESULTS 58
4.1 DEVELOPMENT OF A NEW PRODUCT BASED ON ORANGE
JUICE AND MILK IDEAL FOR PEF TREATMENT 59
4.1.1 ABSTRACT 60
4.1.2 INTRODUCTION 61
4.1.3 MATERIAL AND METHODS 62
4.1.3.1 Composition and physicochemical product
characterization 62
4.1.3.2 PEF treatment 62
4.1.3.3 Escherichia coli 63
4.1.3.4 Sensory analysis 64
4.1.4 RESULTS AND DISCUSSION 64
4.1.4.1 Elaboration methodology and physicochemical
characterization 64
4.1.4.2 Effect of food composition on PEF inactivation of
E. coli 65

4.1.4.3 Sensory analysis 65
4.2 EFFECT OF PEF, HHP AND THERMAL TREATMENT ON
PME INACTIVATION AND VOLATILE COMPOUNDS OF AN
ORANGE JUICE-MILK BASED BEVERAGE 68
4.2.1 ABSTRACT 69
4.2.2 INTRODUCTION 70
4.2.3 MATERIAL AND METHODS 71
4.2.3.1 Beverage preparation 71
4.2.3.2 Thermal treatment 71
4.2.3.3 PEF treatment 72
4.2.3.4 HHP treatment 72
4.2.3.5 Analysis of headspace volatile compounds 73
4.2.3.6 PME activity measurement 73
4.2.3.7 Experimental design and statistical analysis 74
4.2.4 RESULTS AND DISCUSSION 74
4.2.4.1 Effect of treatment on PME activity in the orange
juice-milk based beverage 74
4.2.4.2 Effect of treatment on the volatile compounds
concentration in the orange juice-milk based beverage 77
4.3 INACTIVATION KINETICS OF PECTIN METHYL
ESTERASE UNDER COMBINED THERMAL-HIGH PRESSURE
TREATMENT IN AN ORANGE JUICE-MILK BEVERAGE 83
4.3.1 ABSTRACT 84
4.3.2 INTRODUCTION 85
4.3.3 MATERIAL AND METHODS 87
4.3.3.1 Orange juice and beverage preparation 87
4.3.3.2 PME activity measurement 87
4.3.3.3 Experimental design 87
4.3.3.4 Thermal inactivation at atmospheric pressure 88
4.3.3.5 Combined thermal and high-pressure inactivation 88

4.3.3.6 Orange PME purification 89
4.3.3.7 Data analysis and parameter estimation 89
4.3.3.8 Effect of food matrix 92
4.3.4 RESULTS AND DISCUSSION 92
4.3.4.1 Thermal inactivation of the PME in the orange
juice-milk based beverage 92
4.3.4.2 Combined thermal and high-pressure inactivation of
PME in the orange juice-milk based beverage 95
4.3.4.3 Effect of orange matrices 96
4.4 PULSED ELECTRIC FIELDS INACTIVATION OF
Lactobacillus plantarum IN AN ORANGE JUICE–MILK BASED
BEVERAGE: EFFECT OF PROCESS PARAMETERS 101
4.4.1 ABSTRACT 102
4.4.2 INTRODUCTION 103
4.4.3 MATERIAL AND METHODS 104
4.4.3.1 Food sample 104
4.4.3.2 Lactobacillus plantarum 105
4.4.3.3 PEF treatment 105
4.4.3.4 Statistical analysis 106
4.4.4 RESULTS 107
4.4.4.1 Effect of electric field strength 107
4.4.4.2 Effect of temperature 108
4.4.4.3 Effect of pulse width 111
4.4.5 DISCUSSION 114
4.5 EFFECT OF TEMPERATURE AND SUBSTRATE ON PEF
INACTIVATION OF Lactobacillus plantarum IN AN ORANGE
JUICE–MILK BEVERAGE 119
4.5.1 ABSTRACT 120
4.5.2 INTRODUCTION 121
4.5.3 MATERIAL AND METHODS 122

4.5.3.1 Food sample 122
4.5.3.2 Lactobacillus plantarum 123
4.5.3.3 PEF treatment 123
4.5.3.4 Mathematical models 124
4.5.3.5 Statistical analysis 125
4.5.4 RESULTS AND DISCUSSION 126
4.6 EFFECT OF pH AND PECTIN CONCENTRATION ON PEF
INACTIVATION OF Salmonella typhimurium IN AN ORANGE
JUICE-MILK BEVERAGE 132
4.6.1 ABSTRACT 133
4.6.2 INTRODUCTION 134
4.6.3 MATERIAL AND METHODS 136
4.6.3.1 Food sample 136
4.6.3.2 Salmonella typhimurium 136
4.6.3.3 PEF treatment 137
4.6.3.4 Mathematical models 137
4.6.3.5 Statistical analysis 137
4.6.4 RESULTS AND DISCUSSION 139
4.6.4.1 Effect of pH 143
4.6.4.2 Effect of pectin concentration 145
4.7 SHELF-LIFE STUDY OF AN ORANGE JUICE-MILK
BASED BEVERAGE AFTER COMBINED PEF AND THERMAL
PROCESSING 148
4.7.1 ABSTRACT 149
4.7.2 INTRODUCTION 150
4.7.3 MATERIAL AND METHODS 151
4.7.3.1 Beverage preparation 151
4.7.3.2 Thermal treatment 151
4.7.3.3 PEF treatment 152
4.7.3.4 Packaging and storage 152

4.7.3.5 Analysis of headspace volatile compounds 153
4.7.3.6 PME activity measurement 153
4.7.3.7 Physical property measurements 154
4.7.3.8 Color measurement 154
4.7.3.9 Microbiological assay 155
4.3.7.3.10 Statistical analysis 155
4.7.4 RESULTS AND DISCUSSION 155
4.7.4.1 Effects of processing and storage on physical
properties 155
4.7.4.2 Effects of processing and storage on microbial flora 156
4.7.4.3 Effects of processing and storage on PME activity 159
4.7.4.4 Effects of processing and storage on color
measurement 160
4.7.4.5 Effects of processing and storage on volatile
compounds content 162
5. GENERAL DISCUSSION 167
6. CONCLUSIONS 175
7. REFERENCES 178
8. ANNEXES 192
8.1 COMMUNICATIONS BASED ON THESIS WORK 193
8.2 STATISTICAL ANALYSIS 198

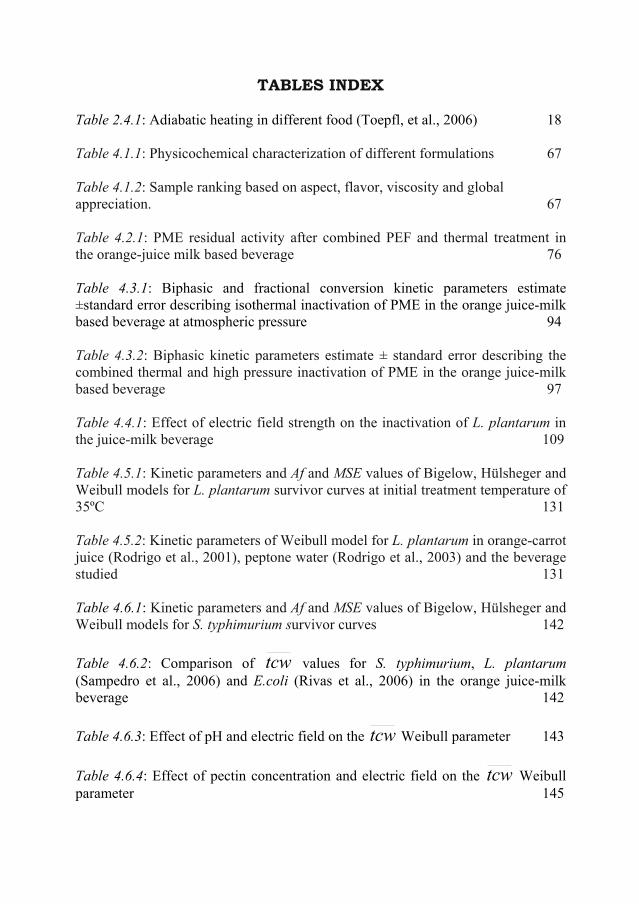
TABLES INDEX Table 2.4.1: Adiabatic heating in different food (Toepfl, et al., 2006) 18 Table 4.1.1: Physicochemical characterization of different formulations 67 Table 4.1.2: Sample ranking based on aspect, flavor, viscosity and global appreciation. 67 Table 4.2.1: PME residual activity after combined PEF and thermal treatment in the orange-juice milk based beverage 76 Table 4.3.1: Biphasic and fractional conversion kinetic parameters estimate ±standard error describing isothermal inactivation of PME in the orange juice-milk based beverage at atmospheric pressure 94 Table 4.3.2: Biphasic kinetic parameters estimate ± standard error describing the combined thermal and high pressure inactivation of PME in the orange juice-milk based beverage 97 Table 4.4.1: Effect of electric field strength on the inactivation of L. plantarum in the juice-milk beverage 109 Table 4.5.1: Kinetic parameters and Af and MSE values of Bigelow, Hülsheger and Weibull models for L. plantarum survivor curves at initial treatment temperature of 35ºC 131 Table 4.5.2: Kinetic parameters of Weibull model for L. plantarum in orange-carrot juice (Rodrigo et al., 2001), peptone water (Rodrigo et al., 2003) and the beverage studied 131 Table 4.6.1: Kinetic parameters and Af and MSE values of Bigelow, Hülsheger and Weibull models for S. typhimurium survivor curves 142 Table 4.6.2: Comparison of tcw values for S. typhimurium, L. plantarum (Sampedro et al., 2006) and E.coli (Rivas et al., 2006) in the orange juice-milk beverage 142 Table 4.6.3: Effect of pH and electric field on the tcw Weibull parameter 143 Table 4.6.4: Effect of pectin concentration and electric field on the tcw Weibull parameter 145

Table 4.7.1: Effect of thermal and PEF processing on different parameters of an orange juice-milk beverage 157 Table 4.7.2: Effect of thermal and PEF processing on volatile compounds content of an orange juice-milk beverage 164 Table 8.2.1: Effect of juice content on PEF inactivation of E.coli at 40 kV/cm 199 Table 8.2.2: Effect of temperature on volatile compounds concentration after thermal treatment 199 Table 8.2.3: Effect of electric field strength on volatile compounds concentration after PEF treatment at 25, 45 and 65ºC 200 Table 8.2.4: Effect of temperature on volatile compounds concentration after PEF treatment at 15, 20, 25 and 30 kV/cm 201 Table 8.2.5: Effect of pressure level on volatile compounds concentration after HHP treatment at 30 and 50ºC 202 Table 8.2.6: Effect of temperature on volatile compounds concentration after HHP treatment at 450, 500, 550, 600 and 650 MPa 202 Table 8.2.7: Effect of treatment time on survivors fraction of L. plantarum after PEF treatment at 35 and 40 kV/cm and 35ºC 204 Table 8.2.8: Effect of electric field strength on survivors fraction of L. plantarum after PEF treatment at 40, 60, 80 and 130 μs and 35ºC 205 Table 8.2.9: Effect of temperature on survivors fraction of L. plantarum after PEF treatment at 35 and 40 kV/cm 205 Table 8.2.10: Effect of treatment time on survivors fraction of L. plantarum after PEF treatment at 35 and 40 kV/cm and 55ºC 206 Table 8.2.11: Effect of pulse width on survivors fraction of L. plantarum after PEF treatment at 40 and 35 kV/cm and 35ºC 207 Table 8.2.12: Effect of pulse width on survivors fraction of L. plantarum after PEF treatment at 40 and 35 kV/cm and 55ºC 207 Table 8.2.13: Effect of electric field strength on D value of Bigelow model for L. plantarum 208

Table 8.2.14: Effect of electric field strength on tcwvalue for L. plantarum 208 Table 8.2.15: Effect of temperature on tcw value for L. plantarum 208 Table 8.2.16: Effect of electric field strength on D value of Bigelow model for S. typhimurium 209 Table 8.2.17: Effect of electric field strength on tc value of Hülsheger model for S. typhimurium 209 Table 8.2.18: Effect of electric field strength on tcw value for S. typhimurium 209 Table 8.2.19: Effect of type of microorganism on tcw value 210 Table 8.2.20: Effect of pH on tcw value at 15 and 40 kV/cm 211 Table 8.2.21: Effect of pectin concentration on tcw value at 15 and 40 kV/cm 211 Table 8.2.22: Effect of electric field strength on. tcw value at 0.1, 0.3 and 0.6% 212 Table 8.2.23: pH value after PEF and thermal treatment 212 Table 8.2.24: pH value during storage of PEF, thermal and untreated sample 213 Table 8.2.25: Brix degrees after PEF and thermal treatment 214 Table 8.2.26: Brix degrees during the storage of PEF, thermal and untreated sample 214 Table 8.2.27: Microbial inactivation after PEF and thermal treatment 215 Table 8.2.28: PME activity after PEF and thermal treatment 215 Table 8.2.29: PME activity during the storage of PEF, thermal and untreated sample 216 Table 8.2.30: L* value after PEF and thermal treatment 217 Table 8.2.31: L* value during the storage of PEF, thermal and untreated sample 217 Table 8.2.32: a* value after PEF and thermal treatment 218

Table 8.2.33: a* value during the storage of PEF, thermal and untreated sample 218 Table 8.2.34: b* value after PEF and thermal treatment 219 Table 8.2.35: b* value during the storage of PEF, thermal and untreated sample 220
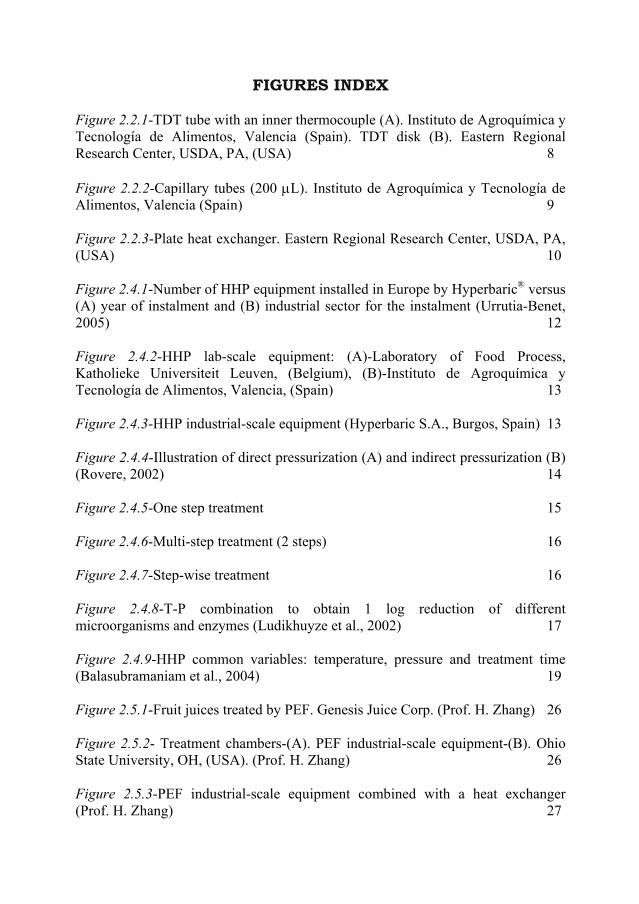
FIGURES INDEX Figure 2.2.1-TDT tube with an inner thermocouple (A). Instituto de Agroquímica y Tecnología de Alimentos, Valencia (Spain). TDT disk (B). Eastern Regional Research Center, USDA, PA, (USA) 8 Figure 2.2.2-Capillary tubes (200 μL). Instituto de Agroquímica y Tecnología de Alimentos, Valencia (Spain) 9 Figure 2.2.3-Plate heat exchanger. Eastern Regional Research Center, USDA, PA, (USA) 10 Figure 2.4.1-Number of HHP equipment installed in Europe by Hyperbaric® versus (A) year of instalment and (B) industrial sector for the instalment (Urrutia-Benet, 2005) 12 Figure 2.4.2-HHP lab-scale equipment: (A)-Laboratory of Food Process, Katholieke Universiteit Leuven, (Belgium), (B)-Instituto de Agroquímica y Tecnología de Alimentos, Valencia, (Spain) 13 Figure 2.4.3-HHP industrial-scale equipment (Hyperbaric S.A., Burgos, Spain) 13 Figure 2.4.4-Illustration of direct pressurization (A) and indirect pressurization (B) (Rovere, 2002) 14 Figure 2.4.5-One step treatment 15 Figure 2.4.6-Multi-step treatment (2 steps) 16 Figure 2.4.7-Step-wise treatment 16 Figure 2.4.8-T-P combination to obtain 1 log reduction of different microorganisms and enzymes (Ludikhuyze et al., 2002) 17 Figure 2.4.9-HHP common variables: temperature, pressure and treatment time (Balasubramaniam et al., 2004) 19 Figure 2.5.1-Fruit juices treated by PEF. Genesis Juice Corp. (Prof. H. Zhang) 26 Figure 2.5.2- Treatment chambers-(A). PEF industrial-scale equipment-(B). Ohio State University, OH, (USA). (Prof. H. Zhang) 26 Figure 2.5.3-PEF industrial-scale equipment combined with a heat exchanger (Prof. H. Zhang) 27

Figure 2.5.4: PEF laboratory equipment-(A). Main components of a PEF equipment: insulator, treatment chambers and thermocouples-(B). Instituto de Agroquímica y Tecnología de Alimentos, Valencia, (Spain) 28 Figure 2.5.5-Scheme of treatment chambers configuration: co-field, co-axial and parallel (Barbosa et al., 1998) 29 Figure 2.5.6-Components of a co-field treatment chamber. Instituto de Agroquímica y Tecnología de Alimentos, Valencia, (Spain) 30 Figure 2.5.7-Exponential decay wave (Barbosa et al., 1999) 31 Figure 2.5.8-Square wave (Barbosa et al., 1999) 32 Figure 2.5.9-Bipolar square wave (Barbosa et al., 1999) 32 Figure 2.5.10-Pulse width (w) (Barbosa et al., 1999) 34 Figure 2.5.11-Effect of PEF treatment on cell membrane (Barbosa et al., 1999) 37 Figure 2.5.12-Cellular size comparison (Qin et al., 1998) 39 Figure 2.6.1-Three-dimensional structure by ions interaction (Plinik and Voragen, 1991) 42 Figure 2.7.1-Electron microscopy of Salmonella typhimurium 44 Figure 2.7.2-Electron microscopy of Lactobacillus plantarum 45 Figure 2.8.1-Illustration of different nonlinear survival curves 48 Figure 4.1.1-Orange juice-milk based product 66 Figure 4.1.2-Effect of food composition on PEF inactivation of E. coli at 40 kV/cm 66 Figure 4.2.1-Isothermal inactivation of PME in the orange juice-milk based beverage 75 Figure 4.2.2-Combined HHP and thermal inactivation of PME in the orange juice-milk based beverage 77 Figure 4.2.3-Effect of thermal treatment for 1 min on volatile compounds content in the orange juice-milk based beverage 79

Figure 4.2.4-Effect of combined PEF and thermal treatment (25, 45 and 65 ºC) on volatile compounds content in the orange juice-milk based beverage 80 Figure 4.2.5-Effect of combined HHP and thermal treatment (30 and 50ºC) on volatile compounds content in the orange juice-milk based beverage 82 Figure 4.3.1-Isothermal inactivation of PME in the beverage fitted by a biphasic model 95 Figure 4.3.2-Combined thermal and high-pressure inactivation of PME in the beverage fitted by a biphasic model 98 Figure 4.3.3-Isothermal inactivation of purified PME, PME in the orange juice-milk based beverage and PME in orange juice 99 Figure 4.3.4-Pressure inactivation of purified PME, PME in the orange juice-milk based beverage and PME in orange juice 100 Figure 4.4.1-Inactivation curves as a function of the treatment time (A) and energy applied (B) for L. plantarum with T=35 ºC and pulse width of 2.5 μs 108 Figure 4.4.2-Effect of treatment temperature on the inactivation of L. plantarum as a function of treatment time with E=35 kV/cm (A) and E=40 kV/cm (B) and as a function of energy applied with E=35 kV/cm (C) and E=40 kV/cm (D) and pulse width of 2.5 μs 110 Figure 4.4.3-Influence of pulse width in the inactivation of L. plantarum at 35ºC as a function of treatment time with E=35 kV/cm (A) and E=40 kV/cm (B) and energy applied with E=35 kV/cm (C) and E=40 kV/cm (D) 111 Figure 4.4.4-Influence of pulse width in the inactivation of L. plantarum at 55ºC as a function of energy applied with E=35 kV/cm (A) and E=40 kV/cm (B) 113 Figure 4.4.5-Effect of treatment temperature on the inactivation of L. plantarum as a function of energy applied with E=35 kV/cm (A) and E=40 kV/cm (B) and pulse width of 4 μs 113 Figure 4.5.1-Growth curve of L. plantarum in the orange juice-milk beverage at 37ºC 127 Figure 4.5.2-Survival curves of L. plantarum in juice-milk based beverage at different electric field strengths at initial T of 35ºC adjusted to the Weibull model. The deviation standard was expressed by error bars 128

Figure 4.5.3-Effect of T in the survive fraction of L. plantarum and tcw of the Weibull model in the beverage with E=40 kV/cm. The deviation standard was expressed by error bars 128 Figure 4.6.1-Salmonella typhimurium counts at 37ºC in the orange juice-milk product 140 Figure 4.6.2-Survival curves of S. typhimurium in the juice-milk based beverage at (♦) 15 kV/cm, (▲) 25 kV/cm, (■) 35 kV/cm and (●) 40 kV/cm at pH=4 adjusted to the Weibull model (―) 141 Figure 4.6.3-Survival curves of S. typhimurium in the juice-milk based beverage at 15 kV/cm at pH=3.5(♦), pH=4(■) y pH=4.5(▲) adjusted to the Weibull model (―) 144 Figure 4.6.4-Survival curves of S. typhimurium in the juice-milk based beverage at 40 kV/cm at pH=3.5(♦), pH=4(■) y pH=4.5(▲) adjusted to the Weibull model (―) 144 Figure 4.6.5: zpH estimation at E = 15 kV/cm (♦) and E = 40 kV/cm (■) 145 Figure 4.6.6-Survival curves of S. typhimurium in the juice-milk based beverage at 15 kV/cm at 0.1% (♦), 0.3% (■) and 0.4% (▲) adjusted to the Weibull model (―) 146 Figure 4.6.7-Survival curves of S. typhimurium in the juice-milk based beverage at 40 kV/cm at 0.1% (♦), 0.3% (■) and 0.4% (▲) adjusted to the Weibull model (―) 146
Figure 4.6.8- z% estimation at E = 15 kV/cm (♦) and E = 40 kV/cm (■) 147
Figure 4.7.1- Growth of microbial flora (A) and mold and yeast counts (B) during the storage (♦) control sample, (▲) thermal sample and (■) PEF sample 158 Figure 4.7.2-Change of PME activity during the storage, (♦) control sample, (▲) thermal sample and (■) PEF sample 160 Figure 4.7.3-Change of color parameters with storage time in the unprocessed sample (♦), thermal treated sample (▲) and PEF treated sample (■) 161 Figure 4.7.4-Evolution of volatile compounds content during the storage (A) control sample, (B) thermal sample and (C) PEF sample 165

EQUATIONS INDEX Equation 2.4.1.-Temperature increase in adiabatic-isentropic conditions 17
Equation 2.5.1.-Electric field strength (E) 30
Equation 2.5.2.-PEF treatment time (t) 33
Equation 2.8.1.-Bigelow model 47
Equation 2.8.2.-Hülsheger model 48
Equation 2.8.3.-Weibull model 48
Equation 2.8.4.- tcw expression 49
Equation 2.8.5.-Biphasic model 50
Equation 2.8.6.-Fractional conversion model 50
Equation 2.8.7.-Temperature dependence of the labile fraction 51
Equation 2.8.8.-Temperature dependence of the stable fraction 51
Equation 2.8.9.-Pressure dependence of the labile fraction 51
Equation 2.8.10-Pressure dependence of the stable fraction 51
Equation 2.8.11.-z parameter estimation 52
Equation 2.8.12.-Af expression 52
Equation 2.8.13.-MSE expression 53
Equation 4.3.1.-Biphasic model 89
Equation 4.3.2.-Fractional conversion model 90
Equation 4.3.3.-Temperature dependence of the labile fraction 90
Equation 4.3.4.-Temperature dependence of the stable fraction 90
Equation 4.3.5.-Pressure dependence of the labile fraction 91
Equation 4.3.6-Pressure dependence of the stable fraction 91
Equation 4.3.7.-Corrected R2 expression 91
Equation 4.4.1.-Energy input (Q) 106
Equation 4.5.1-Bigelow model 124
Equation 4.5.2.-Hülsheger model 124
Equation 4.5.3.-Weibull model 125
Equation 4.5.4.- tcw expression 125
Equation 4.5.5.-Af expression 125
Equation 4.5.6.-MSE expression 126
Equation 4.6.1.-Bigelow model 138
Equation 4.6.2.-Hülsheger model 138
Equation 4.6.3.-Weibull model 138
Equation 4.6.4.- tcw expression 139
Equation 4.6.5.-Af expression 139
Equation 4.7.1.-Total color difference 154

1.-FRAMEWORK

FRAMEWORK
3
One of the main duties of any national sanitary authority is to guarantee a
food supply in safety conditions and recommend those with high nutritional value.
In that sense, there is a scientific evidence that vegetables and fruit consumption
can lessen the impact of illnesses such as cancer, cardiovascular and brain illnesses
or diabetes. Nowadays fruit and vegetable consumption is considered the most
important strategy to prevent the appearing of cancer after reducing tobacco. The
HWO recommends at least 400 grams or five rations of fruit and vegetable
consumption per day, including 30 grams of legumes, seeds and nuts (Southon and
Faulks, 2002).
A growing rhythm of life is generating a higher demand of “ready to eat”
food. On the other hand there is also a higher interest on food quality (low-
preservative content food and products with characteristics near to the fresh
product) and biofood. It is supposed that such food has all food safety guaranties
and an adequate shelf-life in refrigeration conditions. The industry is conscious
about the changes in the consumer tendencies. A significant fact is the appearance
in the market of a great variety of minimally processed food that need chilled chain
for its storage and distribution (fruit juices, sauces, precooked products, fresh pasta,
among others). Within these products, refrigerated juices and the combination of
fruit juice and milk have been on the increase lately. They offer an interesting
flavor mixture and provide essential nutrients to the daily intake such as vitamin-C,
vitamin-D, calcium and natural antioxidants, among others.
The majority of such products are processed by a mild pasteurization
treatment. However, thermal treatment alters the original food characteristics such
as vitamins, color and flavor, among others. In that sense, since twenty years ago,
scientists have begun to develop alternative technologies that could guaranty food
safety and improve the overall product quality. These technologies have been
called “Emerging preservation technologies” or “Nonthermal technologies”
because are based in other aspects different from heat (Raso and Barbosa, 2003).
Within these technologies, Pulsed Electric Field (PEF) and High
Hydrostatic Pressure (HHP) processes are the most important due to their
FRAMEWORK
4
application and promising results. In Spain, HHP technology is present in the
industry and several companies have recently marketed different sliced-jam and
precooked products treated by HHP. In the rest of Europe, commerce of HHP
treated food is growing including a wide range of products. It is believed that the
technology would expand to other industrial fields (Trujillo et al., 2002).
PEF is a more recent technology and several industrial-scale equipments
have been developed in USA and a great number of bench-scale equipments are
spread in different researching groups, three of them in Spain. Nowadays a
company has marketed mixtures of different fruit juices processed by combined
PEF and thermal treatment in USA. It is also believed that the introduction of PEF
technology as a method for liquid food pasteurization would increase in the future
(Clark, 2006).

2.-INTRODUCTION


INTRODUCTION
6
2.1 HIGH NUTRITIONAL FOOD: FRUIT JUICE-MILK BASED
PRODUCTS
Nowadays, new technologies, new food production practices and new food
processes are being developed to satisfy the needs of a changing society. At the
same time, new products are marketed with the purpose to provide to the consumer
improved nutritional food with functional properties. The global market of
functional food is estimated in approximately 33 billions US$, from which 2 billion
US$ belongs to the European market. The key-sector of functional food is dairy
food reaching sales for approximately 1.35 billion US$ in 2003 (Menrad, 2004).
Germany is the most dynamic European country in the development and sales of
functional food. The market volume of functional dairy food has passed from 5
million US$ in 1995 to 419 million US$ in 2002 (Hilliam, 2003a). Other important
category of functional products is the non-alcoholic beverages fortified with
vitamins A, C or E and other functional ingredients. The market volume for these
beverages was 89 million US$ in 2002 against 15 million US$ in 1996 (Hilliam,
2003b).
Regarding to Spain, the total juice consumption was 18.4 1/ per capita in
2005 belonging 10% to short-term life products (Artiach, 2005). There is no data
related to the consumption of juice and milk based products in Spain but during last
years a great variety of new products of such nature have appeared in the market
showing a consumer growing interest.
2.2 THERMAL TREATMENT
Since decades ago, thermal treatment has been the most widespread
method for food preservation. Through the years microbiologically safe food with
low enzyme activity have been produced but at the expense of the final product
quality. Nowadays, sterilization and pasteurization are the most common methods
for food preservation.

INTRODUCTION
7
In order to design the optimum thermal treatment (intensity and type of
treatment), it is necessary to clearly identify the food physicochemical and
microbiological characteristics that most influence on the process such as: pH (acid
and basic food), viscosity (particulate food), food composition (fat content,
proteins, sugar and additives), natural flora, endogenous enzymes and
thermophysical properties (specific heat capacity and thermal conductivity)
(Ramaswamy and Chen, 2002).
2.2.1 Influence of thermal treatment on fruit juices quality
Fruit juices are products susceptible to the loss of their organoleptic
characteristics such as color (luminosity loss), water-soluble vitamins, carotenoids,
changes in the physical properties (viscosity), flavor and volatile compounds
content loss (aroma). At the same time, the temperature increases the rate of non-
enzymatic browning reactions (Maillard reaction, sugar caramelization and
ascorbic acid oxidative reaction) and as a result, a reduction in the sensorial quality
and nutritional value of the juice is produced (Primo, 1979; Gerardi et al., 1983;
Lafuente, 1985). The characteristic juice flavor is also altered appearing a defect
known as “boiled taste”.
The extent of loss after the thermal treatment depends on its nature. On that
basis, the highest loss of nutrients is produced in the sterilization process due to the
severity of the treatment. In addition, food can be deteriorated during the storage
by enzyme or microorganism fractions resistant to the treatment, increasing the rate
as the storage temperature rises. The type of packaging and oxygen concentration
in the headspace will also influence the degradation of the juice (Martín et al.,
1995).
2.2.2 Methods for thermoresistance measurement
Different methods to measure the microorganism and enzyme
thermoresistance as well as quality factor degradation are well established
depending on treatment characteristics (time-temperature combination) and food.

INTRODUCTION
8
In the present doctoral thesis, the TDT (Thermal Death Time) disk/tube method
and capillary tubes method have been developed.
2.2.2.1 TDT disk/tube
This method consists in enclosing the sample in a stainless steel tube (13
mm inner diameter) or disk (3x3 cm) closing it with a sealed screw top. Thermal
treatment is carried out in a water bath with temperature control and immediately
cooled in ice-water after the preset times. To measure the heating time or come-up
time (CUT), a thermocouple connected to a data logger is introduced in the inner
side of the tube/disk containing the sample measuring the time to reach the
different treatment temperatures (Figure 2.2.1). Generally the sample is pre-heated
to 40ºC to avoid a long come-up time. The come-up time in the disk method is
shorter due to the minor sample volume used in the analysis.
The method with tubes is usually used in quality studies when higher
sample volume is needed for the analysis (~20 mL). The method with disks is more
convenient when the quantity of the sample needed is relatively small (1 mL) or
when using high viscosity foods. The main advantage of this method is the low
cost and simplicity. However, the failure of sealing may produce the contamination
of the sample.
(A) (B)
Figure 2.2.1-TDT tube with an inner thermocouple (A). Instituto de
Agroquímica y Tecnología de Alimentos, Valencia (Spain). TDT disk (B).
Eastern Regional Research Center, USDA, PA, (USA).

INTRODUCTION
9
2.2.2.2 Capillary tubes
This method is based on a modification of that proposed by Stern and
Proctor, (1954). This method consists in introducing the sample in a ring-marked
microhematocrit capillary tube with an inner diameter of 0.7-2.5 mm and a volume
ranging from 50-1000 μL (Figure 2.2.2). Tubes are sealed by pulling off both ends
in an oxygen gas flame and then heated in a stirred oil or water bath. After the
preset times, the sample is withdrawn from the bath and immediately cooled in ice-
water. Tubes are opened in aseptic conditions.
The main advantages of this method are the short come-up (6-8 seconds,
depending on the temperature) and its suitability to temperatures up to 130ºC.
Nevertheless, this method is more laborious.
Figure 2.2.2: Capillary tubes (200 μL). Instituto de Agroquímica y Tecnología
de Alimentos, Valencia (Spain).
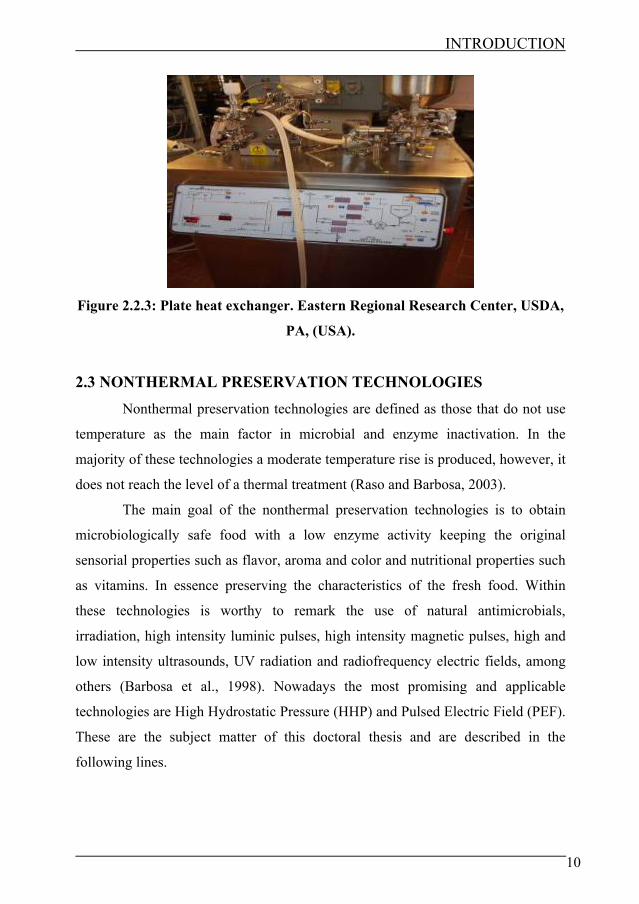
2.2.3.3 Industrial scale-up
Once thermoresistance studies have been performed and optimum
treatments have been established, it is important to scale them up into a semi-
industrial equipment. In the present doctoral thesis, a plate heat exchanger has been
used for such purpose (Figure 2.2.3).
INTRODUCTION
10
Figure 2.2.3: Plate heat exchanger. Eastern Regional Research Center, USDA,
PA, (USA).
2.3 NONTHERMAL PRESERVATION TECHNOLOGIES
Nonthermal preservation technologies are defined as those that do not use
temperature as the main factor in microbial and enzyme inactivation. In the
majority of these technologies a moderate temperature rise is produced, however, it
does not reach the level of a thermal treatment (Raso and Barbosa, 2003).
The main goal of the nonthermal preservation technologies is to obtain
microbiologically safe food with a low enzyme activity keeping the original
sensorial properties such as flavor, aroma and color and nutritional properties such
as vitamins. In essence preserving the characteristics of the fresh food. Within
these technologies is worthy to remark the use of natural antimicrobials,
irradiation, high intensity luminic pulses, high intensity magnetic pulses, high and
low intensity ultrasounds, UV radiation and radiofrequency electric fields, among
others (Barbosa et al., 1998). Nowadays the most promising and applicable
technologies are High Hydrostatic Pressure (HHP) and Pulsed Electric Field (PEF).
These are the subject matter of this doctoral thesis and are described in the
following lines.

INTRODUCTION
11
2.4 HIGH HYDROSTATIC PRESSURE (HHP)
HHP technology is lately acquiring high relevancy as an alternative of
thermal treatment in the preservation of certain type of products (meat products,
fruit and vegetable juices and sauces). The first product treated by HHP appeared at
the beginning of the 90’s in Japan. The company Heidi-ya began to distribute
pasteurized products by HHP such as marmalades, sauces and fruit juices, among
others (Rovere, 2002). Nowadays, great number of companies commercialize HHP
treated products (Figure 2.4.1). In Spain, several meat and canned industries
commercialize products treated with this technology and it is believed that this
tendency will increase in the future (Norton and Sun, 2007).
HHP technology is based in two fundamental principles. The Chatelier
principle that establishes that pressure helps all the reactions and structural changes
that lead to a volume diminish. On the other hand, the isostatic principle that
establishes that pressure distribution is proportional in all food parts independently
of its shape and size (Heremans, 2002).
Van der Berg et al., (2002) estimated the cost of processing a litre of a
product by HHP in 10-20 euro-centimes against 2-4 euro-centimes with heat.
Rastogi et al., (2007) observed the same energy proportion to comprise a litre of
water by HHP (19.2 kJ at 400 MPa) and heat a litre of water (20.9 kJ from 20 to
25ºC). A better design of the process and materials along with the combination
with other technologies (moderate temperature, antimicrobials and CO2) will
permit in a near future talking about a HHP sterilization process (Smelt et al.,
2002).
2.4.1 HHP treatment system
The main components of the HHP equipment are as follow:
- Vessel and yoke
- Hydraulics (generation pressure system)
- Temperature control system

INTRODUCTION
12
Figure 2.4.1: Number of HHP equipment installed in Europe by
Hyperbaric® versus (A) year of instalment and (B) industrial sector for the
instalment (Urrutia-Benet, 2005).
In general term, the operation mechanism of HHP equipment consists in
pumping a pressurizing fluid (water or oil) from a deposit where it is contained to
the treatment vessel. Once the vessel is filled with the liquid and no air is inside,
pressure is built-up by a hydraulic pump. Pressure is transmitted through the liquid
to the vessel up to reaching the desired pressure value. This method is called
“indirect pumping” and it requires static seals (Figure 2.4.4-B). A “direct pumping”
method has been also designed consisting in a piston that directly compresses the

INTRODUCTION
13
vessel increasing the pressure. In this system dynamic seals are required (Figure
2.4.4-A).
(A) (B)
Figure 2.4.2: HHP lab-scale equipment: (A)-Laboratory of Food Process,
Katholieke Universiteit Leuven, (Belgium), (B)-Instituto de Agroquímica y
Tecnología de Alimentos, Valencia, (Spain).
Figure 2.4.3: HHP industrial-scale equipment (Hyperbaric S.A., Burgos,
Spain).

INTRODUCTION
14
Figure 2.4.4: Illustration of a direct pressurization (A) and indirect
pressurization (B) (Rovere, 2002).
Temperature is controlled by a thermostated mantle connected to a cryostat
that surrounds the vessel. This method is adequate in an isothermal treatment.
However, in a nonisothermal treatment, the above temperature control is very slow
and the use of a heat exchanger is preferred. The measure of the temperature is
usually carried out by thermocouples placed inside the vessel in contact with the
pressure medium. Improvement of the temperature control by measuring the
temperature of food during the HHP treatment should be considered (van den Berg
et al., 2002).
Several companies in Japan, USA and Europe (one of them in Spain)
design and commerce HHP industrial and laboratory scale equipments. The
equipments are design with a capacity up to 500 L and provide pressures up to 800
MPa. For technical reasons the majority of the equipments are static. The pressure
medium is regularly water or glycol-oil mixture and food is packaged in a flexible
material with no headspace to resist the volume variation during the treatment.
HHP treatment of fruit juice is based on a pressure range of 400-500 MPa during 1-
5 min under room temperature. Lately, different continuous equipments have
appeared. The principle of its functioning is pumping the product to the vessel and
then pressurized by a floating piston that separates the product from the pressure

INTRODUCTION
15
medium. Other continuous equipments have lastly been marketed based on various
consecutive treatment vessels (van der Berg et al., 2002).
2.4.1.1 One step treatment
This is the most widespread HHP treatment for both industries and
laboratories. It is based on building up the pressure up to the working pressure
level, keeping it during the holding time and depressurization the system (Figure
2.4.5).
Figure 2.4.5: One step treatment.
2.4.1.2 Multi-step treatment
The treatment is based on the combination of consecutive one-step
treatments. The total treatment time will be the sum of the single time of every
treatment (Figure 2.4.6). It is believed that the multi-step treatment produces an
increase in the microorganism inactivation due to higher cellular stress by the
successive compressing and decompressing.
P2
P1 P1
P2
10 min.

INTRODUCTION
16
Figure 2.4.6: Multi-step treatment (2 steps).
2.4.1.3 Step-wise treatment
This treatment is a nonisobaric process and is used when the pressure value
during the treatment is wanted to vary. A direct application of this type of
treatment is the HHP spore germination (phenomenon explained later).
Figure 2.4.7: Step-wise treatment
2.4.2 HHP technology related factors
2.4.2.1 Pressure level and treatment time
Pressure level and treatment time are the two most important variables in
the HHP technology. As general rule an increase in the pressure value produces
higher inactivation shorten the treatment time. In the equipment design is important
to know the relation between P-t to reach the required inactivation degree.
Generally a treatment time more than 20 min would not produce a significant
P2
P1 P1
P2 P2
P1 5 min. 5 min.
P2
P1 P1
P2
P3
5 min.
10 min.
P3

INTRODUCTION
17
inactivation increase being 5 min the optimum value (Balasubramaniam et al.,
2004). Vegetative cells need pressure values between 200-400 MPa while enzymes
and bacterial spores need higher pressure values (500-1000 MPa) and combination
with moderate temperature (30-60ºC). Increasing the required pressure value will
increase the cost of the equipment as well the total operating time. These
circumstances will make the final product more expensive. A way to reduce the
required pressure level is increase the initial temperature of the product (Figure
2.4.8).
0
150
300
450
600
750
900
-10 0 10 20 30 40 50 60 70 80 90 100
Temperature (°C)
Pres
sure
(MPa
)
A.phos
PPOPME
soy LOX
GB LOX (j)
GB LOX(i)
GB LOX(i)
GP LOX(j)Z. bailii
S.cerevisiae
E.coliL.casei
Figure 2.4.8: T-P combination to obtain 1 log reduction of different
microorganisms and enzymes (Ludikhuyze et al., 2002).
2.4.2.2 Temperature: adiabatic heating
During the compression the temperature of all compressible materials
increases due to the adiabatic heating. The general expression used to illustrate the
temperature rise during the compression in adiabatic-isentropic conditions is as
follow (Toepfl et al., 2006):
pCT
dpdT
⋅⋅
=ρβ
Equation 2.4.1

INTRODUCTION
18
where β, ρ and Cp are thermal expansivity, density and specific heat
capacity of the pressurizing fluid, respectively. The thermophysical properties are
pressure and temperature dependent. When these properties are known, it is
possible to estimate the temperature profile during the compression. Different
pressure transmitting media show different adiabatic heating curves that can be
obtained from the mixtures of pure substances. The main ingredient in many
products is water, allowing estimating the temperature rise during the treatment
using its thermodynamic properties. Water has a low compression heating value
while the temperature rise in fat-containing food can be three times higher (Table
2.4.1). The heat transfer of the pressure medium can be used to increase the food
temperature during and after the adiabatic heating.
Figure 2.4.9 shows the pressure and temperature variation during the HHP
treatment. Ps and Pf represent the atmospheric pressure (0.1 MPa). Tm is the
maximum process temperature. The difference in room temperature before and
after HHP treatment (Ts y Tf) generally indicates the heat loss produced during the
treatment (with the presumption that the depressurizing time only takes few
seconds) (Balasubramaniam et al., 2004).
Table 2.4.1: Adiabatic heating in different food (Toepfl, et al., 2006).
Substance T increase / 100 MPa (ºC)
Water ~3.0
Potato purée ~3.0
Orange juice ~3.0
Tomato sauce ~3.0
Milk (2% fat) ~3.0
Salmon ~3.2
Chicken fat ~4.5
Beef fat ~6.3
Olive oil 6.3-8.7
Soya oil 6.2-9.1

INTRODUCTION
19
Figure 2.4.9: HHP common variables: temperature, pressure and treatment
time (Balasubramaniam et al., 2004).
2.4.2.3 Pressurization/depressurization time
The temperature rise during compression depends on the required pressure
value and come-up time (CUT). Higher CUT will increase the temperature that
follows the pressure rising. The pressurizing/depressurizing time will depend on
the equipment used. Automatic equipments where the pressurizing/depressurizing
time will depend on the equipment facilities and manual equipments where the
pressure is building-up manually being this variable able to control (Rovere, 2002).
2.4.3 Food and packaging related factors
2.4.3.1 Type of packaging
One of the most important factors in HHP treatment is the use of an
appropriate packaging material. Their physical and mechanical properties will

INTRODUCTION
20
influence the treatment effectiveness. In general, the packaging must be resistant to
high pressure levels maintaining their sealing properties to prevent quality losses
during the treatment. During HHP treatment the volume loss suffered by the
packaging can reach 15% turning back to its original volume during
decompression. For that reason, at least a packaging inter-phase must be flexible to
transmit the pressure adequately. According to that, metal, glass or rigid plastic
materials are not suitable for the treatment. Flexible plastic (bags, tubes or trays)
are up to now the best options for HHP treatment, however, systematic studies are
necessary to improve the design of packaging and seals to acquire resistance to
higher pressure values. The type of packaging used for some fruit juices, sauces
and milk, among others, are good examples where packaging and sealing should be
redesign for a HHP treatment purpose (Rastogi, et al., 2007).
2.4.3.2 Presence of air
The presence of air is other important factor intimately related with the
food and packaging. As stated before, the packaging volume tends to be reduced
during HHP treatment. The presence of air (headspace) which is more
compressible than water could produce the packaging breakage. The texture loss
produced by the air compression in food such as strawberries, lettuces or prefrozen
bread is other of the HHP main effects.
2.4.3.3 Water activity
In general by diminishing the food water activity the treatment efficacy
decreases due to a less pressure transmission. In the enzyme denaturation process it
is also necessary the presence of water (Van den Broeck et al., 1999 b). As a
consequence, dried or dehydrated food should be evaluated for being treated by
HHP.
INTRODUCTION
21
2.4.3.4 pH
A decrease in the pH value generally improves the effectiveness of the
treatment. Gram- bacteria seem to be more acid-tolerant and thus baroresistant than
Gram+ bacteria (Alpas et al., 2000).
2.4.4 HHP microbial inactivation
2.4.4.1 Spore inactivation
Spore formation is a surviving strategy of some microorganisms to adverse
conditions being Bacillus and Clostridium genus the most important in food.
Despite that applying high pressure levels spore counts in food can be reduced, in
order to reach an sterilization process, it is necessary the combination with other
technologies. A combined HHP and thermal treatment has been used in numerous
studies with promising results in spore inactivation (3 log reductions in Clostridium
sporogenes and Bacillus coagulans after 500 MPa combined with 60-70ºC)
(Roberts and Hoover, 1996; Mills et al., 1998).
Different spore germination methods have been proposed by the
combination of a germinant, pressure and moderate temperature (Sojka y Ludwig.,
1994 and 1997; Raso et al., 1998; Wuytack et al., 1998; Black et al., 2006). It is
based on a step-wise treatment (Figure 2.4.7) applying a treatment at low pressure
levels (200-300 MPa) combined with the use of a germinant to induce spore
germination, followed by a combined HHP and thermal treatment (500-600 MPa,
30-50ºC) to inactivate vegetative cells. Up to now, this type of treatment is under
study due to the variability in the germination of a spore population and differences
among different microorganisms. The absence of spore germination kinetic studies
is also remarkable. In spite of the good results obtained, it is still not possible to
talk about a sterilization process (Wuytack, 1999).

INTRODUCTION
22
2.4.4.2 Vegetative cells inactivation
The mechanism of microorganism inactivation by HHP is a combination of
different reactions, such as noncovalent bonds breakdown and cell membrane
permeability increase that modifies the ions efflux leading to a decrease in the
intracellular pH. At low pressure levels the morphological damage produced in the
cellular membrane is often reversible while at higher levels the death of the
microorganism is produced by an irreversible damage (Rastogi, et al., 2007).
Generally the microorganism baroresistance is inversely proportional to the
membrane rigidity. Pressure values between 200-600 MPa at room temperature are
often enough to inactivate the majority of vegetative cells including molds and
yeasts. An initial temperature rise between 45 and 50ºC increase the inactivation
level producing a synergetic effect (Smelt et al., 2002).
The microorganism baroresistance also depends on the species. Molds and
yeasts are less baroresistant and are frequently inactivated at 200-300 MPa. Gram-
bacteria are often more sensitive to the treatment than Gram+ bacteria and a
treatment at 400 MPa is generally enough to inactivate them. However, there are
numerous exceptions to this affirmation. It has been demonstrated that some E. coli
O157:H7 strains are more baroresistant. The combination of HHP with other
technologies such as acidification or antimicrobials (ascorbic acid, nisin o
lysozyme) seems to reduce microorganism baroresistance (Smelt et al., 2002).
2.4.5 HHP enzyme inactivation
Enzymes are a special type of proteins with an enormous catalytic power
and a great specificity. Their biological activity arises from active sites brought
together by a three-dimensional configuration. They have two important regions;
one that recognizes the substrate and other that catalyzes the reaction once the
substrate has been bound (Ludikhuyze et al., 2002). These two are called the active
site and take place in a small part of the enzyme total volume. Changes in the
active site or protein denaturation can produce an activity loss or functionality
variations (Tsou, 1986). In general, covalent bonds are not affected by HHP

INTRODUCTION
23
treatment because the primary structure of the enzyme will not be damage. The
hydrogen bonds are also relatively baroresistant and secondary structure will not be
affected up to pressure values around 700 MPa. However, HHP treatment affects
electrostatic and hydrophobic interactions that maintain the tertiary and quaternary
structures stability (Ludikhuyze et al., 2002).
Within the enzymes, the most important in fruit juices are the following:
• Polyphenol oxidase (PPO): it is responsible of the enzymatic browning.
• Lipoxygenase (LOX): It induces changes in flavor, color and nutritional
value.
• Pectin methyl esterase (PME): it is responsible of cloud loss and
consistency changes.
• Peroxidase (POD): it increases the production of undesirable flavors.
HPP treatment also produces structure damage in the active site interfering
in the enzyme-substrate union. As for the microorganism, the baroresistance varies
among different enzymes. In fruit juices enzyme baroresistance is generally higher
than the majority founded microorganisms. For that reason, fruit juice preservation
treatment is based on the inactivation of the enzymes responsible for its
deterioration (PME in orange juice or PPO in apple juice, among others). However,
there is no relation between enzyme baroresistance and thermoresistance among
different enzymes.
Enzyme baroresistance also depends greatly on its origin. Depending on
the fruit and variety, enzyme structure can differ varying the resistance to the
treatment. As illustration, orange PME presents different fractions with different
treatment resistance and orange variety (Navel and Valencia var., among others)
seems to modify the behavior against the treatment. Other conditions such as
harvest season could also affect enzyme baroresistance.
Food characteristics also affect the extent of enzyme baroresistance. As
same as occurs to the microorganisms, pH diminishes enzyme baroresistance in an
acid environment. However, exceptions to this affirmation have been found.
Orange PME presents greater baroresistance at pH values of orange juice (Van den

INTRODUCTION
24
Broeck et al., 1999 a). Sugar content also seems to protect the enzyme against the
treatment due to a decrease in water activity content (Marshall et al., 1985;
Seyderhelm et al., 1996; Van den Broeck et al., 1999 b). In overall, the influence of
food composition is not clear and further discussion is presented in the results
section.
Other important fact in the HHP treatment of the enzyme is the enzyme
activation phenomenon at low pressure levels. Several studies state that by
applying a treatment around 100-400 MPa at room temperature an enzyme
activation phenomenon (PPO and PME) is observed, increasing its activity after the
treatment (Asaka and Hayashi, 1991; Asaka et al., 1994). An increase in the
cellular membrane permeabilization by the HHP treatment has been proposed as
the principal reason. Part of the enzyme bounded to the juice pulp could be
released after the treatment producing an increase in the enzyme activity. Different
changes that increase the enzyme-substrate union also seems to be one of the other
main causes.
2.4.6 HHP advantages and disadvantages
2.4.6.1 Advantages
Within the main advantages of HHP technology, it can be remarked:
• Pressure transference in the whole system is instantaneous and independent
of the food size and geometry.
• Microbial death and enzyme inactivation is produced at room temperature
improving the overall food quality.
• Creation of new food textures.
2.4.6.2 Disadvantages
Within the main disadvantages of HHP technology, it can be remarked:
• Continuous food processing equipment has not been well established.
• High equipment cost.

INTRODUCTION
25
• It is necessary to have qualified staff and adequate facilities.
• Low efficacy in food with occluded air and low water activity.
• Food sterilization by HHP has not been established.
2.5 PULSED ELECTRIC FIELD (PEF)
The main basic principle of this technology consists in the generation of a
high voltage to a food situated between two electrodes separated by an insulator.
Treatment time range from 1-2500 μs and electric field strength between 10-80
kV/cm. Either PEF equipment design and microorganism and enzyme inactivation
kinetics are the basic principles to obtain microbiologically safe food with a long
shelf-life keeping the sensorial and nutritional properties of fresh product.
PEF technology is a promising alternative specially indicated to pasteurize
liquid food such as fruit and vegetables juices, milk and liquid egg with
thermolabile nutritional components. Nowadays good expectations for using such
technology to an industrial level are expected. Various companies manufacturing
PEF processing units have appeared in recent years, among them, Diversified
Technologies Corp. in USA and ScandiNova Systems AB in Sweden are the most
important. In addition, Genesis Juice Corp. in Oregon State (USA), commercialize
different fruit juice mixtures processed by a combined PEF and thermal treatment
(60ºC) (Figure 2.5.1). The PEF equipment was designed at Ohio State University
(OSU, USA) and is combined with a plate heat exchanger (Figures 2.5.2 and
2.5.3). Besides, there are serious expectations in using PEF in other countries such
as Brazil to export fresh orange juice to USA.
PEF technology applications are mainly focused on food preservation,
however, PEF treatment has also been applied in different studies to improve the
extraction of different components by increasing the permeability of plant cells
from diverse foodstuff (Ade-Omawaye, et al., 2001) and by improving the juice
yield and quality parameters (Guderjan et al., 2007, Schilling et al., 2007).

INTRODUCTION
26
Figure 2.5.1-Fruit juices treated by PEF. Genesis Juice Corp. (Prof. H.
Zhang).
(A) (B)
Figure 2.5.2- Treatment chambers-(A). PEF industrial-scale equipment-(B).
Ohio State University, OH, (USA). (Prof. H. Zhang).

INTRODUCTION
27
Figure 2.5.3-PEF industrial-scale equipment combined with a heat exchanger
(Prof. H. Zhang).
2.5.1 PEF treatment system
PEF processing system is mainly constituted by:
- Power source
- Switches
- Resistors
- Capacitor bank
- Transformer
- Pump system
- Treatment chambers
- Voltage, current and temperature probes
- Oscilloscope
- Cooling system
- Aseptic packaging equipment (optional)
A power source is used to charge the capacitor bank and a switch to
discharge energy to the treatment chambers. The different disposition and number
of the components (resistors, power source and switches) give rise to different
pulse waveforms. An oscilloscope is used to monitor voltage, current and pulse

INTRODUCTION
28
width. The cooling system (thermostated bath) avoids an excessive temperature
rise due to the ohmic heating (Barbosa et al., 1998).
A restricting factor in a PEF treatment is the dielectric breakdown. The
phenomenon is produced when electric field exceeds the dielectric strength of the
food, causing the interruption of the treatment. Main causes such as high treatment
intensity, high product electrical conductivity or the presence of air bubbles are
discussed. The dielectric breakdown is also known as “arc” or “spark” due to the
formation of a spark inside of the treatment chamber (Barbosa et al., 1998). During
latest years the practice of including an overpressure valve at the entrance of the
treatment chambers has been adopted. This valve increases the internal pressure
diminishing the presence of air bubbles. Normally 25 psi (1.72 bar) values are
adequate to avoid problems with the presence of air.
Main components of the PEF equipment used in this doctoral thesis are
shown in Figure 2.5.4.
(A) (B)
Figure 2.5.4: PEF laboratory equipment-(A). Main components of PEF
equipment: insulator, treatment chambers and thermocouples-(B). Instituto
de Agroquímica y Tecnología de Alimentos, Valencia, (Spain).

INTRODUCTION
29
2.5.1.1 Treatment chambers
Two principle types of chambers are used in the PEF technology
depending on the working system. Continuous chambers used for pasteurization of
liquid food and static chambers working in batch mode more suitable for studies in
solid food (components extraction). Nowadays, the majority of laboratories use
continuous chambers (Barbosa et al., 1999).
According to the chamber distribution and geometry, it can be
distinguished (Figure 2.5.5):
• Parallel-plate chamber: static chamber with a lesser electrode distance
than the surface among them.
• Coaxial chamber: continuous chamber constituted by two cylindrical
electrodes where the food is flowing between them.
• Co-field chamber: continuous chamber where the direction of the
electric field is parallel to the food flowing. This type of chamber
configuration has been used in the present work (Figure 2.5.6).
Figure 2.5.5: Scheme of treatment chambers configuration: co-field, coaxial
and parallel (Barbosa et al., 1998).
Chambers should be designed to obtain a uniform electric field that
improve treatment effectiveness, energy saving and avoid dielectric breakdown
phenomenon. Within three studies published in recent years (Evrendilek et al.,
2004; Roodenburg et al., 2005 a and b) it was observed that PEF treatment in

INTRODUCTION
30
orange juice and beer produced the dissolution of the main components that
composed the treatment chamber (nickel, chrome, manganese, iron and zinc). The
analysis of the metal concentration in the PEF treated samples showed that they
were under the maximum standards stated by the European legislation for fruit
juices and water for human consumption. However, the flavor of the PEF treated
samples was significantly different from the fresh ones containing a certain
“metallic” taste. It has been recently adopted to include designing materials such as
titanium much more resistant to metal migration.
Figure 2.5.6: Components of a co-field treatment chamber. ). Instituto de
Agroquímica y Tecnología de Alimentos, Valencia, (Spain).
2.5.2 PEF technology related factors
2.5.2.1 Electric field strength (E)
The electric field applied inside the chambers is defined by the relation
between the electrical potential difference applied in two electrodes and the
distance between them. The electric field for a flat geometry and a co-field design
is defined as:
dVE =
Equation 2.5.1
INTRODUCTION
31
where E, is the electric field (kV/cm), V is the potential difference (kV)
and d is the distance between electrodes (cm).
Electric field is the most influential factor in PEF treatment. The external
electric field induces a potential difference across the cellular membrane.
Maximum value that the membrane could withstand is known as critical
transmembrane potential or critical electric field (Ec). When the external electric
field exceeds Ec value, membrane breakdown is produced Such value principally
depends on the microorganism and environment and differences in the electric field
value affect the treatment effectiveness (Qin et al., 1998).
2.5.2.2 Pulse waveform and polarity
The main pulse waveforms used in a PEF treatment are:
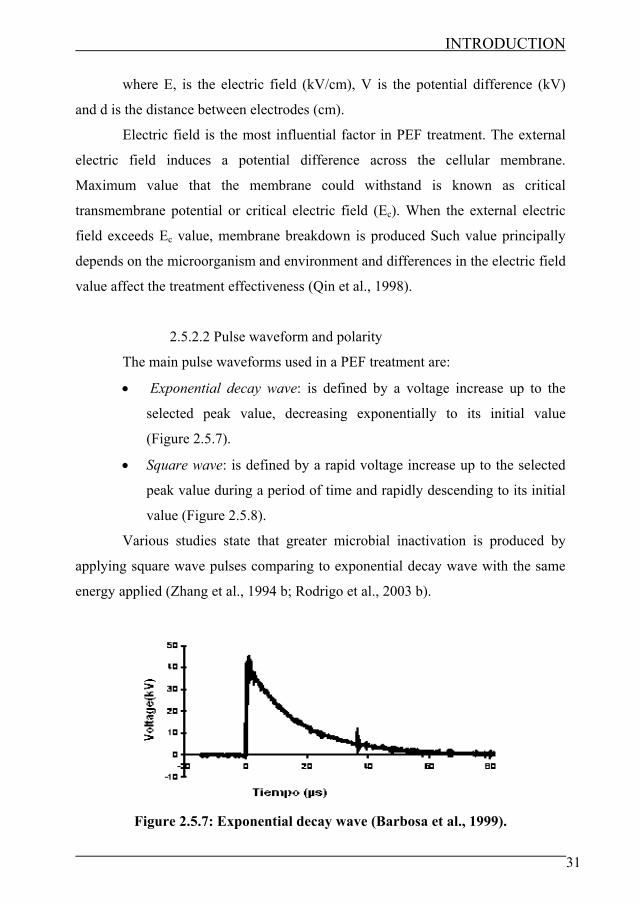
• Exponential decay wave: is defined by a voltage increase up to the
selected peak value, decreasing exponentially to its initial value
(Figure 2.5.7).
• Square wave: is defined by a rapid voltage increase up to the selected
peak value during a period of time and rapidly descending to its initial
value (Figure 2.5.8).
Various studies state that greater microbial inactivation is produced by
applying square wave pulses comparing to exponential decay wave with the same
energy applied (Zhang et al., 1994 b; Rodrigo et al., 2003 b).
Figure 2.5.7: Exponential decay wave (Barbosa et al., 1999).

INTRODUCTION
32
Figure 2.5.8: Square wave (Barbosa et al., 1999).
Pulses can also be classified in monopolar or bipolar depending on their
polarity. Bipolar pulses apply a positive pulse followed by a negative or the
opposite way causing a reversal of the electric charge. The application of bipolar
pulses changes the direction of movement of charged ions in the cell membrane
causing a structural fatigue, increasing the susceptibility to electrical breakdown.
This phenomenon will promote the microorganism death (Ho et al., 1995) (Figure
2.5.9). In the case of monopolar pulses (Figure 2.5.10), same polarity is maintained
and seem to be less effective on microorganism inactivation (Barbosa et al., 1998).
In turn, monopolar pulses separate charged particles forming a deposit on the
electrode, distorting the electric field. In the enzyme inactivation the relation
between pulse polarity and the reached inactivation has not been established yet
(Giner et al., 2001; Élez et al., 2006 a).
Figure 2.5.9: Bipolar square wave (Barbosa et al., 1999).

INTRODUCTION
33
2.5.2.3 Temperature (T)
PEF treatment produces a temperature rise due to the ohmic heating.
Temperature rise increases when the treatment intensity also increases (electric
field and treatment time). Such rise generally favors enzyme and microorganism
inactivation, producing a synergetic effect (pulses-temperature) at 35-60ºC. An
increase in the membrane permeability and fluidity and subsequent structural
fatigue seem to be the main effects of T on microorganism inactivation (Jayaram et
al., 1992). Sepulveda, et al., (2005) argued that at low temperatures the
phospholipids of the microorganism membrane are attached creating a gel-shaped
rigid structure. At greater temperatures the membrane adopts a crystalline liquid
appearance that diminishes its physical stability being more susceptible to PEF
treatment. In the enzyme inactivation, a temperature rise would favor structural
changes and charges alteration leading to enzyme denaturation and activity loss.
2.5.2.4 Treatment time (t)
Treatment time is defined as:
wnt ×= Equation 2.5.2
where t is the treatment time (µs), n is the number of pulses and w the pulse
width (μs). In general, a treatment time increase causes a temperature rise and
greater inactivation. Nevertheless, the relation between the survivors number or
enzyme activity and treatment time is not linear observing the appearance of
shoulders and tailing phenomena. In that sense, once certain inactivation is
produced, a rise in the treatment time and thus in the energy applied, do not
produce any significant increase in the inactivation (Raso et al., 2000, Aronsson et
al., 2001).
INTRODUCTION
34
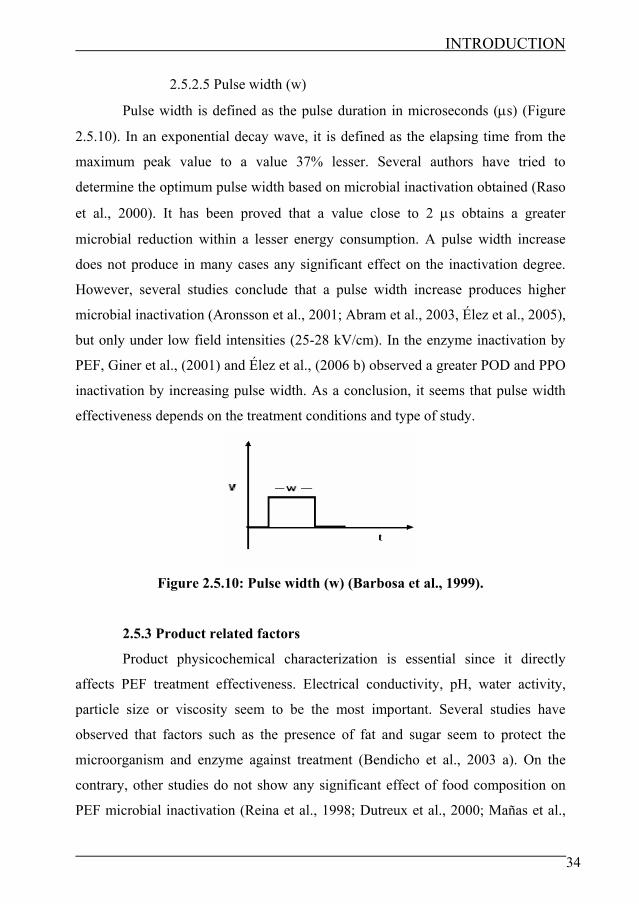
2.5.2.5 Pulse width (w)
Pulse width is defined as the pulse duration in microseconds (μs) (Figure
2.5.10). In an exponential decay wave, it is defined as the elapsing time from the
maximum peak value to a value 37% lesser. Several authors have tried to
determine the optimum pulse width based on microbial inactivation obtained (Raso
et al., 2000). It has been proved that a value close to 2 μs obtains a greater
microbial reduction within a lesser energy consumption. A pulse width increase
does not produce in many cases any significant effect on the inactivation degree.
However, several studies conclude that a pulse width increase produces higher
microbial inactivation (Aronsson et al., 2001; Abram et al., 2003, Élez et al., 2005),
but only under low field intensities (25-28 kV/cm). In the enzyme inactivation by
PEF, Giner et al., (2001) and Élez et al., (2006 b) observed a greater POD and PPO
inactivation by increasing pulse width. As a conclusion, it seems that pulse width
effectiveness depends on the treatment conditions and type of study.
Figure 2.5.10: Pulse width (w) (Barbosa et al., 1999).
2.5.3 Product related factors
Product physicochemical characterization is essential since it directly
affects PEF treatment effectiveness. Electrical conductivity, pH, water activity,
particle size or viscosity seem to be the most important. Several studies have
observed that factors such as the presence of fat and sugar seem to protect the
microorganism and enzyme against treatment (Bendicho et al., 2003 a). On the
contrary, other studies do not show any significant effect of food composition on
PEF microbial inactivation (Reina et al., 1998; Dutreux et al., 2000; Mañas et al.,

INTRODUCTION
35
2001). It seems that the different food constituents and target microorganism do not
affect equally on the inactivation degree. Further discussion is provide in the
present doctoral thesis
2.5.3.1 Electrical conductivity
In general high electrical conductivity foods are more difficult to be
processed by PEF due to a less electrical resistivity (Barbosa et al., 1999). In turn,
lesser microbial inactivation is produced due to a greater solutes concentration that
increases membrane rigidity turning it more stable to the treatment (Wouters et al.,
2001).
A decrease in the electrical conductivity will produce higher conductivity
difference between the microorganism and the environment, creating a flux of ionic
substances through the membrane. This would increase cell membrane weakening
and permeability making it more susceptible to the treatment (Wouters et al., 1999;
Dutreux et al., 2000). However, Álvarez et al., (2000 and 2003) observed that by
increasing the medium conductivity (2, 3 and 4 mS/cm) the inactivation of S.
senftenberg and L. monocytogenes also increased. The fact that by increasing
conductivity it was necessary to apply greater voltage to obtain the same electric
field could be the main reason.
2.5.3.2 pH
Generally microorganisms have a greater treatment resistance at the
optimum growth pH. When pH varies from the optimum value, treatment
resistance decreases. Various studies demonstrate that any food pH diminishing
favors PEF microbial inactivation due to an additional cell stress. In an acid
environment, a greater H+ ions transporting to cell is produced and due to the
higher membrane permeability after PEF treatment a cytoplasm pH reduction is
produce leading to cellular death. Intracellular pH modification can also unchain
chemical variation in compounds such as DNA and ATP (Vega-Mercado et al.,
1996, Wouters et al., 2001).
INTRODUCTION
36
pH resistance differs among different microorganisms. Differences in the
optimum growth pH seem to be the most probable cause of the observed
differences (Álvarez et al., 2000; Aronsson and Rönner, 2005). Evrendilek and
Zhang, (2003) demonstrated that pre-adapting E. coli 0157:H7 to the acid
environment the pulsoresistance increased. This circumstance could occur in fruit
juice processing where any adaptation to the acid environment could cause greater
resistance to the subsequent preservation treatment.
2.5.3.3 Viscosity (particulate food)
Viscosity is considered a limiting factor in the PEF treatment. The presence
of particles could induce to a sudden change in electrical conductivity, causing an
increase in the electric field and the subsequent treatment interruption. An increase
in food viscosity would also difficult to obtain an adequate flow-regime (laminar-
turbulent). This fact confirms that the use of an adequate pump is essential.
2.5.3.4 Water activity
Food water activity could also affect PEF treatment effectiveness. Álvarez
et al., (2002) observed lesser PEF inactivation of L. monocytogenes reducing food
water activity from 0.99 to 0.93. Such authors hypothesized about an increase in
membrane rigidity that would lead to a wall cell greater PEF resistance. In turn,
cellular wall contraction would decrease the cellular size affecting PEF treatment
effectiveness (Aronsson and Rönner, 2001).
2.5.4 PEF microbial inactivation
Development of new food preservation technologies demands the
knowledge of the different mechanisms of microorganism inactivation. The
majority of studies agree to remark that PEF treatment produces a series of
structural and functional changes in the cellular membrane that lead to a
microorganism death (Mañas and Pagán, 2005).

INTRODUCTION
37
Zimmermann, (1986) observed that charged particles of a cell tend to
accumulate in the inner and outer membrane surface generating 10 mV
transmembrane potential. When an external electric field is applied, a great
quantity of charged particles is accumulated on both sides compressing the
membrane. As commented earlier, cellular membrane can hold an Ec maximum
value. When the applied electric field exceeds Ec value, an electrocompression
effect by the accumulation of charges is produced leading to the formation of pores
in the membrane. Size and quantity of pores will depend on the applied electric
field and treatment time. In general it can be divided in “reversible” and
“irreversible” pores. “Reversible” pores are those formed at low treatment
conditions returning to the membrane initial form after the treatment. This could
cause certain cell injury known as sublethal damage leading to cellular death in
stress conditions such as low pH and refrigeration temperature. On the contrary, if
the electric field is higher than Ec, “irreversible” pores are produced leading to the
death of the microorganism (Figure 2.5.11). Besides structural changes in the
membrane, other changes have been observed inside the cell indicating that pores
formation is not the only PEF microbial inactivation mechanism; however, it is the
most important (Harrison et al., 1997).
Figure 2.5.11: Effect of PEF treatment on cell membrane (Barbosa et al.,
1999).
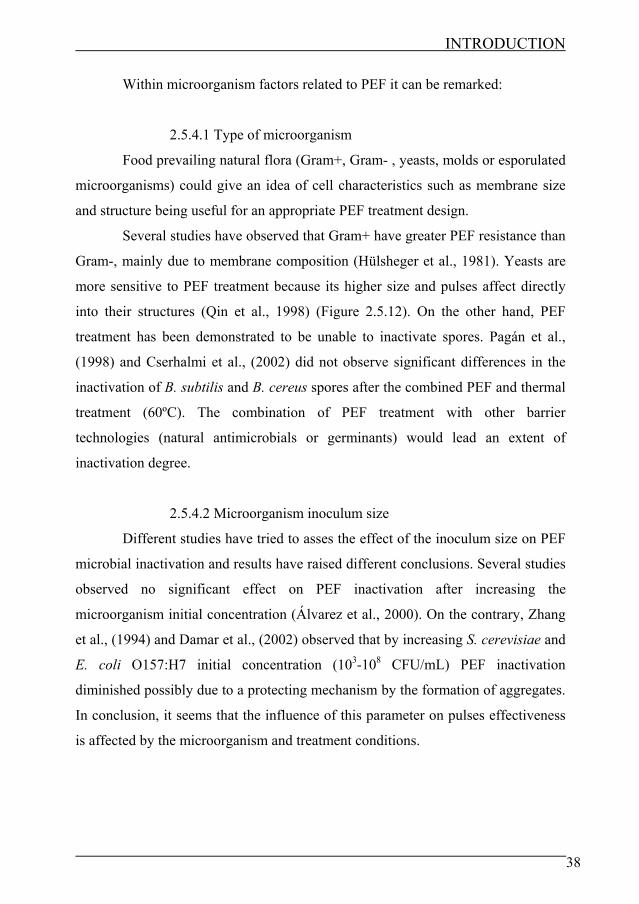
INTRODUCTION
38
Within microorganism factors related to PEF it can be remarked:
2.5.4.1 Type of microorganism
Food prevailing natural flora (Gram+, Gram- , yeasts, molds or esporulated
microorganisms) could give an idea of cell characteristics such as membrane size
and structure being useful for an appropriate PEF treatment design.
Several studies have observed that Gram+ have greater PEF resistance than
Gram-, mainly due to membrane composition (Hülsheger et al., 1981). Yeasts are
more sensitive to PEF treatment because its higher size and pulses affect directly
into their structures (Qin et al., 1998) (Figure 2.5.12). On the other hand, PEF
treatment has been demonstrated to be unable to inactivate spores. Pagán et al.,
(1998) and Cserhalmi et al., (2002) did not observe significant differences in the
inactivation of B. subtilis and B. cereus spores after the combined PEF and thermal
treatment (60ºC). The combination of PEF treatment with other barrier
technologies (natural antimicrobials or germinants) would lead an extent of
inactivation degree.
2.5.4.2 Microorganism inoculum size
Different studies have tried to asses the effect of the inoculum size on PEF
microbial inactivation and results have raised different conclusions. Several studies
observed no significant effect on PEF inactivation after increasing the
microorganism initial concentration (Álvarez et al., 2000). On the contrary, Zhang
et al., (1994) and Damar et al., (2002) observed that by increasing S. cerevisiae and
E. coli O157:H7 initial concentration (103-108 CFU/mL) PEF inactivation
diminished possibly due to a protecting mechanism by the formation of aggregates.
In conclusion, it seems that the influence of this parameter on pulses effectiveness
is affected by the microorganism and treatment conditions.

INTRODUCTION
39
Figure 2.5.12: Cellular size comparison (Qin et al., 1998).
2.5.4.3 Growth phase
Membrane cell characteristics are different in each microorganism
development stage. In logarithmic phase cell membrane is more sensitive to an
external factor because its continuous division (Pothakamury et al., 1996; Wouters
et al., 1999; Álvarez et al., 2000; Rodrigo et al., 2003 a). Wouters et al., (2001) did
not observe significant differences on membrane permeability after PEF treatment
between cells recovered in stationary and logarithmic phase. The authors admitted
that other factors could also affect PEF inactivation. Stationary phase cells adapt
better to stress conditions to assure their survival in the environment, causing
physiological changes that could induce to a greater resistance to PEF treatment.
2.5.5 PEF enzyme inactivation
Enzymes structure is formed by noncovalent bonds (hydrogen bonds,
electrostatic interactions, van der Waals forces and hydrophobic bonds) and in
some cases bisulphite bonds that provide great stability. Nevertheless, any change
might cause their denaturation (Ho et al., 1997). PEF treatment could impact such
interactions affecting the three-dimensional structure (secondary, tertiary and
quaternary) or the globular protein conformation. The difference in the enzyme
inactivation degree could be mainly related to the secondary and tertiary structure.
Different studies based on PEF enzyme inactivation have observed
conformational changes and alteration of protein helix alignment due to the
movement of charges produced by the PEF treatment. Zhang et al., (2005)
INTRODUCTION
40
observed loss in α-helix conformation content in a POD after combined PEF and
thermal treatment. Bendicho et al., (2003) observed perturbations in the charged
groups due to changes in the electric field value. This fact caused activity loss due
to the difficulty of active site-substrate union. Enzyme PEF resistance varies
depending on the number of hydrogen bonds and the perturbation around metal site
(Ca2+) necessary to maintain its activity.
Yang et al., (2004) observed the inactivation mechanism of several
enzymes by PEF concluding that increasing the size and complexity of the enzyme
structure was an indicator of a higher thermoresistance but not pulse-resistance.
Higher inactivation at higher electrical conductivity was also observed due to a
higher temperature increase for the same treatment conditions and higher ions flux
affecting to the enzyme electrostatic interactions. Despite of the results obtained,
the information about PEF inactivation of enzymes is very limited.
2.5.6 PEF advantages and disadvantages
2.5.6.1 Advantages
• Effective to inactivate pathogen and spoilage microorganisms.
• Synergy with moderate temperature, natural antimicrobials and pH.
• Similar shelf-life that conventional process but preserving better
vitamins and flavor.
• It allows continuous food processing.
• Similar energy consumption that thermal treatment in a counterflow
process.
2.5.6.2 Disadvantages
• High equipment and operation cost.
• Only valid for non-particulate and low electrical conductivity liquid
foods.

INTRODUCTION
41
• Unable for a sterilization process purpose.
2.6 ORANGE JUICE ENZYME ACTIVITY
2.6.1 Pectins
One of the most important physical characteristics of the orange juice is the
turbidity. This parameter is also called juice “cloud” and its loss causes an
important juice destabilization leading to a clarified juice with no commercial
value.
Juice contained in the orange fruit vacuoles does not present turbidity.
Turbidity comes from cell fragments colloidally dispersed in the juice
corresponding to the cell disruption at the extraction moment. Colloidal suspension
is composed by approximately 30% of proteins, 20% of hesperidins, 15% of
cellulose and hemicellulose, 5% of pectins and 30% unknown (Klavons et al.,
1987).
One of the most important components of the juice “cloud” are pectins.
Pectins are the juice natural colloid that contributes to the formation of turbidity,
keeping pulp particles in suspension. The total proportion of pectins in the juice
depends on the pressure used in the extraction and pulp residual content.
2.6.2 Pectolytic enzymes: pectin methyl esterase (PME)
The orange juice enzyme activity is mainly due to a pectolytic enzyme,
pectin methyl esterase (PME). PME is mainly found in the solid parts of the fruit
(pulp and juice cells) and subsequently in decreasing order in flavedo, albedo and
seeds.
PME is a high specific enzyme that catalyzes the hydrolysis of pectin
methylester groups (demethylation) releasing alcohol and pectinic acid. Due to this
reaction the pH diminishes increasing the quantity of free carboxyl groups and
producing methanol. This reaction has a great technological relevance in juice
industry processing producing colloidal unbalance destabilizing the suspension
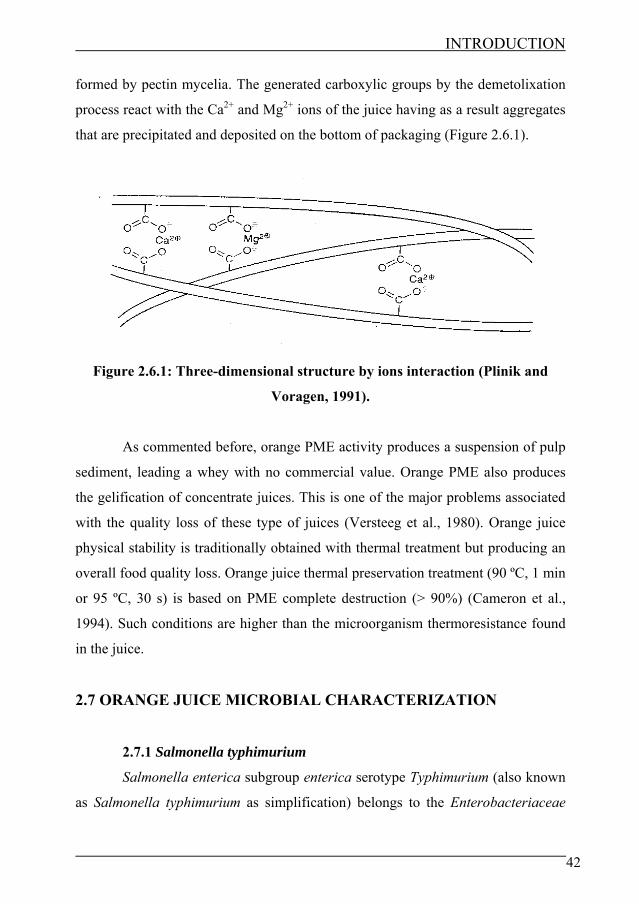
INTRODUCTION
42
formed by pectin mycelia. The generated carboxylic groups by the demetolixation
process react with the Ca2+ and Mg2+ ions of the juice having as a result aggregates
that are precipitated and deposited on the bottom of packaging (Figure 2.6.1).
Figure 2.6.1: Three-dimensional structure by ions interaction (Plinik and
Voragen, 1991).
As commented before, orange PME activity produces a suspension of pulp
sediment, leading a whey with no commercial value. Orange PME also produces
the gelification of concentrate juices. This is one of the major problems associated
with the quality loss of these type of juices (Versteeg et al., 1980). Orange juice
physical stability is traditionally obtained with thermal treatment but producing an
overall food quality loss. Orange juice thermal preservation treatment (90 ºC, 1 min
or 95 ºC, 30 s) is based on PME complete destruction (> 90%) (Cameron et al.,
1994). Such conditions are higher than the microorganism thermoresistance found
in the juice.
2.7 ORANGE JUICE MICROBIAL CHARACTERIZATION
2.7.1 Salmonella typhimurium
Salmonella enterica subgroup enterica serotype Typhimurium (also known
as Salmonella typhimurium as simplification) belongs to the Enterobacteriaceae

INTRODUCTION
43
family. Salmonella is a bacillus (1-2 μm), Gram-, facultative anaerobic, non spore-
forming and motive bacteria. Is a glucose fermentative microorganism releasing
acid and gas. Its optimum growth temperature is approximately 38ºC being able to
growth in a range of temperatures between 5 and 46ºC. It is a relatively
thermolabile microorganism and temperatures between 65-70ºC are enough to
inactivate it. Recently, it has been known that the most common Salmonella food
infection is caused by S. typhimurium (Forsythe et al., 2003).
It is estimated that 31% of USA annual food outbreaks belongs to
Salmonella (35.000 outbreaks cases per year) (IFT, 2004). S. typhimurium infection
does not cause a severe illness and normally is non-fatal. The illness is
characterized for causing diarrhoeas, abdominal aches, vomits, nauseas and mild
fever. The incubation period varies between 16-72 h and the sickness lasts between
2-7 days (Mossel, 2002).
The infective dose varies depending on the age and person health status,
food and Salmonella strain but in general varies between 20 and 106 CFU/mL
(Mossel, 2002) Unfortunately in immunedeficient people (elder people, children or
hospitalised people) Ssalmonella infection ends up with death if appropriate
treatment is not prescribed on time. The majority of Salmonella infections are
taking place in summer.
This microorganism is frequently found in food such as: 1) beef, poultry
and seafood; 2) nonpasteurized products such as egg products, milk and dairy
products; 3) other Salmonella-free food but contaminated with some of those
mentioned above (1 and 2). Lately, different cases of Salmonella contamination
have been found in orange juice (Cook et al., 1998; Castillo et al., 2006 and Khan
et al., 2007). The acid-tolerance of different Salmonella strains has been studied by
several researchers (Parish et al., 1997 and Ray, 2004 in orange juice; Pao et al.,
1998 on orange surface; Yuk and Schneider, 2006 in various fruit juices and
simulated gastric juice).

INTRODUCTION
44
Figure 2.7.1: Electron microscopy of Salmonella typhimurium (Mossel, 2002).
2.7.2 Lactobacillus plantarum
Lactobacillus plantarum is a non-starter homofermentative lactic bacteria
(NSLAB) belonging to streptobacterium family. L. plantarum is Gram+, non
spore-forming with no respiratory metabolism, microaerobic and catalase-
producing a viscosity increase during its growth. Lactobacillus genus is often
associated with diary products. It is often responsible of the final stages in lactic
fermentation due to its acid-tolerance growing at pH values less than 5.
Lactobacillus genus is rarely pathogen.
Within the spoilage microorganisms L. plantarum is frequently found in
fruit juice based products. It is characterized to convert additives found in fruit
juice such as malic and citric acid into lactic acid producing a sour flavor and taste
(Bay, 2004). Many authors have observed a high acid-tolerance (Pao and Davis,
2001; McDonald et al., 1990).

INTRODUCTION
45
Figure 2.7.2: Electron microscopy of Lactobacillus plantarum (Mossel, 2002).
2.7.3 Orange juice microbial safety
During last decades, natural squeezed juice has acquired great relevance. It
is prepared at the moment of purchasing or is storaged in a container in continuous
agitation without having any preservation treatment. In occasions, the hygienic
conditions are not appropriate (inadequate cleaning surfaces and equipments and
inappropriate orange storage) leading to a pathogen inoculation through cross-
contamination having as a result a public health problem.
In the latest years the United States have suffered pathogen
microorganism’s outbreaks in non-pasteurized orange juice. Salmonella Hartford,
Bacillus cereus, Clostridium botulinum and Escherichia coli 0157:H57 were
detected in non-pasteurized orange juice, causing 66 infection cases and the death
of a child (Morris, 1998). The survival in acid environments is considered unlikely
probable. However recent studies have showed that some E. coli strains, including
three pathogens of 0157:H7 and various Salmonella strains (including S.
typhimurium) have become acid-tolerant and thermoresistant after a previous
adaptation at pH=5, as it possible occurs in orange juice processing (Morris, 1998).
Due to these facts, the FDA (USA Food and Drug Administration)
proposed the implantation of a HACCP system in the entire non-pasteurized fruit
juice processing. It should be also included an information label indicating that the

INTRODUCTION
46
juice had not been processed to guarantee pathogen destruction. It was also
recommended an educational programme for industries and consumers in order to
minimize the risk associated to fresh juice consumption. After that, FDA made
public a regulation indicating that the process that could obtain an equivalent
reduction of five log cycles of E. coli, could guarantee microbiological safety of
those products. The above came up at the end of 1998 and with the available
information thermal pasteurization was the unique procedure to obtain such
inactivation level (Morris, 1998). However, the regulation was only applied at
industrial level leaving aside bars, restaurants and other groups where non-
pasteurized juice is sold.
As stated earlier, the application of a mild thermal pasteurization process
produces overall quality loss avoiding using by companies the term “fresh” to
satisfy consumer tendencies. A possible solution to this crisis might come by the
application of a nonthermal food process, such as High Hydrostatic Pressure (HHP)
or Pulsed Electric Field (PEF)
2.8 INACTIVATION KINETIC MODELS
Generally the use of survival/inactivation curves has been extended since
years to study microbial resistance, enzyme inactivation and quality factor
degradation kinetics to different lethal agents. These survival/inactivation curves
represent the survivors/enzyme activity/compound concentration number against
the treatment. These graphs are often described through several mathematic models
from which different parameters are obtained allowing the quantification and
prediction of bacterial resistance/enzyme inactivation.
The acquisition of these kinetic parameters is basic in the development of a
food preservation process. The industrial practical application of microbial
modelling comes from optimising the process conditions, improving food safety
and allowing starting up a HACCP plan. Lately, food safety policies have been
designed by different European governments and Food safety Agencies (European
and Spanish) based on microbiological risk analysis studies. Within these studies,

INTRODUCTION
47
predictive microbiology and inactivation kinetic models are playing a fundamental
role.
2.8.1 Microorganism inactivation kinetic models
2.8.1.1 Bigelow
Classic kinetic models suppose a linear relation between the survivors
fraction and treatment time. The model developed by Bigelow, (1921) has been
mainly used to explain survival curves by thermal treatment:
DtSLog −=)( Equation 2.8.1
where S is the survival fraction calculated as the relation between the
survivors after the treatment (N) and the initial number of microorganisms (N0), t is
the treatment time and D is the kinetic parameter, showing the time required to
achieve one decimal reduction and it can be calculated as the negative inverse of
the inactivation curve slope.
The evidence of deviations from the traditional models with the appearance
of shoulders and tailing phenomena in the survival curves have been observed in
PEF treatment (Figure 2.8.1). The validity of Bigelow model for interpreting PEF
kinetic inactivation data should be evaluated.
2.8.1.2 Hülsheger
The pioneers on microbial mathematical modelling were Hülsheger and
Niemann (1980). The model was based on the survivors fraction dependency (S),
treatment time (t) and critical treatment time (tc) for which S=1, according to the
following relationship:
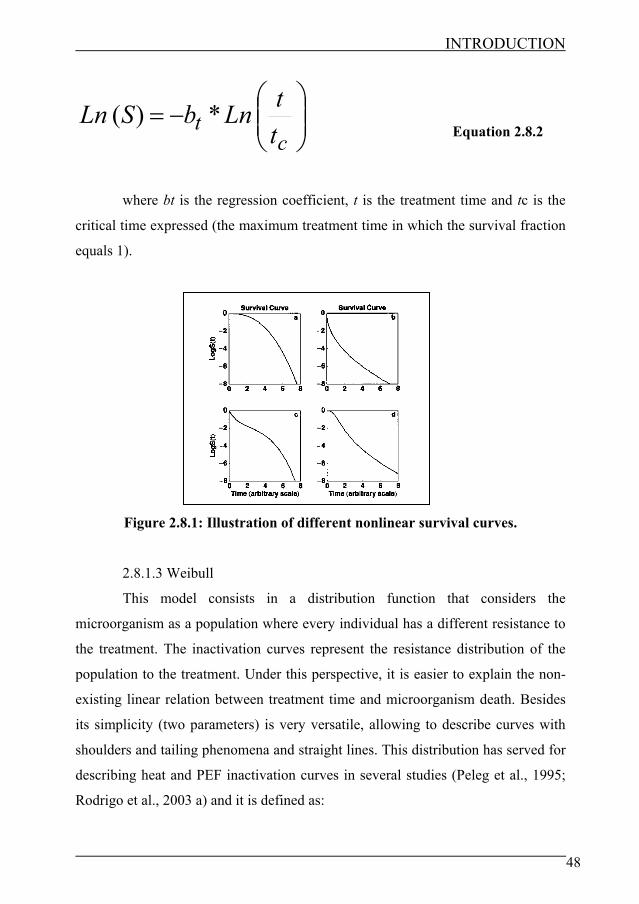
INTRODUCTION
48
⎟⎟⎠
⎞⎜⎜⎝
⎛−=
ct t
tLnbSLn *)( Equation 2.8.2
where bt is the regression coefficient, t is the treatment time and tc is the
critical time expressed (the maximum treatment time in which the survival fraction
equals 1).
Figure 2.8.1: Illustration of different nonlinear survival curves.
2.8.1.3 Weibull
This model consists in a distribution function that considers the
microorganism as a population where every individual has a different resistance to
the treatment. The inactivation curves represent the resistance distribution of the
population to the treatment. Under this perspective, it is easier to explain the non-
existing linear relation between treatment time and microorganism death. Besides
its simplicity (two parameters) is very versatile, allowing to describe curves with
shoulders and tailing phenomena and straight lines. This distribution has served for
describing heat and PEF inactivation curves in several studies (Peleg et al., 1995;
Rodrigo et al., 2003 a) and it is defined as:

INTRODUCTION
49
b
atSLn ⎟⎠⎞
⎜⎝⎛−=)(
Equation 2.8.3
where t is the treatment time, a and b are scale and shape parameters,
respectively. The b value gives an idea of the form of the curve, if b>1 the curve is
concave upwards (it forms shoulders) indicating some activation phenomenon is
produced or higher treatment resistance at the initial stage. If b<1 the curve is
concave downwards (it forms tails) indicating that survival fraction is the most
resistant to the treatment conditions. If b=1 the curve is a straight line and can be
described by linear models indicating that every cell has the same resistance to the
treatment
Other kinetic parameter used from the Weibull equation is the mean critical
time ( tcw ) that can be defined by the time when microorganism death is high in
response to the PEF treatment, expressed by the following equation:
⎟⎠⎞⎜
⎝⎛ −+Γ= 11* bacwt Equation 2.8.4
where a and b are the parameters of the Weibull equation and Γ is the
gamma function.
2.8.2 Enzyme inactivation kinetic models
2.8.2.1 Primary models
Traditionally linear models have been applied to describe enzyme
inactivation kinetics by heat, obtaining parameters such as D and z values
(described later). However, in the case of different enzymes thermal inactivation
curves have been observed to behave differently due to the presence of different
fractions exhibiting different stabilities (Hou et al., 1997; Lee et al., 2003;
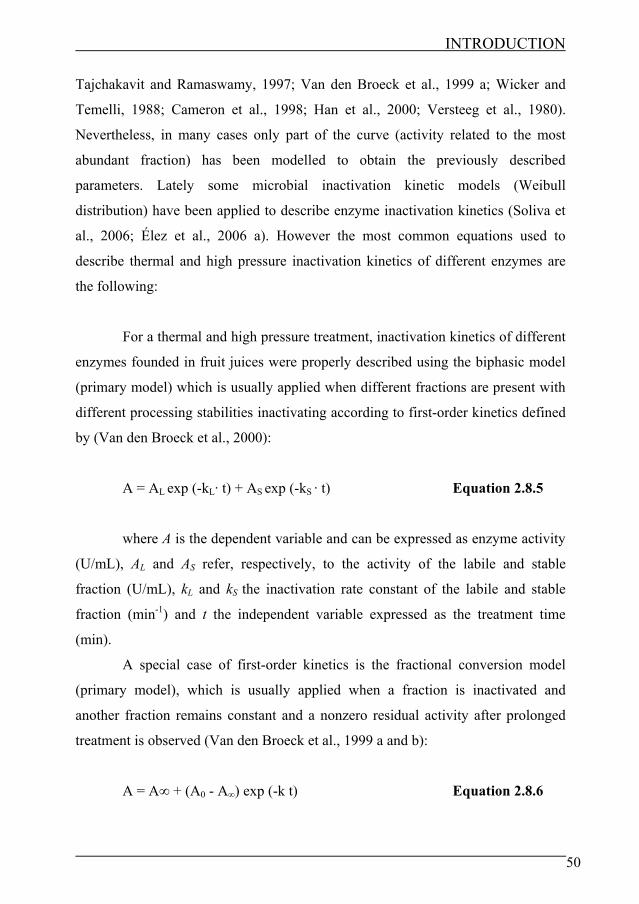
INTRODUCTION
50
Tajchakavit and Ramaswamy, 1997; Van den Broeck et al., 1999 a; Wicker and
Temelli, 1988; Cameron et al., 1998; Han et al., 2000; Versteeg et al., 1980).
Nevertheless, in many cases only part of the curve (activity related to the most
abundant fraction) has been modelled to obtain the previously described
parameters. Lately some microbial inactivation kinetic models (Weibull
distribution) have been applied to describe enzyme inactivation kinetics (Soliva et
al., 2006; Élez et al., 2006 a). However the most common equations used to
describe thermal and high pressure inactivation kinetics of different enzymes are
the following:
For a thermal and high pressure treatment, inactivation kinetics of different
enzymes founded in fruit juices were properly described using the biphasic model
(primary model) which is usually applied when different fractions are present with
different processing stabilities inactivating according to first-order kinetics defined
by (Van den Broeck et al., 2000):
A = AL exp (-kL· t) + AS exp (-kS · t) Equation 2.8.5
where A is the dependent variable and can be expressed as enzyme activity
(U/mL), AL and AS refer, respectively, to the activity of the labile and stable
fraction (U/mL), kL and kS the inactivation rate constant of the labile and stable
fraction (min-1) and t the independent variable expressed as the treatment time
(min).
A special case of first-order kinetics is the fractional conversion model
(primary model), which is usually applied when a fraction is inactivated and
another fraction remains constant and a nonzero residual activity after prolonged
treatment is observed (Van den Broeck et al., 1999 a and b):
A = A∞ + (A0 - A∞) exp (-k t) Equation 2.8.6

INTRODUCTION
51
where A is the dependent variable and can be expressed as enzyme activity
(U/mL), A0 and A∞ refer, respectively, to the initial enzyme activity and to the
residual activity after prolonged treatment time (U/mL), k the inactivation rate
constant (min-1) and t the independent variable expressed as the treatment time
(min).
2.8.2.2 Secondary models
The temperature dependence of inactivation rate constants of the different
fractions can be estimated using the Arrhenius model (secondary model)
(Arrhenius, 1889):
⎥⎦
⎤⎢⎣
⎡⎟⎟⎠
⎞⎜⎜⎝
⎛−+=
TTREkk aL
LoL11)ln()ln(
0 Equation 2.8.7
⎥⎦
⎤⎢⎣
⎡⎟⎟⎠
⎞⎜⎜⎝
⎛−+=
TTREkk aS
Sos11)ln()ln(
0 Equation 2.8.8
where ln(kL) and ln(kS) are the dependent variables and are expressed as the
inactivation rate constant of the labile and stable fraction, respectively (min-1), EaL
and EaS are the activation energy of the labile and stable fraction respectively
(kJ/mol), kL0 and kS0 the inactivation rate constant at a reference temperature of the
labile and stable fraction, respectively (min-1), T is the independent variable
expressed as the absolute temperature (K), T0 the reference temperature (K) and R
(8.314 J/mol K) is the universal gas constant.
The pressure dependence of the enzyme inactivation rate constants at a
constant temperature of different fractions can be calculated using the linearized
Eyring equation (secondary model) (Eyring, Johnson, & Gensler, 1946):
( )⎥⎦⎤
⎢⎣⎡ −+= ref
aLLoL PP
RTVkk )ln()ln( Equation 2.8.9
⎥⎦
⎤⎢⎣
⎡⎟⎟⎠
⎞⎜⎜⎝
⎛−+=
TTREkk aS
Sos11)ln()ln(
0 Equation 2.8.10

INTRODUCTION
52
where kL and kS are the dependent variables and are expressed as the
inactivation rate constant of the labile and stable fraction respectively (min-1), VaL
and VaS are the activation volume of the labile and stable fraction, respectively
(cm3/mol), kL0 and kS0 are the inactivation rate constant at a reference pressure of
the labile and stable fraction, respectively (min-1), T is the absolute temperature
(K), P is the independent variable expressed as the pressure (MPa), Pref is the
reference pressure (MPa) and R (8.314 J/mol K) is the universal gas constant.
2.8.3 z parameter
This parameter has been frequently used in microorganism and enzyme
thermal inactivation. It describes the primary parameter variation (secondary
parameter). Generally it has been used to describe the variation of D parameter
toward an external factor such as temperature, pH, aw, among others. It is obtained
from the logarithm of D values at different temperatures as the negative inverse of
curve slope. It can be also calculated by the following equation (secondary model):
( ) ( )zTT
DLogDLog 1
21
21 =−−
Equation 2.8.11
where D is the decimal reduction time defined as the time required to achieve
one decimal reduction and T the temperature (ºC).
z parameter could also be used to describe the variation of other kinetic
parameters such as a and tcw of Weibull model or tc of Hülsheger model among
others. Further discussion is presented in this doctoral thesis.
2.8.4 Model fit validity
A least square procedure was used to fit the models to the experimental
data. This method consists basically on searching the parameters values that
minimize the sum of squares of residuals between experimental and predicted
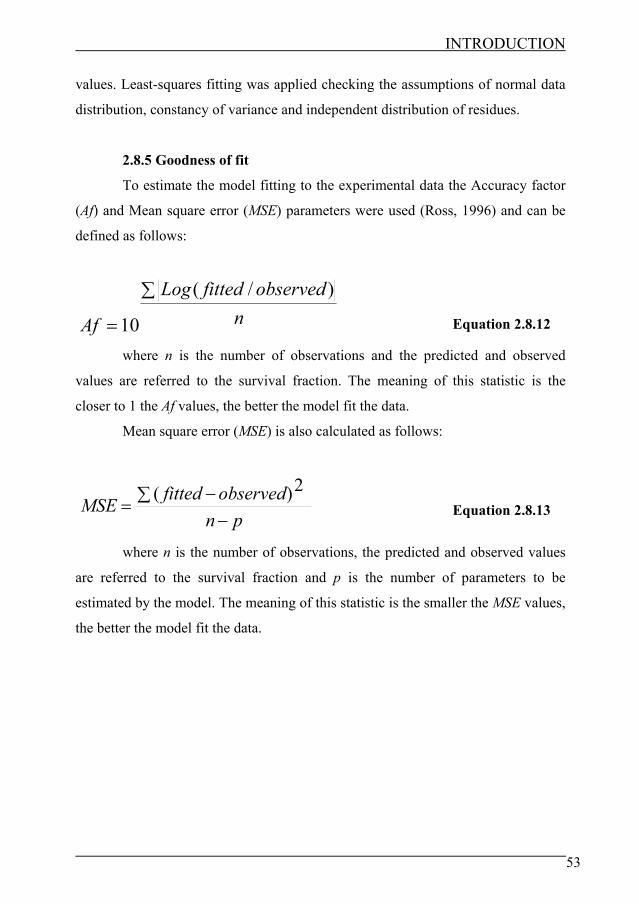
INTRODUCTION
53
values. Least-squares fitting was applied checking the assumptions of normal data
distribution, constancy of variance and independent distribution of residues.
2.8.5 Goodness of fit
To estimate the model fitting to the experimental data the Accuracy factor
(Af) and Mean square error (MSE) parameters were used (Ross, 1996) and can be
defined as follows:
nobservedfittedLog
Af
∑
=
)/(
10 Equation 2.8.12
where n is the number of observations and the predicted and observed
values are referred to the survival fraction. The meaning of this statistic is the
closer to 1 the Af values, the better the model fit the data.
Mean square error (MSE) is also calculated as follows:
pnobservedfittedMSE−
∑ −=
2)( Equation 2.8.13
where n is the number of observations, the predicted and observed values
are referred to the survival fraction and p is the number of parameters to be
estimated by the model. The meaning of this statistic is the smaller the MSE values,
the better the model fit the data.

2.-OBJECTIVES


OBJECTIVES
56
The through knowledge of the state of art of the different nonthermal technologies
and juice processing industry leaded to the definition of the main objective of the
present doctoral thesis based on the application of a combined PEF, HHP and
thermal processing in a new beverage based on the mixture of orange juice and
milk. To reach such objective, the following partial objectives were proposed:
• Preparation and physicochemical and sensorial characterization of a new
product based on orange juice and milk.
• Study the PME inactivation and volatile compounds content loss by HHP,
PEF and thermal treatment in the orange juice-milk based product.
• Obtain the combined HHP and thermal inactivation kinetics of pectin
methyl esterase (PME) in the orange juice-milk based product.
• Study the influence of PEF processing variables on the inactivation of L.
plantarum in the orange juice-milk based product.
• Obtain the combined PEF and thermal inactivation kinetics of a spoilage
microorganism (Lactobacillus plantarum) in the orange juice-milk based
product.
• Obtain PEF inactivation kinetics of a pathogen microorganism (Salmonella
typhimurium) based on the influence of food characteristics such as pH and
stabilizer concentration in the orange juice-milk based product.
• Study the shelf-life of the orange juice-milk based product after PEF and
thermal treatment at refrigeration conditions.


3.-RESULTS

Development of a new product
based on orange juice and milk
ideal for PEF processing


Orange juice-milk product RESULTS
60
Sampedro, F., Rivas, A., Rodrigo, D., Martínez, A. and Rodrigo, M.
Instituto de Agroquímica y Tecnología de Alimentos, CSIC,
Apartado postal 73,
46100 Burjassot, Valencia, Spain
Keywords: Orange juice; Milk; Formulation; Sensory analysis; E. coli; PEF
4.1.1 ABSTRACT A new product based on the mixture of orange juice and milk suitable for Pulsed Electric Field
(PEF) processing was developed. New methodology was established and four formulations were chosen based on orange juice concentration (15, 25, 50 and 70%). The election of the final
formulation was based on the physicochemical characteristics, PEF inactivation of E. coli and sensorial evaluation. E. coli inactivation degree was lesser by increasing orange juice
concentration due to a conductivity and viscosity sample increase but without significant differences between 15, 25 and 50% samples (p>0.05). There were no significant differences
among the 50 and 70% samples on aspect, viscosity and global appreciation sensory parameters. The 50% sample was chosen as the most appropriate for PEF treatment due to its adequate inactivation degree, appropriate physicochemical characteristics and good sensorial
acceptance.

Orange juice-milk product RESULTS
61
4.1.2 INTRODUCTION
Acidified milk drinks comprise a large range of products, from those
usually prepared from fermented milk with stabilizers and sugar to those prepared
by direct acidification with fruit juices and/or acids. The pH of these products
ranges from 3.4 to 4.6 and because of the instability of caseins in this pH range, a
stabilizer needs to be added to prevent protein aggregation and achieve optimal
mouth feel (Nakamura et al., 2006).
Caseins at neutral pH in milk are present in the form of micelles, and these
protein particles are stabilized by steric repulsive interactions. During acidification,
at a pH around the isoelectric point (pH 4.6) the micelles aggregate, mainly
because of the collapse of the extended layer formed by κ-casein on the surface of
the micelle (De Kruif, 1998). At a pH below their isoelectric points, milk proteins
are positively charged; negatively charged pectins are employed as stabilizers in
products such as acidified milk drinks and yoghurt (Pereyra et al., 1997).
Pectin, an anionic polysaccharide generally extracted from citrus fruits or
apple pomace, is mainly composed of a backbone of galacturonic acid, partly
methyl esterified, and by hairy regions containing rhamnose, galactose, arabinose,
xylose, and glucose. It has been demonstrated that, below pH 5.0, the
polysaccharide chains of high methoxyl pectin (HMP) adsorb on the surface of the
casein micelles, via the charged blocks of the pectin chains and the uncharged
blocks of HMP extend into solution contributing to stabilization via steric repulsion
(Pereyra et al., 1997).
The initial characteristics of an orange juice-milk based product to be
suitable for PEF processing should be the following: i) juice concentration that
provide an important Vit-C supply ii) simplest product as possible iii) good
sensorial acceptance; iv) adequate physicochemical characteristics (low electrical
conductivity and viscosity that allows an adequate flow rate) and with no
suspension particles.
Recent foodborne E. coli outbreaks involving apple cider, fresh apple juice
and orange juice have highlighted the acid-tolerance and probable low infective

Orange juice-milk product RESULTS
62
dose of this pathogen (Zhao et al., 1993; Parish et al., 1997; Cook et al., 1998;
Sivapalasingam et al., 2004). These findings strengthen the need to carry out
extensive studies in order to check the nature of death of E. coli in an acid food
pasteurized by using PEF technology. FDA made public a new regulation based on
the requirement of an equivalent five log cycles reduction of E. coli in these
products to guarantee their microbiological safety (Morris, 1998).
The objective of the present study was to develop a new beverage based on
the mixture of orange juice and milk suitable for a PEF treatment.
4.1.3 MATERIALS AND METHODS
4.1.3.1 Composition and product physicochemical characterization
The product was composed by pasteurized orange juice from squeezed
oranges (García-Carrión, Spain) kept frozen until used (the pulp was removed),
commercial UHT skimmed milk, high methoxyl citrus pectin such as stabilizer
(Unipectine AYD 250, Cargill, USA), commercial citric acid, sugar, and distilled
water .
The physicochemical characterization of the product was based on the
following parameters: electrical conductivity (Crison 525 conductimeter, Crison
Instruments, Spain), pH (Crison 2001 pHmeter, Crison Instruments, Spain), Brix
degrees (Atago RX-1000 digital refractometer, Atago Company, Japan) and
viscosity (Haake VT5 Viscotester, Thermo Electron Corporation, UK).
4.1.3.2 PEF treatment
An OSU-4D bench-scale continuous processing unit was used to treat the
food sample. Six co-field chambers with a diameter of 0.23 cm and a gap distance
of 0.293 cm between electrodes were connected in series. One cooling coil was
connected before and after each pair of chambers and submerged in a circulating
bath (Polystat, Cole Parmer, USA) to maintain the selected initial temperature at
35ºC (60ºC maximum temperature of the treatment). The temperature was recorded

Orange juice-milk product RESULTS
63
by thermocouples (T type) at the entrance and exit of each pair of chambers. The
first treatment chamber can be considered as the initial temperature and the exit of
the last treatment chamber as the final temperature. The values were recorded with
a data logger (Control Company, USA). Pulse waveform, voltage and current in the
treatment chambers were monitored with a digital oscilloscope (Tektronix TDS
210, Tektronix, USA). The flow rate was set at 60 mL/min with a peristaltic pump
(XX 80002 30, 6-600 r.p.m., Millipore, USA). A bipolar square-wave of 2.5 μs
was selected. Treatment time ranged from 0 to 110 μs and the electric field was set
at 40 kV/cm. Samples were collected after each treatment time. They were serially
diluted in sterile 0.1% peptone water, plated in Nutrient Broth Agar, and incubated
for 24 h at 37ºC. The beverage was inoculated with the contents of a thawed E. coli
at a final concentration of approximately 106 CFU/mL.
4.1.3.3 Escherichia coli
Escherichia coli CECT 516 (ATCC 8739) was obtained from the Spanish
Type Culture Collection (Valencia, Spain). This strain has been used in previous
PEF studies, in apple and orange-carrot juices (Evrendilek et al., 1999; Rodrigo, et
al., 2003 a; Selma et al., 2004), and its ability to grow under acidic conditions has
been proved (Evrendilek, et al., 1999). Cells were obtained according to Rivas et
al., (2006). For that, the culture was inoculated in nutrient broth (NB) (Scharlab
Chemie, Spain) and incubated at 37ºC with continuous agitation at 200 rpm for 4 h
to obtain the cells in the exponential growth stage. The cells were centrifuged twice
at 3220 g at 4ºC for 15 min and then resuspended in NB. After the second
centrifugation the cells were resuspended in NB with 20% glycerol and then
dispensed in 2-mL vials. The 2-mL vials were immediately frozen and stored at -
80ºC until needed.
4.1.3.4 Sensory analysis
A panel of 53 untrained assessors evaluated the differences in aspect,
flavor, viscosity and global preference among samples by ranking test (ISO, 1988
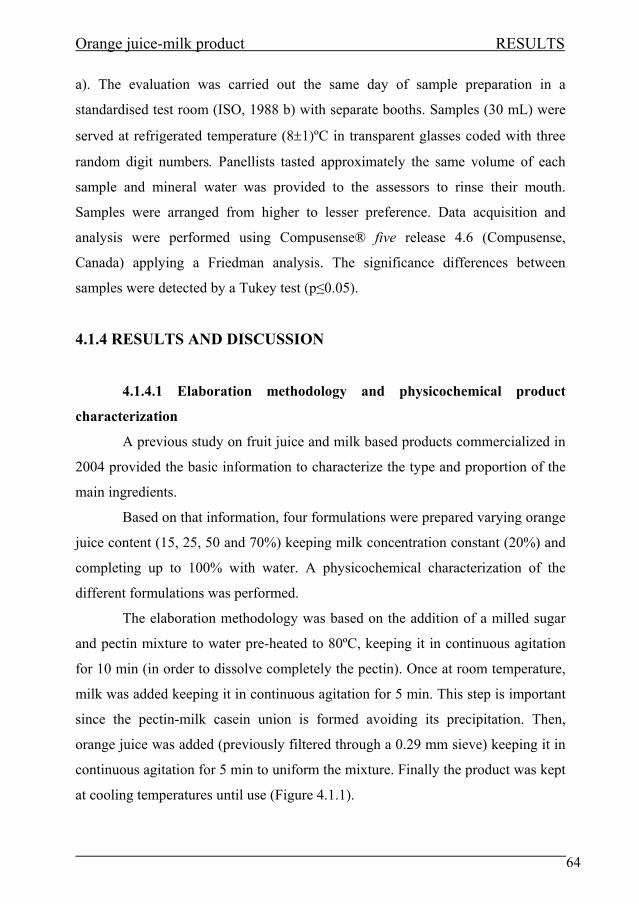
Orange juice-milk product RESULTS
64
a). The evaluation was carried out the same day of sample preparation in a
standardised test room (ISO, 1988 b) with separate booths. Samples (30 mL) were
served at refrigerated temperature (8±1)ºC in transparent glasses coded with three
random digit numbers. Panellists tasted approximately the same volume of each
sample and mineral water was provided to the assessors to rinse their mouth.
Samples were arranged from higher to lesser preference. Data acquisition and
analysis were performed using Compusense® five release 4.6 (Compusense,
Canada) applying a Friedman analysis. The significance differences between
samples were detected by a Tukey test (p≤0.05).
4.1.4 RESULTS AND DISCUSSION
4.1.4.1 Elaboration methodology and physicochemical product
characterization
A previous study on fruit juice and milk based products commercialized in
2004 provided the basic information to characterize the type and proportion of the
main ingredients.
Based on that information, four formulations were prepared varying orange
juice content (15, 25, 50 and 70%) keeping milk concentration constant (20%) and
completing up to 100% with water. A physicochemical characterization of the
different formulations was performed.
The elaboration methodology was based on the addition of a milled sugar
and pectin mixture to water pre-heated to 80ºC, keeping it in continuous agitation
for 10 min (in order to dissolve completely the pectin). Once at room temperature,
milk was added keeping it in continuous agitation for 5 min. This step is important
since the pectin-milk casein union is formed avoiding its precipitation. Then,
orange juice was added (previously filtered through a 0.29 mm sieve) keeping it in
continuous agitation for 5 min to uniform the mixture. Finally the product was kept
at cooling temperatures until use (Figure 4.1.1).

Orange juice-milk product RESULTS
65
Results of physicochemical characterization are shown in Table 4.1.1. An
increase in the orange juice content produced a decrease in the pH value while
increasing the electrical conductivity and Brix degrees. Viscosity increased above
50% formulation. The most important physicochemical parameter on PEF
treatment is the electrical conductivity because high values (>3.0 mS/cm) make
difficult the application of the treatment. A viscosity increase also make difficult to
obtain an adequate working flow-rate (120 mL/min, laminar-turbulent). As a result
of the physicochemical characterization all formulations would be adequate for
PEF treatment except the 70% sample due to its high viscosity and electrical
conductivity.
4.1.4.2 Effect of food composition on PEF inactivation of E.coli
Figure 4.1.2 shows PEF inactivation degree of E. coli in the different
formulations. It was observed an increase in the inactivation by decreasing the
juice content, possibly due to a lower electrical conductivity, Brix degrees and
viscosity. However, no significant differences among the 15, 25 and 50% samples
were found (Table 8.2.1). In conclusion, based on microbial inactivation the three
previously described formulations would be adequate for PEF treatment.
4.1.4.3 Sensory analysis
Table 4.1.2 shows the samples ranking based on the sensorial evaluation in
relation to the aspect, flavor, viscosity and global appreciation. A lesser
punctuation is an indicator of a greater acceptance. The greater acceptance sample
in all the parameters studied was the 50% juice content, showing no significant
differences with the 70% sample in aspect, viscosity and global appreciation
(p>0.05). There were no significant differences between 70% and 25% samples
(p>0.05) in global appreciation. In relation to the sensorial evaluation the 50%
juice sample is the more suitable for PEF treatment.
Facing the results, it is concluded that the product with 50% juice content
is the one that provide all suitable conditions for PEF treatment due to the

Orange juice-milk product RESULTS
66
inactivation level obtained, physicochemical characteristics and sensorial
evaluation. This formulation will be used in the present doctoral thesis for the
inactivation kinetic studies.
Figure 4.1.1: Orange juice-milk based product.
-2.5
-2.0
-1.5
-1.0
-0.5
0.0
0 20 40 60 80 100 120
Treatment time (µs)
Log
(S)
15%
25%
50%
70%
Figure 4.1.2: Effect of food composition on PEF inactivation of E. coli at 40
kV/cm. The standard deviation was expressed by error bars.
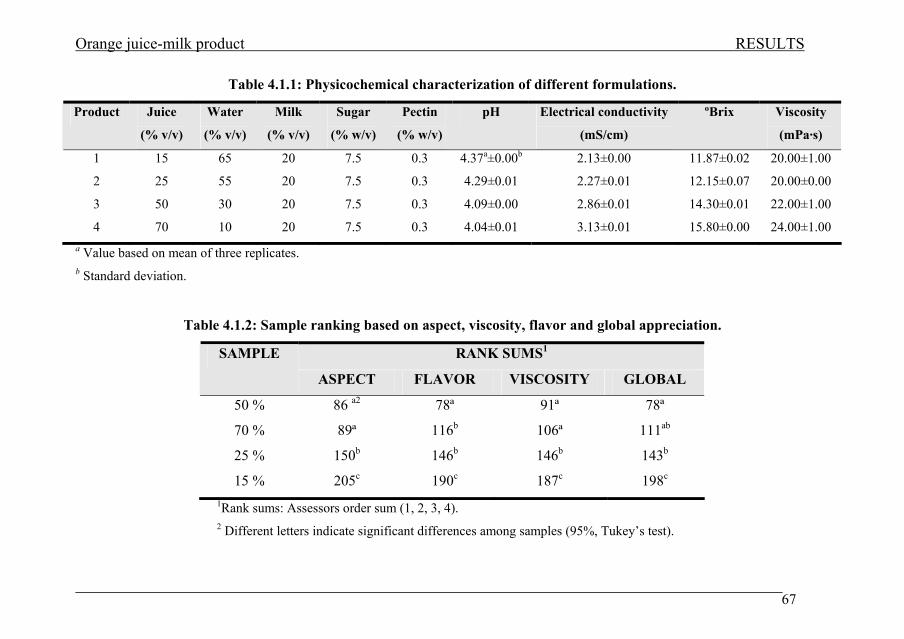
Orange juice-milk product RESULTS
67
Table 4.1.1: Physicochemical characterization of different formulations.
Product Juice
(% v/v)
Water
(% v/v)
Milk
(% v/v)
Sugar
(% w/v)
Pectin
(% w/v)
pH Electrical conductivity
(mS/cm)
ºBrix Viscosity
(mPa·s)
1 15 65 20 7.5 0.3 4.37a±0.00b 2.13±0.00 11.87±0.02 20.00±1.00
2 25 55 20 7.5 0.3 4.29±0.01 2.27±0.01 12.15±0.07 20.00±0.00
3 50 30 20 7.5 0.3 4.09±0.00 2.86±0.01 14.30±0.01 22.00±1.00
4 70 10 20 7.5 0.3 4.04±0.01 3.13±0.01 15.80±0.00 24.00±1.00 a Value based on mean of three replicates. b Standard deviation.
Table 4.1.2: Sample ranking based on aspect, viscosity, flavor and global appreciation.
RANK SUMS1 SAMPLE
ASPECT FLAVOR VISCOSITY GLOBAL
50 % 86 a2 78ª 91ª 78ª
70 % 89ª 116b 106ª 111ab
25 % 150b 146b 146b 143b
15 % 205c 190c 187c 198c 1Rank sums: Assessors order sum (1, 2, 3, 4). 2 Different letters indicate significant differences among samples (95%, Tukey’s test).
Effect of PEF, HHP and thermal
treatment on PME inactivation
and volatile compounds of an
orange juice-milk based beverage


Effect of PEF, HHP and thermal on PME and aroma RESULTS
69
Sampedro, F1., Geveke, D. J.2., Fan, X2. and Zhang, Q.H2.
1Institute of AgroChemistry and Food Technology, CSIC, P.O. Box 73, 46100
Burjassot, Valencia, Spain. 2Eastern Regional Research Center, Agricultural Research Service, United States
Department of Agriculture, 600 East Mermaid Lane, Wyndmoor, PA 19038, USA.
Keywords: PEF; HHP; PME; Orange juice; Milk; Volatile compounds
4.2.1 ABSTRACT The effects of thermal, pulsed electric field (PEF) and high hydrostatic pressure (HHP)
processing on pectin methyl esterase (PME) activity and volatile compounds concentration in an orange juice-milk beverage (OJMB) were studied. Thermal treatment (85 ºC for 1 min) and combined thermal and PEF treatment (25 kV/cm at 65 ºC initial temperature) or thermal and HHP treatment (650 MPa at 50 ºC initial temperature) were needed to inactivate 90% of PME revealing the resistance of orange PME to the different preservation methods. At 25ºC PME activity was enhanced after PEF treatment. Twelve volatile compounds were extracted by SPME and selected for quantification by GC-MS following the application of the different treatments. The average loss in concentration of volatile compounds was between 16.0 and
43.0% after thermal treatment depending on the temperature. After PEF treatment the
average loss was between -13.7 and 8.3% at an initial temperature of 25 ºC depending on electric field strengths, 5.8 to 21.0% at 45 ºC and 11.6 to 30.5% at 65 ºC. After HHP
treatment the average loss was between -14.2 to 7.5% at an initial temperature of 30 ºC depending on the pressure levels and 22.9 to 42.3% at 50 ºC. The results showed the
potential of the nonthermal technologies in providing food with a higher standard of quality compared to thermal processing.

Effect of PEF, HHP and thermal on PME and aroma RESULTS
70
4.2.2 INTRODUCTION
The use of High Hydrostatic Pressure (HHP) as a food preservation
technology is gaining relevance in recent years, especially in Japan where the use
of HHP has been adopted for the preservation of fruit juices, jams, sauces, rice,
cakes and desserts (Norton and Sun, 2007). Nowadays in Europe and the USA,
several companies in the meat, dairy and beverage industry have commercialized
HHP treated products and it is thought that this trend will increase (Trujillo et al.,
2002). Regarding the use of Pulsed Electric Fields (PEF), different research groups
are working on the use of PEF for preservation of fruit and vegetable juices, milk
and liquid egg (Sampedro et al., 2005; Rodrigo et al., 2005; Sampedro et al., 2006).
The use of PEF by the juice processing industry is now becoming a reality in the
USA where several types of fruit juices treated by PEF have been commercialized
(Clark, 2006).
A large quantity of minimally processed foods have appeared on the
market with characteristics similar to the original fresh food in response to a
growing demand for natural foods that are perceived by consumers as healthy.
Among them are beverages based on a mix of fruit juices and milk fortified with
vitamins, minerals, and fiber as the most widely consumed functional foods
(Pszczola, 2005); however, there are limited data related to quality and safety of
these products.
Pectin Methyl Esterase (PME) is an important enzyme in orange juice
based products and PME spoilage effects in orange juice are well known as cloud
loss or gelification of juice concentrates (Tribess and Tadini, 2006). Thermal
preservation treatments (88-95 ºC, 15-30 s) are based on the PME inactivation level
achieved (>90%) due to its higher thermotolerance than those of majority of
microorganisms found naturally in these products (Irwe and Olson, 1994). Due to
the nature of the product (juice-milk mixture) a residual PME activity could
instabilize the system.
The analysis of the volatile compounds has been performed by several
authors to study the effect of PEF, thermal and HHP treatment on orange juice

Effect of PEF, HHP and thermal on PME and aroma RESULTS
71
aroma (Jia et al., 1999; Yeom et al., 2000; Ayhan et al., 2002; Min et al., 2003;
Baxter et al., 2005) but there is no study on the effect of PEF and HHP treatment
on the volatile compounds in a mixture of orange juice and milk.
The aim of this work was to study the effects of PEF, HHP and thermal
processes on PME activity and volatile compounds in an orange juice-milk based
beverage.
4.2.3 MATERIAL AND METHODS
4.2.3.1 Beverage preparation
Fresh Valencia var. oranges were purchased at a local supermarket. The
oranges were squeezed with a juice extractor (Zumex 38, Zumex, S.A., Spain) and
the juice was filtered with cheese cloth and stored at -40 ºC. The OJMB contained
the following ingredients: fresh orange juice (500 mL/L), commercial UHT
skimmed milk (200 mL/L), high methoxyl citrus pectin (Unipectine AYD 250,
Cargill, USA) (3 g/L), sucrose (75 g/L), and deionized water (300 mL/L). Prior to
mixing, solid ingredients were dissolved in water in the weight proportions
indicated. The beverage was prepared just before use. The OJMB preparation and
physicochemical characteristics were described in Chapter 1.
4.2.3.2 Thermal treatment
Isothermal inactivation experiments were carried out in a water bath with
temperature control, in a range from 60-90 ºC for 1 min. One mL of sample was
enclosed in a 1 mL thermal death time (TDT) disk (Jin et al., 2007). The samples
were preheated to 40 ºC (results indicated that no PME inactivation was produced
at this temperature, data not shown) in order to shorten and standardize the come-
up time. The time needed to reach the final temperatures from the preheating
temperature of 40 ºC was about 1 min. After treatment at the preset temperatures,
the samples were withdrawn from the water bath and immediately cooled and kept
in ice-water. The residual PME activity was measured within 2 h.

Effect of PEF, HHP and thermal on PME and aroma RESULTS
72
4.2.3.3 PEF treatment
An OSU-4F bench-scale continuous unit (Ohio State University, USA) was
used to provide PEF treatment. Six co-field chambers with a diameter of 0.23 cm
and a gap distance of 0.29 cm between electrodes were connected in series. One
cooling coil was connected before and after each pair of chambers and submerged
in a circulating bath (model 1016S, Fisher Scientific, PA, USA) to maintain the
selected temperature (25, 45 and 65 ºC). The temperature was recorded by
thermocouples (K type) at the entrance and exit of each pair of chambers. The
entrance of the first treatment chamber can be considered as the initial temperature
and the exit of the last treatment chamber as the final temperature. The values were
recorded with a data logger (Model 800024, Sper Scientific, Taiwan). Pulse
waveform, voltage, and current in the treatment chambers were monitored with a
digital oscilloscope (Tektronix TDS 210, USA). The flow rate (120 mL/min) was
controlled with a digital gear pump (Model 75211-30, Cole Parmer, USA). A
bipolar square-wave of 2.5 µs was selected. Treatment time was set at 50 μs and
the electric field at 15, 20, 25 and 30 kV/cm. One sample was collected after each
treatment time and immediately cooled in ice-water.
4.2.3.4 HHP treatment
All pressure experiments were performed in a laboratory-scale vessel high-
pressure processor (model 2L, Autoclave Systems Inc., USA). Combined thermal
and high-pressure treatments were applied in the range of 450-650 MPa at initial
temperatures of 30 and 50 ºC. The pressure medium was deionized water. A
thermostated mantel, which surrounded the vessel, was connected to a cryostat
keeping the vessel wall temperature constant during the experiment. Temperature
was recorded by a thermocouple placed inside the vessel. The samples were filled
in 2 mL eppendorf tubes and were enclosed in the pressure vessel already
equilibrated at an initial temperature. The vessel was then pressurized and after a
preset hold-time (15 min), decompressed. After pressure release the samples were
immediately cooled in ice-water.

Effect of PEF, HHP and thermal on PME and aroma RESULTS
73
4.2.3.5 Analysis of headspace volatile compounds
Volatile compounds were extracted with a modification of the method
described by (Fan and Gates, 2001) using a solid-phase microextraction (SPME)
method. A 2 mL aliquot beverage was transferred into 6 mL serum vial. The vial,
sealed by a teflon-lined septum and a screw cap, was pre-heated at 60 ºC for 2 min
before a SPME fiber, coated with 100 µm of poly(dimethylsiloxane), was inserted
into the headspace of the vial. After 30 min incubation, the SPME fiber with
adsorbed volatile compounds was removed from the vial and inserted into the GC
injection port at 250 ºC and held there for 5 min to desorb volatile compounds.
Volatile compounds were separated by a Hewlett-Packard 6890N/5973 GC-MSD
(Agilent Technologies, USA) equipped with a DB-Wax trace analysis column (30
m × 0.32 mm i.d., 0.5 µm film thickness). The temperature of the GC was
programmed from 60 to 96 ºC at 8 ºC·min-1, increased to 120 ºC at 12 ºC·min-1,
then increased to 220 ºC at 10 ºC·min-1 and held for 3 min at the final temperature.
Helium was the carrier gas at a linear flow speed of 39 cm·sec-1. Compounds were
identified by comparing spectra of the sample with those contained in the National
Institute of Standards and Technology Library (NIST02). The relative amount of
each compound was expressed as peak area.
4.2.3.6 PME activity measurement
PME activity was determined by measuring the release of acid over time at
pH 7 and 22 ºC following the procedure described by (Van den Broeck et al.,
1999). The reaction mixture consisted of 1 mL of sample and 30 mL of 0.35 %
citrus pectin solution (Sigma, USA) containing 125 mM NaCl. During hydrolysis
at 22ºC, pH was maintained at 7.0 by adding 0.0001 N NaOH using an automatic
pH-stat titrator (Titralab, Radiometer Analytical, SAS). After the first 1 min the
consumption of NaOH was recorded every 1 s for a 3 min reaction period. PME
activity was expressed in units (U/mL), defined as micromoles of acid produced
per minute at pH 7 and 22 ºC. The detection limit was established at 0.019 U/ml.
Residual activity was expressed as the relation between the PME activity after the

Effect of PEF, HHP and thermal on PME and aroma RESULTS
74
treatment (A) expressed in U/mL and the initial activity (A0) expressed also in
U/mL.
4.2.3.7 Experimental Design and Statistical Analysis
A hierarchical experimental design was used to study the influence of the
different technologies studied: in thermal treatment, seven temperatures in PEF
treatment, four electric field strengths and three temperatures and in HHP
treatment, five pressures and two temperatures. The statistical analysis was
performed using the Statgraphics software (Statistical Graphics Corp., USA),
applying a univariant ANOVA test with a significance level of 95.0%.
4.2.4 RESULTS AND DISCUSSION
4.2.4.1 Effect of treatment on PME activity in the orange juice-milk
based beverage
Figure 4.2.1 shows the thermal inactivation of PME in the OJMB in the
range of 60-90 ºC for 1 min. Approximately 4-5 % of the PME remained after the
90 °C treatment. Several authors (Veersteg et al., 1980; Wicker and Temelli, 1988;
Snir et al., 1996; Cameron et al., 1996; Tajchakavit and Ramaswami, 1997;
Cameron et al., 1998; Lee et al., 2003; Do Amaral et al., 2005) have also observed
a residual activity after thermal treatment, considered the stable fraction, between
4-8.3% in Navel and Valencia var. oranges reflecting the thermotolerance of the
orange PME. To achieve a level of 90 % of PME inactivation, 85 ºC for 1 min or
90 ºC for 30 s was needed. No inactivation was found below 65 ºC for 1 min. At 60
ºC the PME activity was increased as a result of the treatment. This phenomenon
could be explained by some activation effect produced by the heat. (Körner et al.,
1980) found an optimum temperature of 60 ºC for the activity of two PME
fractions purified from Valencia flavedo and Shamouti juice. The relationship
between the temperature and the residual activity of PME seemed to be linear from
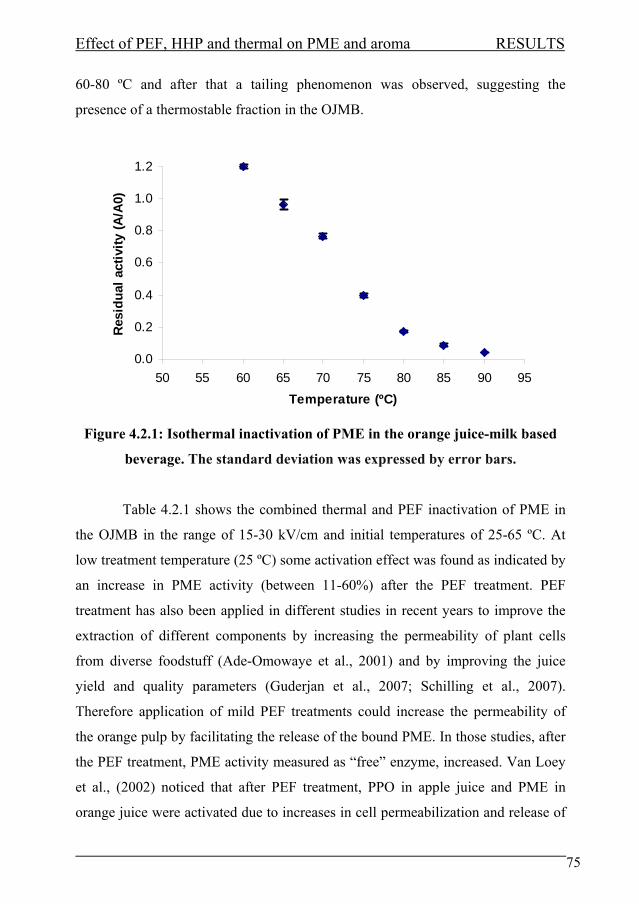
Effect of PEF, HHP and thermal on PME and aroma RESULTS
75
60-80 ºC and after that a tailing phenomenon was observed, suggesting the
presence of a thermostable fraction in the OJMB.
0.0
0.2
0.4
0.6
0.8
1.0
1.2
50 55 60 65 70 75 80 85 90 95Temperature (ºC)
Res
idua
l act
ivity
(A/A
0)
Figure 4.2.1: Isothermal inactivation of PME in the orange juice-milk based
beverage. The standard deviation was expressed by error bars.
Table 4.2.1 shows the combined thermal and PEF inactivation of PME in
the OJMB in the range of 15-30 kV/cm and initial temperatures of 25-65 ºC. At
low treatment temperature (25 ºC) some activation effect was found as indicated by
an increase in PME activity (between 11-60%) after the PEF treatment. PEF
treatment has also been applied in different studies in recent years to improve the
extraction of different components by increasing the permeability of plant cells
from diverse foodstuff (Ade-Omowaye et al., 2001) and by improving the juice
yield and quality parameters (Guderjan et al., 2007; Schilling et al., 2007).
Therefore application of mild PEF treatments could increase the permeability of
the orange pulp by facilitating the release of the bound PME. In those studies, after
the PEF treatment, PME activity measured as “free” enzyme, increased. Van Loey
et al., (2002) noticed that after PEF treatment, PPO in apple juice and PME in
orange juice were activated due to increases in cell permeabilization and release of
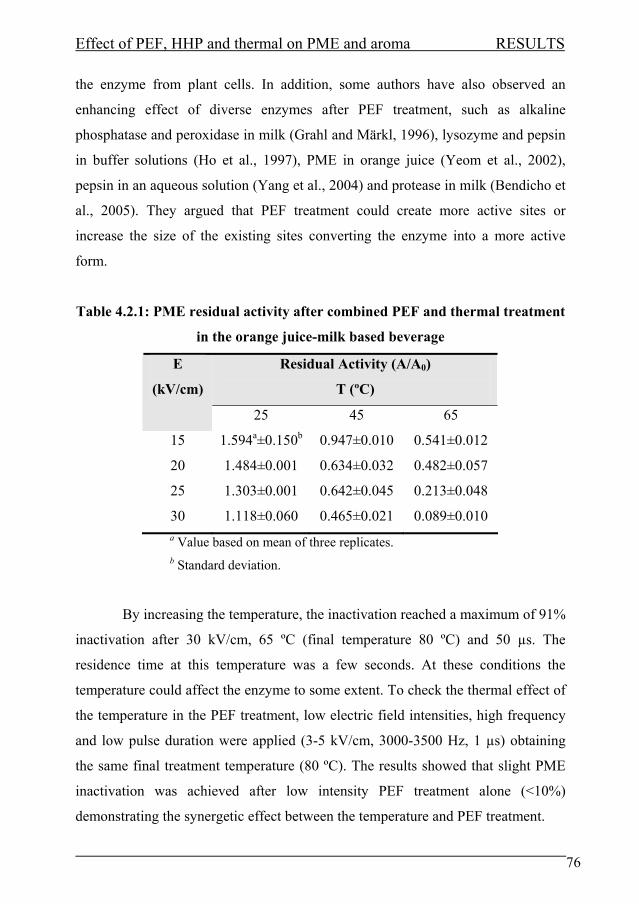
Effect of PEF, HHP and thermal on PME and aroma RESULTS
76
the enzyme from plant cells. In addition, some authors have also observed an
enhancing effect of diverse enzymes after PEF treatment, such as alkaline
phosphatase and peroxidase in milk (Grahl and Märkl, 1996), lysozyme and pepsin
in buffer solutions (Ho et al., 1997), PME in orange juice (Yeom et al., 2002),
pepsin in an aqueous solution (Yang et al., 2004) and protease in milk (Bendicho et
al., 2005). They argued that PEF treatment could create more active sites or
increase the size of the existing sites converting the enzyme into a more active
form.
Table 4.2.1: PME residual activity after combined PEF and thermal treatment
in the orange juice-milk based beverage
Residual Activity (A/A0)
T (ºC)
E
(kV/cm)
25 45 65
15 1.594a±0.150b 0.947±0.010 0.541±0.012
20 1.484±0.001 0.634±0.032 0.482±0.057
25 1.303±0.001 0.642±0.045 0.213±0.048
30 1.118±0.060 0.465±0.021 0.089±0.010 a Value based on mean of three replicates. b Standard deviation.
By increasing the temperature, the inactivation reached a maximum of 91%
inactivation after 30 kV/cm, 65 ºC (final temperature 80 ºC) and 50 µs. The
residence time at this temperature was a few seconds. At these conditions the
temperature could affect the enzyme to some extent. To check the thermal effect of
the temperature in the PEF treatment, low electric field intensities, high frequency
and low pulse duration were applied (3-5 kV/cm, 3000-3500 Hz, 1 µs) obtaining
the same final treatment temperature (80 ºC). The results showed that slight PME
inactivation was achieved after low intensity PEF treatment alone (<10%)
demonstrating the synergetic effect between the temperature and PEF treatment.

Effect of PEF, HHP and thermal on PME and aroma RESULTS
77
Figure 4.2.2 represents the combined thermal and HHP inactivation of
PME in the OJMB at 30 and 50 ºC for 15 min. At 25 ºC and low pressures (450
MPa) no inactivation effect was observed, revealing the pressure tolerance of the
orange PME. By increasing the temperature to 50 ºC (final temperature 65 ºC) and
pressure to 650 MPa the inactivation increased and reached a maximum of 90.5 %.
Several authors have observed this resistance to pressure treatment. (Nienaber and
Shellhammer, 2001; Truong et al., 2002) found that PME was stable under pressure
below 400 MPa and combination of high temperature and high pressure (40-50 ºC
and 600-700 MPa) were necessary to inactivate it.
0
20
40
60
80
100
450 500 550 600 650Pressure (MPa)
PME
inac
tivat
ion
(%) 30 ºC
50 ºC
Figure 4.2.2: Combined HHP and thermal inactivation of PME in the orange
juice-milk based beverage. The standard deviation was expressed by error
bars.
4.2.4.2 Effect of treatment on the volatile compounds concentration in
the orange juice-milk based beverage
Twelve volatile compounds could be identified accurately from the OJMB.
The majority of the compounds were hydrocarbons among which limonene and
valencene were the most abundant constituting more than 90% of the total
compounds.

Effect of PEF, HHP and thermal on PME and aroma RESULTS
78
Figure 4.2.3 shows the effect of thermal treatment on the relative
concentration of volatile compounds in the OJMB. The average loss of volatile
compounds after thermal treatment at the different temperature range for 1 min was
between 16.0-43.0%. There were no significant differences in the concentration of
volatile compounds due to the increase in temperature up to 80ºC (Table 8.2.2).
The compounds could be divided in two groups. One group considered as
relatively low-molecular-weight (MW 136) including (β-pinene, α-pinene, β-
myrcene, limonene, α-phellandrene, 3-carene and 4-carene) and a second group
considered as relatively high-molecular-weight (MW 142-204) including nonanal,
decanal, caryophyllene, dodecanal and valencene. The higher average loss was
observed in β-pinene (48%), α-pinene (42%) and 3-carene (41%) which belong to
the first group, and counted for an average loss of 35%. On the other hand the high-
molecular-weight compounds seemed to be less sensitive to the thermal treatment
with a slight increase in nonanal content at temperatures below 70 ºC. At higher
temperatures, nonanal and caryophyllene (12%) which have higher boiling points
had an average loss of 21%, lower than the loss of lower boiling point compounds.
Boff et al., (2003) came to the same conclusions observing that in the thermal
processing of an orange juice, low-molecular-weight compounds (β-myrcene,
limonene and α-pinene) were more sensitive to the thermal treatment than
relatively higher-molecular-weight compounds (decanal, caryophyllene and
valencene).
Figure 4.2.4 shows the effect of the combined thermal and PEF treatment
(at initial temperatures 25, 45 and 65 ºC) on the concentration of volatile
compounds in the OJMB. The average loss was between -13.7 to 8.3% at 25 ºC,
5.8 to 21.0% at 45 ºC and 11.6 to 30.5% at 65 ºC after PEF treatment. An increase
in the electric field strength did not produce a significant decrease in the average
loss of volatile compounds content except at high electric fields (25 and 30 kV/cm
at 25 and 65ºC) (Table 8.2.3). An increase in the temperature only decreased
significantly the average loss of volatile compounds content at 65ºC (Table 8.2.4).

Effect of PEF, HHP and thermal on PME and aroma RESULTS
79
-20
-10
0
10
20
30
40
50
60
70
80
90
Alph
a-pi
nene
Beta
-pin
ene
Beta
-myr
cene
Lim
onen
e
Alph
a-ph
ella
ndre
ne
3-C
aren
e
4-C
aren
e
Non
anal
Dec
anal
Car
yoph
ylle
ne
Dod
ecan
al
Vale
ncen
e
Compound
% L
oss
60 ºC 65 ºC 70 ºC 75 ºC 80 ºC 85 ºC 90 ºC
Figure 4.2.3: Effect of thermal treatment for 1 min on the volatile compounds
content in the orange juice-milk based beverage. The standard deviation was
expressed by error bars.
At 25 and 45 ºC and electric field strength below 25 kV/cm and 65 ºC at 15
kV/cm, several compounds increased its content after PEF treatment (β-pinene,
limonene, 3-carene, 4-carene, nonanal, decanal and dodecanal). Ayhan et al.,
(2002) obtained similar results observing that several compounds (myrcene,
limonene and α-pinene) increased its content after PEF. Steffen and Pawliszyn,
(1996) found that in a complex matrix such as orange juice, with the presence of
suspended solids, a portion of analytes could be trapped in the pulp. PEF
technology has been used to improve the extraction of different compounds by
increasing the membrane permeabilization. This fact could explain why PEF
treatment could facilitate the release of several compounds from the suspended
solids to the liquid phase facilitating its extraction into the headspace.

Effect of PEF, HHP and thermal on PME and aroma RESULTS
80
25 ºC
-80
-60
-40
-20
0
20
40
60
80
Alp
ha-p
inen
e
Bet
a-pi
nene
Bet
a-m
yrce
ne
Lim
onen
e
Alp
ha-
phel
land
rene
3-C
aren
e
4-C
aren
e
Non
anal
Dec
anal
Car
yoph
ylle
ne
Dod
ecan
al
Val
ence
ne
Compound
% L
oss
15 kV/cm 20 kV/cm 25 kV/cm30 kV/cm
45 ºC
-50
-30
-10
10
30
50
70
90
Alp
ha-p
inen
e
Bet
a-pi
nene
Bet
a-m
yrce
ne
Lim
onen
e
Alp
ha-
phel
land
rene
3-C
aren
e
4-C
aren
e
Non
anal
Dec
anal
Car
yoph
ylle
ne
Dod
ecan
al
Val
ence
ne
Compound
% L
oss
15 kV/cm 20 kV/cm 25 kV/cm30 kV/cm
65 ºC
-60
-40
-20
0
20
40
60
80
100
Alp
ha-p
inen
e
Bet
a-pi
nene
Bet
a-m
yrce
ne
Lim
onen
e
Alp
ha-
phel
land
rene
3-C
aren
e
4-C
aren
e
Non
anal
Dec
anal
Car
yoph
ylle
ne
Dod
ecan
al
Val
ence
ne
Compound
% L
oss
15 kV/cm 20 kV/cm 25 kV/cm30 kV/cm
Figure 4.2.4: Effect of combined PEF and thermal treatment (25, 45 and 65ºC)
on volatile compounds content in the orange juice-milk based beverage. The
standard deviation was expressed by error bars.

Effect of PEF, HHP and thermal on PME and aroma RESULTS
81
To check the hypothesis of higher concentration of certain compounds in
the pulp, the orange juice was centrifuged in order to separate into serum and pulp.
The concentration of different compounds was studied in both fractions. Nonanal,
3-carene, 4-carene, limonene and α-phellandrene were found in higher quantity in
the pulp (data not shown). This fact could explain that the compounds could be
released to the liquid phase by the PEF treatment and be extracted in the headspace
more readily. Compounds more sensitive to the PEF treatment were β-myrcene, α-
pinene and caryophyllene whereas the less sensitive compounds were limonene, 4-
carene and nonanal. Opposite to the thermal treatment, the compounds that were
present in the pulp at higher proportions were also higher after PEF treatment.
Figure 4.2.5 shows the loss of volatile compounds concentration in the
OJMB after the combined thermal and HHP (at 30 and 50 ºC initial temperatures)
treatment. The average loss at 30 ºC was between -14.2 and 7.5%. An increase in
the pressure value did not produce a significant decrease in the average loss of
volatile compounds content (Table 8.2.5). However an increase in the initial
treatment temperature produced a significant decrease in the loss of volatile
compounds content (Table 8.2.6). Only β-myrcene content was lost at every
pressure value (~50%) and limonene, α-pynene, β-pynene, 3-carene and α-
phellandrene were not affected at 650 MPa. On the other hand, the rest of
components in the OJMB increased in their contents after treatment with lower
pressures. Similar to the PEF treatment, it seems that the HHP treatment released
several compounds that are found in the solid phase of the orange juice. At 50 ºC
(final temperature 65 ºC) the average loss was increased in all compounds
(32.80%). At 650 MPa and 50 ºC the loss of volatile compounds was the same as
the maximum which was reached after the thermal treatment (85-90 ºC).
Valencene, limonene and caryophyllene were the compounds less sensitive to the
HHP treatment whereas β-myrcene, α-phellandrene and 3-carene at 50 ºC were
more sensitive to the HHP treatment.

Effect of PEF, HHP and thermal on PME and aroma RESULTS
82
The combination of different nonthermal technologies and thermal
treatment (PEF at 65 ºC initial temperature and HHP at 50 ºC initial temperature)
inactivated 90% of PME whereas high temperature treatments (85-90 ºC) were
needed for thermal treatment. At this temperature the loss of different volatile
compounds were significantly higher than PEF and similar to HHP at 50 ºC.
Concentrations of several compounds were enhanced after PEF and HHP treatment
at low temperatures. The sensitivity of volatile compounds differed with the
different treatments applied. The high-molecular-weight compounds were more
resistant to the thermal treatment and the pulp-related compounds were more
resistant to the PEF and HHP treatments. Based on these results it is possible that
PEF treatment can achieve a similar PME inactivation than thermal processing
with a better orange juice-milk beverage fresh aroma.
30ºC
-80
-60
-40
-20
0
20
40
60
80
Alp
ha-p
inen
e
Bet
a-pi
nene
Bet
a-m
yrce
ne
Lim
onen
e
Phe
lland
rene
3-C
aren
e
4-ca
rene
Non
anal
Dec
anal
Car
yoph
ylle
ne
Dod
ecan
al
Val
ence
ne
Compound
% L
oss
450 Mpa500 Mpa550 Mpa600 Mpa650 Mpa
50ºC
-10
0
10
20
30
4050
60
70
80
90
Alp
ha-p
inen
e
Bet
a-pi
nene
Bet
a-m
yrce
ne
Lim
onen
e
Phe
lland
rene
3-C
aren
e
4-C
aren
e
Non
anal
Dec
anal
Car
yoph
ylle
ne
Dod
ecan
al
Val
ence
ne
Compound
% L
oss
450 Mpa500 Mpa550 Mpa600 Mpa650 Mpa
Figure 4.2.5: Effect of combined HHP and thermal treatment (30 and 50ºC) on
volatile compounds content in the orange juice-milk based beverage. The
standard deviation was expressed by error bars
Inactivation kinetics of pectin
methyl esterase under combined
thermal-high pressure treatment
in an orange juice-milk beverage


HHP inactivation kinetics of PME RESULTS
84
Sampedro, F1., Rodrigo, D2. and Hendrickx, M3.
1 Instituto de Agroquímica y Tecnología de Alimentos, CSIC, Apartado Postal 73,
46100 Burjassot, Valencia, Spain 2 Nutrition and Bromatology Area, Faculty of Pharmacy, University of Valencia,
Vicent Andrés Estellés S/N, 46100 Burjassot, Valencia, Spain 3 Laboratory of Food Technology, Faculty of Applied Bioscience and Engineering,
Katholieke Universiteit Leuven, Kasteelpark Arenberg 22,B-3001, Heveerle
(Leuven), Belgium
Journal of Food Engineering (2008), 86:133-139
Keywords: Orange juice, Milk, Pectin methyl esterase, HHP, inactivation
4.3.1 ABSTRACT The inactivation kinetics of PME in an orange juice-milk beverage system treated by thermal (65-80ºC) and combined thermal (25-65ºC)-high pressure (0.1-700 MPa) processes were fitted using a biphasic model. About 6-8 % of the initial activity corresponding to the heat and pressure stable fraction was observed. For complete inactivation a treatment at 90ºC, 1 min or 700 MPa at 55ºC for 2 min was necessary showing the protective effect of the orange-milk media. The extent of
inactivation was different in the orange matrices showing that PME was more thermostable in the orange juice-milk based beverage system as compared to the purified enzyme in a buffer system. On the other hand, the purified enzyme in a buffer system showed the highest pressure stability.
Parameters such as pH (from acid in the orange juice matrices to basic in the buffer), matrix composition (from less to more complex) and purification level of the enzyme (purified in the
buffer or nature in the orange juice) play an important role in the stability of the PME against the different processing technologies studied.
HHP inactivation kinetics of PME RESULTS
85
4.3.2 INTRODUCTION
In recent years a large quantity of new pasteurised liquid foods requiring
chilled storage and distribution have appeared on the European market. Among
these, fruit-juice mixes, vegetable soups and different sauces are predominant; they
are produced from food ingredients of very different natures, leading to complex
compositions. The fruit juice mixes include beverages based on a mixture of fruit
juices and milk, fortified with vitamins, minerals, fiber and these products
represent the most widely consumed functional foods (Pszczola, 2005).
For these systems only limited data on quality and safety aspects are
available in open literature and it is essential to evaluate the potential use of
alternative technologies, such as High Hydrostatic Pressure (HHP), in order to
preserve their freshness, as well as their nutritional and functional properties.
Studies on the application of HHP to different juice matrices have recently become
available but studies on more complex fruit juice based foods (including fat,
proteins and additives such as pectin and sugar in an acid environment) are still
lacking.
Pectin methyl esterase (PME) is an important enzyme in orange juice
products and its effects on quality aspects such as cloud stability are well known
(Cameron et al., 1998; Do Amaral et al., 2005). Orange PME is a thermal and high
pressure stable enzyme composed by several fractions with different processing
stabilities (stable and labile fraction). The orange PME stable fraction is mainly
responsible for the destabilization of orange juice (cloud loss) at 5ºC and also to a
lesser extent at 30ºC (Cameron et al., 1998; Versteeg et al., 1980). It has been
shown that the enzyme remains active (between 90-95 % retention at pH 3.5 for 60
h and 80 % retention at 4ºC for 42 days) in a single strength orange juice (Hou et
al., 1997). This fraction is thermo tolerant and severe conditions are necessary to
inactivate it (90ºC, 1 min or 95ºC, 30 s) (Cameron et al., 1994; Do Amaral et al.,
2005). Normally industry adopts these conditions to pasteurize orange juice (88-
90ºC, 15-30 s) (Irwe and Olson, 1994). PME is also pressure tolerant (is stable at
P<400 MPa); therefore, a combination of high T and high P (40-50ºC and 600-700

HHP inactivation kinetics of PME RESULTS
86
MPa) is necessary to inactivate it (Nienaber and Shellhammer, 2001; Truong et al.,
2002).
There are a number of studies available on the heat inactivation of PME in
orange juice (Versteeg et al., 1980; Tajchakavit and Ramaswamy, 1997; Lee et al.,
2003), in orange pulp (Wicker and Temelli, 1988) as well as on the purified
enzyme isolated from oranges (Cameron et al., 1994; Cameron and Grohmann,
1996; Van den Broeck et al., 1999 a; Han et al., 2000). HHP inactivation of
purified PME has been studied in buffer systems (Van den Broeck et al., 1999 b;
Van den Broeck et al., 2000) and in orange juice (Nienaber et al., 2001;
Seyderhelm et al., 2004) but there are no studies on the behavior of PME during
thermal and/or HHP treatment of beverages based on fruit juices and milk.
Traditionally linear models have been applied to describe enzyme
inactivation kinetics by heat, obtaining parameters such as D and z values.
However, in the case of orange PME the thermal inactivation curves have been
observed to behave differently due to the presence of different fractions exhibiting
different stabilities. A number of authors have demonstrated the appearance of such
fractions; two fractions with different thermal stabilities were observed in orange
Valencia var. juice or pulp (Wicker and Temelli, 1988; Hou, et al., 1997;
Tajchakavit and Ramaswamy, 1997; Van den Broeck, et al., 1999 a; Lee, et al.,
2003), four fractions with different thermostability (Cameron et al., 1998) and
seven fractions in the peel (Han, et al., 2000). In the case of orange juice Navel var.
three fractions with different thermostability were found (Versteeg, et al., 1980).
Nevertheless, in many cases only part of the curve (activity related to the most
abundant fraction) has been modelled to obtain the previously described
parameters. In this study a biphasic model is proposed to characterize the behavior
of the different fractions against the treatment.
The aim of the present work was to study the inactivation kinetics of PME
in an orange juice-milk based beverage system as well as different orange matrices
under combined conditions of HHP and heat.
HHP inactivation kinetics of PME RESULTS
87
4.3.3 MATERIAL AND METHODS
4.3.3.1 Orange juice and beverage preparation
Fresh Valencia Navel var. oranges were purchased at a local supermarket.
The oranges were peeled and squeezed with the aid of a juice centrifuge and the
juice was kept at -40ºC until use. The beverage contained the following
ingredients: fresh orange juice (500 mL/L), commercial UHT skimmed milk (200
mL/L), high methoxyl citrus pectin (Unipectine AYD 250, Cargill, USA) (3 g/L),
sugar (75 g/L), and distilled water (300 mL/L). The beverage preparation and
physicochemical characteristics were described in Chapter 1. The beverage was
prepared just before use.
4.3.3.2 PME activity measurement
PME activity was determined by measuring the release of acid over time at
pH 7 and 22 ºC following the procedure described by (Van den Broeck et al.,
1999). The reaction mixture consisted of 2.5 mL of sample and 30 mL of 0.35%
apple pectin solution (70-75 % esterification, Fluka, Belgium) containing 125 mM
NaCl. Before injection, the pectin solution was adjusted to pH 7.0. During
hydrolysis at 22ºC, pH was maintained at 7.0 by adding 0.005 N NaOH using an
automatic pH-stat titrator (Metrohm, Switzerland). After the first 300-400 s the
consumption of NaOH was recorded every 10 s for a 10-15 min reaction period.
PME activity expressed in units (U) is defined as micromoles of acid produced per
minute at pH 7 and 22ºC. The detection limit was established at 0.057 U. Residual
activity was expressed as the relation between the PME activity after the treatment
(A) expressed in U/mL and the initial activity (A0) expressed also in U/mL.
4.3.3.3 Experimental design
A hierarchical experimental design was used to study the influence of the
different treatments on PME activity: six temperatures and six treatment times
were used for the thermal treatment. Four pressure levels, four temperatures and

HHP inactivation kinetics of PME RESULTS
88
five treatment times were used for the combined thermal-high pressure treatment.
The statistical analysis was performed using the SAS® software, applying a
nonlinear regression. To study the influence of the orange matrices, between
eighteen and fourteen temperatures and one treatment time were used for the
thermal treatment and ten pressure levels and one treatment time for the high
pressure treatment.
4.3.3.4 Thermal inactivation at atmospheric pressure
Isothermal inactivation experiments were carried out in a water bath with
temperature control, in a temperature range from 45-90ºC for 1-90 min. Beverage
sample (8 mL) was enclosed in 10 mL stainless steel tubes. Prior to each treatment
the samples were preheated at 40ºC (measurements indicated that no inactivation
was observed at this temperature, data not shown) in order to shorten and
standardize the come-up time. Under these conditions a come-up time of 2.5 min
was observed using a tube with an inner thermocouple connected to a data logger.
After the preset time intervals including the come-up time, the samples were
withdrawn from the water bath and immediately cooled in ice-water. The residual
PME activity was measured within 2 h storage in an ice-water bath.
4.3.3.5 Combined thermal and high-pressure inactivation
All pressure experiments were performed in laboratory scale multi-vessel
high-pressure equipment (HPIU-10000, Resato, The Netherlands). Combined
thermal and high-pressure treatments were applied in the ranges of 25-65ºC and
0.1-700 MPa for 2-75 min. The pressure medium was a glycol-oil mixture (TR15,
Resato, The Netherlands). A thermostated mantel, which surrounds each vessel,
was connected to a cryostat keeping the temperature constant during the
experiment. The samples were filled in 15 mL plastic tubes with flexible stoppers
and were enclosed in the pressure vessel already equilibrated at a preset
temperature. Pressure was built up slowly (100 MPa/min) to minimize the adiabatic
heating. After pressure build-up, an equilibrium period of 2 min was taken into

HHP inactivation kinetics of PME RESULTS
89
account in order to allow temperature to evolve its desire value. After the
equilibration period, one vessel was decompressed and the sample was
immediately cooled representing the blank. Then the rest of vessels were
decompressed after preset time intervals. After pressure release the samples were
immediately cooled in ice-water and the residual PME activity was measured
within 2 h storage in an ice-water bath.
4.3.3.6 Orange PME purification
Orange PME was extracted using a 0.2 M Tris buffer with 1M NaCl at pH
8. Afterwards, the extract was partially purified by ammonium sulphate
precipitation. The fraction precipitating between 30% and 80% ammonium
sulphate saturation was collected and dissolved in 20 mM Tris buffer, pH 7.5 and
kept at -80ºC until use. This crude extract of orange PME was further purified
following the procedure described by (Ly Nguyen et al., 2002) based on affinity
chromatography using a NH-Sepharose 4B-PME-inhibitor column, pooling and
desalting the different fractions of PME.
4.3.3.7 Data analysis and parameter estimation
For the thermal and high pressure ranges under study, inactivation kinetics
of orange PME in the orange juice-milk based beverage was properly described
using the biphasic model which is usually applied when two fractions are present
with different processing stabilities, one stable and one labile fraction and both
inactivating according to first-order kinetics and can be defined by (Van den
Broeck et al., 2000):
A=AL exp (-kL·t)+As exp (-kS t) Equation 4.3.1
where A is the dependent variable and can be expressed as enzyme activity
(U/mL), AL and AS refer, respectively, to the activity of the labile and stable fraction
(U/mL), kL and kS the inactivation rate constant of the labile and stable fraction

HHP inactivation kinetics of PME RESULTS
90
(min-1) and t the independent variable expressed as the treatment time (s). The
different parameters (AL, AS, kL, kS) were estimated through a nonlinear regression
using the SAS® software.
A special case of first order kinetics is the fractional conversion model,
which is usually applied when a fraction is inactivated and another fraction remains
constant and a nonzero residual activity after prolonged thermal/pressure treatment
is observed (Van den Broeck et al., 1999 a and b):
A = A∞ + (A0 - A∞) exp (-k t) Equation 4.3.2
where A is the dependent variable and can be expressed as enzyme activity
(U/mL), A0 and A∞ refer, respectively, to the initial enzyme activity and to the
residual activity after prolonged treatment time (U/mL), k the inactivation rate
constant (min-1) and t the independent variable expressed as the treatment time (s).
The different parameters (k and A∞) were estimated through a nonlinear regression
using the SAS® software.
The temperature dependence of inactivation rate constants of the labile and
stable fraction can be estimated using the Arrhenius model (Arrhenius, 1889):
⎥⎦
⎤⎢⎣
⎡⎟⎟⎠
⎞⎜⎜⎝
⎛−+=
TTREkk aL
LoL11)ln()ln(
0 Equation 4.3.3
⎥⎦
⎤⎢⎣
⎡⎟⎟⎠
⎞⎜⎜⎝
⎛−+=
TTREkk aS
Sos11)ln()ln(
0 Equation 4.3.4
where ln(kL) and ln(kS) are the dependent variables and are expressed as the
inactivation rate constant of the labile and stable fraction respectively (min-1), EaL
and EaS are the activation energy of the labile and stable fraction respectively
(kJ/mol), kL0 and kS0 the inactivation rate constant at a reference temperature of the

HHP inactivation kinetics of PME RESULTS
91
labile and stable fraction respectively (min-1), T is the independent variable
expressed as the absolute temperature (K), T0 the reference temperature (K) and R
(8.314 J/mol K) is the universal gas constant. The different parameters (EaL, EaS,
kL0 and kS0) were estimated through a linear regression using the SAS® software.
The pressure dependence of the enzyme inactivation rate constants at a
constant temperature of the labile and stable fraction can be calculated using the
linearized Eyring equation (Eyring, et al., 1946):
( )⎥⎦⎤
⎢⎣⎡ −+= ref
aLLoL PP
RTVkk )ln()ln( Equation 4.3.5
( )⎥⎦⎤
⎢⎣⎡ −+= ref
aSSoS PP
RTVkk )ln()ln( Equation 4.3.6
where ln(kL) and ln(kS) are the dependent variables and are expressed as the
inactivation rate constant of the labile and stable fraction respectively (min-1), VaL
and VaS are the activation volume of the labile and stable fraction respectively
(cm3/mol), kL0 and kS0 are the inactivation rate constant at a reference pressure of
the labile and stable fraction respectively (min-1), T is the absolute temperature (K),
P is the independent variable expressed as the pressure (MPa), Pref is the reference
pressure (MPa) and R (8.314 J/mol K) is the universal gas constant. The different
parameters (VaL, VaS, kL0 and kS0) were estimated through a linear regression using
the SAS® software.
The corrected R2 was calculated to check how well the model fits to the
experimental enzyme inactivation curve and can be defined as follows:
Corrected R =
( )
( )⎥⎥⎥⎥⎥
⎦
⎤
⎢⎢⎢⎢⎢
⎣
⎡
−
⎟⎟⎠
⎞⎜⎜⎝
⎛−−
−jm
SSQSSQ
mtotal
regression111 Equation 4.3.7

HHP inactivation kinetics of PME RESULTS
92
where m is the number of observations, j is the number of model
parameters, SSQ is the sum of squares, and SD is the standard deviation.
4.3.3.8 Effect of food matrix
The effect of different orange matrices on the thermal PME inactivation
was carried out in a water bath with temperature control. Treatments of 5 min in a
temperature range from 45-90ºC were carried out. Samples were enclosed in 10 mL
metal tubes. The effect of the different matrices on high-pressure PME inactivation
was performed applying pressures in the range of 350-800 MPa for 15 min at 25ºC.
Samples were filled in 15 mL plastic tubes with flexible stoppers.
4.3.4 RESULTS AND DISCUSSION
4.3.4.1 Thermal inactivation of the PME in the orange juice-milk
based beverage
Data for isothermal inactivation of PME in the orange juice-milk based
beverage obtained in the range from 65-80ºC could be accurately modelled
applying a special case of first-order kinetics, the biphasic model assuming the
occurrence of two fractions with different stability levels and obtaining the rate
constants (k) of both fractions and the percentage of stable fraction (Eq.4.3.1)
(Table 4.3.1). The percentage (6-8%) of stable fraction estimated was in line with
data obtained by several authors (4-8.3%) in different varieties of oranges (Navel
and Valencia var.) (Cameron and Grohmann, 1996; Cameron et al., 1998; Do
Amaral et al., 2005; Lee et al., 2003; Snir et al., 1996; Tajchakavit and
Ramaswamy, 1997; Versteeg, et al., 1980; Wicker and Temelli, 1988). It has been
stated that the amount of orange PME stable fraction is variable and depends to a
large extent on the orange variety used and the time of harvest (Snir et al., 1996).
Irwe and Olson (1994) and Van den Broeck et al., (1999 a) found strong
differences in the thermal and pressure stability of PME from different orange
varieties: Valencia and Navel var.
HHP inactivation kinetics of PME RESULTS
93
It was necessary to increase the temperature to 90ºC for 1 min to inactivate
the stable fraction (data not shown). Snir et al., (1996) found that the stable fraction
is the one that remains after treatment, at 70ºC, 5 min, but in our study slightly
different conditions (applying 80ºC, 5 min or 90°C, 1 min) were found to
distinguish the stable fraction. These results are in line with those obtained by Han
et al., (2000), who also found similar conditions to distinguish the thermolabile and
thermostable fractions.
From 75-80ºC only the rate constants of the heat stable fraction were
estimated because the inactivation of the labile fraction was too fast to be
determined accurately. Based on the inactivation rate constants, the activation
energy of the labile and stable fraction (EaL and EaS) were estimated (Eq. 4.3.3 and
Eq. 4.3.4) (Table 4.3.1). The inactivation rate constants of the stable fraction were
found to be less temperature sensitive than the rate constants of the labile fraction.
From 65-72.5ºC only the labile fraction was inactivated whereas the stable fraction
did not inactivate. In this temperature domain a fractional conversion model was
also used to estimate the rate constant of the heat labile fraction and the percentage
of stable fraction (Eq. 4.3.2) (Table 4.3.1). It could be seen that the inactivation
parameters and percentage of stable fraction obtained by both models were similar.
The corrected R2 values ranged from 0.995 to 0.999 indicating the biphasic model
could accurately describe the thermal inactivation curves of PME in the orange
juice-milk based beverage (Figure 4.3.1).
The k values obtained in the thermal inactivation study were compared to
those obtained by other authors in less complex media. Van den Broeck et al.,
(1999 a) studied the thermal inactivation of PME purified from Navel oranges
obtaining k values at 65ºC of 0.889, 1.536, 0.288 and 0.234 min-1 in deionized
water and citric buffer at pH of 3.2, 3.7 and 4.2 respectively. The Ea values ranged
from 404.9 to 292.6 kJ/mol. Comparing these data with those obtained in the
orange juice-milk based beverage at the same conditions, it can be observed that
the k values are much lower while the value of the activation energy is higher

HHP inactivation kinetics of PME RESULTS
94
(528.23 kJ/mol). This indicates that the PME in the milk-juice beverage is more
thermally resistant and the k values less sensitive to heat.
Table 4.3.1: Biphasic and fractional conversion kinetic parameters estimate ±
standard error describing isothermal inactivation of PME in the orange juice-
milk based beverage at atmospheric pressure.
Biphasic Model Fractional
Conversion T (ºC)
kLa
(min-1) kSb
(min-1) k (min-1)
65 0.173c±0.057d - 0.085±0.019
70 0.215±0.115 - 0.166±0.024
72.5 1.789±0.194 - 1.538±0.130
75 - 1.747±0.241 -
77.5 - 1.740±0.084 -
80 - 6.617±0.839 -
% heat stable
fraction - 7.90±0.250 6.29±0.639
EaSe (kJ/mol) - 605955±89312 -
EaLf (kJ/mol) 532603±32043 - 528233±32810.3
a: Kinetic constant of the labile fraction b: Kinetic constant of the stable fraction c: Value based on mean of three replicates d: Standard error e Activation energy of the heat stable fraction f Activation energy of the heat labile fraction

HHP inactivation kinetics of PME RESULTS
95
0.00
0.20
0.40
0.60
0.80
1.00
0 10 20 30 40 50 60 70 80
Time (min)
A/Ao
65ºC 70ºC 72,5ºC 75ºC 77,5ºC 80ºC
Figure 4.3.1: Isothermal inactivation of PME in the orange juice-milk
beverage fitted by a biphasic model.
4.3.4.2 Combined thermal and high-pressure inactivation of PME in
the orange juice-milk based beverage
Inactivation kinetics of PME in the orange juice-milk based beverage were
studied by combining pressures and temperatures and the occurrence of two
fractions with different high pressure stability was also observed. Taking this fact
into account, the biphasic model was used to estimate the inactivation rate
constants (k) and the percentage of stable fraction (Eq. 4.3.1) (Table 4.3.2).
Goodner et al., (1998) and Van den Broeck et al., (2000) also observed several
fractions with different pressure stabilities in an orange juice from Valencia var.
and in a PME fraction purified from Navel var. oranges respectively.
A 7 % of the initial activity was estimated as the pressure stable fraction.
At pressure level until 550 MPa and temperature until 55ºC only the labile fraction
was inactivated. Based on the inactivation rate constants, the activation volume of
the labile and stable fraction (VaL and VaS) were estimated (Eq. 4.3.5 and Eq. 4.3.6)
(Table 4.3.2).
Based on the activation volume, the inactivation rate constant of the labile
fraction was more pressure dependent than the inactivation rate constant of the

HHP inactivation kinetics of PME RESULTS
96
stable fraction. The biphasic model could also describe the combined thermal and
high pressure treatment with corrected R2 values ranging from 0.961 to 0.998
(Figure 4.3.2). Van den Broeck et al., (2000) obtained the k values after the
combined thermal and high pressure treatments of the PME purified from Navel
oranges in citric buffer at pH of 3.7. The k values ranged from 3.95 to 5.41 min-1
after the combined 25ºC and 600 to 700 MPa treatment and from 2.92 to 20.80
min-1 for the combined 45ºC and 550 to 700 MPa treatment. As for thermal
treatments, the k values were much higher than those obtained in our study
meaning that the enzyme is more pressure resistant in the orange juice-milk based
beverage.
4.3.4.3 Effect of orange matrices
Based on the results obtained comparing the orange juice-milk based
beverage with other matrices in the literature was found interesting to check the
effect of different orange matrices on the stability of orange PME against thermal
and high pressure treatment. In the Figure 4.3.3 is represented the thermal
inactivation of orange PME in different matrices in the range of 45-90ºC. As for
PME inactivation in the orange juice-milk based beverage, no inactivation was
found below 63ºC for 5 min and around 3.5% remaining activity was found at
91°C. In the case of orange juice no inactivation was achieved below 50ºC and
around 8% remaining activity was found at 83°C. As for inactivation of purified
PME around 6% remaining activity was found at 72.5°C. Analyzing the results it
could be stated that the PME inactivation in the orange juice-milk based beverage
was slower than in the other media, meaning that PME was more thermostable in
the orange juice-milk based beverage environment. In addition, PME was found to
be more thermostable in orange juice compared to the purified enzyme in a buffer
system at pH 7. This fact could mean that the pH or level of PME purification
affects the thermal inactivation mechanism of PME.

HHP inactivation kinetics of PME RESULTS
97
Table 4.3.2: Biphasic kinetic parameters estimate ± standard error describing the combined thermal and high pressure
inactivation of PME in the orange juice-milk beverage.
25ºC 45ºC 55ºC 65ºC P
(MPa) kLa (min-1) kS
b (min-1) kL (min-1) kS (min-1) kL (min-1) kS (min-1) kL (min-1) kS (min-1)
500 - - - - - - 0.353±0.064 -
550 0.264c±0.071d - 0.245±0.031 - 0.365±0.046 - 0.415±0.023 0.011±0.001
600 0.293±0.033 0.014±0.001 0.320±0.024 0.014±0.001 0.794±0.051 0.015±0.001 0.775±0.048 0.031±0.002
650 0.399±0.056 0.020±0.002 0.704±0.045 0.026±0.001 0.935±0.124 0.027±0.001 0.927±0.067 0.037±0.001
700 0.709±0.077 0.023±0.001 1.130±0.097 0.025±0.002 1.672±0.101 0.032±0.002 - -
VaLe (cm3/mol) -66.608±4.80 -74.615±7.63 -59.081±7.49 -44.227±3.86
VaSf (cm3/mol) -49.987±4.45 -54.243±6.87 -57.653±6.03 -52.786±4.23
a: Kinetic constant of the labile fraction b: Kinetic constant of the stable fraction c: Value based on mean of three replicates d: Standard error e:Activation volume of the heat stable fraction f:Activation volume of the heat labile fraction

HHP inactivation kinetics of PME RESULTS
98
25 ºC
-1.4
-1.2
-1.0
-0.8
-0.6
-0.4
-0.2
0.0
0 10 20 30 40 50 60 70 80
Time (min)
Log
(A/A
o)
55 ºC
-2.0
-1.8
-1.6
-1.4
-1.2
-1.0
-0.8
-0.6
-0.4
-0.2
0.0
0 10 20 30 40 50
Time (min)
LOG
(A/A
o)
Figure 4.3.2: Combined thermal and high-pressure inactivation of PME in the
orange juice-milk beverage fitted by a biphasic model.
The pressure inactivation of orange PME in different matrices in the range
of 350-800 MPa is presented in Figure 4.3.4. No pressure inactivation was
observed below 400 MPa in the orange juice-milk based beverage and orange juice
environment and below 550 MPa for the purified enzyme in a buffer system.
Truong, (2002) also found a pressure threshold of 400 MPa below which no PME
inactivation was observed in a single-strength orange juice. A remaining activity of
17% and 6% was observed respectively after a treatment at 750 MPa in the orange
juice-milk based beverage system and a treatment of 700 MPa in orange juice. A
remaining activity of 20% was observed after a treatment at 800 MPa for the
purified enzyme. Opposite to thermal treatment, the high pressure inactivation of
purified PME was less pronounced than in all other matrices tested meaning that
the purified enzyme was more pressure-stable. As observed in the thermal
treatment, the level of purification of the enzyme could affect the stability of the
enzyme, increasing in this case its pressure resistance. On the other hand, the pH of
the buffer was close to 7 so the enzyme pressure resistance is increased at neutral
45 ºC
-1.0
-0.9-0.8
-0.7-0.6
-0.5
-0.4-0.3
-0.2-0.1
0.0
0 10 20 30 40 50 60 70
Time (min)
LOG
(A/A
o)
65 ºC
-1.6
-1.4
-1.2
-1.0
-0.8
-0.6
-0.4
-0.2
0.0
0 5 10 15 20 25 30 35
Time (min)
Log
(A/A
o)

HHP inactivation kinetics of PME RESULTS
99
pH values showing that the inactivation mechanism differs between both
technologies.
-0.2
0.0
0.2
0.4
0.6
0.8
1.0
1.2
45 50 55 60 65 70 75 80 85 90T (ºC)
A/A
o
Purified Enzyme Orange juice Beverage
Figure 4.3.3: Isothermal inactivation of purified PME, PME in the
orange juice-milk based beverage and PME in orange juice. The standard
deviation was expressed by error bars.
The higher stability of PME in the orange juice-milk based beverage can be
explained by the fact that factors, such as pH, ºBrix, Ca2+ion content, orange
variety, time of harvesting and purification level of the enzyme affect the
sensitivity of the orange PME to the different preservation treatments. There is also
a theory that when the composition of the orange juice-milk based beverage is
more complex it protects PME against thermal treatment. This could be due to the
milk environment, in which proteins can bind with the enzyme, thus becoming
more resistant (Kumura et al., 1993). The presence of sucrose can also protect the
enzyme against thermal or pressure treatment. Seyderhelm et al., (2004) and Van
den Broeck et al., (1999 a) found that at higher sucrose content the pressure
inactivation of pectinarase was lower arguing that sucrose decreased the water

HHP inactivation kinetics of PME RESULTS
100
activity and since denaturation of enzymes requires water it protects the PME
against the thermal treatment.
0.0
0.2
0.4
0.6
0.8
1.0
1.2
350 400 450 500 550 600 650 700 750 800
P (MPa)
A/A
o
Purified enzyme Orange Juice Beverage
Figure 4.3.4: Pressure inactivation of purified PME, PME in an orange
juice-milk based beverage and PME in orange juice. The standard deviation
was expressed by error bars.
A biphasic model was fitted to the thermal and combined thermal and high
pressure inactivation data of PME in juice and milk-based beverage assuming that
two fractions with different stabilities occur. After thermal and combined thermal
and high pressure treatments between 6-8% of stable fraction was found. Severe
conditions based on combining high temperatures and high pressures were
necessary to completely inactivate the enzyme. Similar treatments performed by
other authors in simpler media yielded higher PME inactivation rate, which implies
that the complex composition of the matrix play an important role in enzyme
stability. Different PME thermal and high pressure stabilities were found
depending on the media studied. PME was found to be more thermostable in the
orange juice-milk beverage media but more pressure-stable in the purified enzyme
in a buffer system, meaning that the composition, pH or enzyme purification level
affect the PME stability against the different technologies studied. The inactivation
mechanism of PME against thermal and high pressure differs and more studies are
needed to understand it.


Pulsed electric fields inactivation of
Lactobacillus plantarum in an orange
juice–milk based beverage: Effect of
process parameters


Effect of PEF parameters on L. plantarum RESULTS
102
Sampedro, F., Rivas, A., Rodrigo, D., Martínez, A. and Rodrigo, M.
Instituto de Agroquímica y Tecnología de Alimentos, CSIC,
Apartado postal 73,
46100 Burjassot, Valencia, Spain
Journal of Food Engineering (2007), 80: 931-938
Keywords: PEF; Inactivation; Beverage; Lactobacillus plantarum; Orange
juice; Milk
4.4.1 ABSTRACT This work studies the effect of electric field strength, treatment time, process temperature,
and pulse width on the inactivation of Lactobacillus plantarum inoculated in an orange juice-milk based beverage. For any given quantity of energy applied, the highest degree of
inactivation was achieved with high field intensities and short treatment times. The inactivation curve had different slopes, one up to application of 200-285 J/mL, a second
stage up to application of 813-891 J/mL in which the inactivation did not increase significantly, and a third stage up to application of 1069-1170 J/mL. When the process
temperature was raised to 55ºC the inactivation increased by 0.5 log, achieving an energy saving of up to 60%. No increase in inactivation was achieved when the pulse width was
increased from 2.5 to 4 μs. The inactivation achieved with L. plantarum in this beverage is
less than that reported by other authors in foods with a simpler composition.

Effect of PEF parameters on L. plantarum RESULTS
103
4.4.2 INTRODUCTION
Mixed fruit juices and milk beverages fortified with vitamins, minerals and
fiber are among the most widely consumed functional foods (Pszczola, 2005) and
consumption of these products has increased by 30% in Europe in the last 10 years,
but only 10% belong to the short shelf-life group that needs a chilled chain for their
storage and distribution (MAPA, 2003). Nevertheless, it is thought that the trend
will increase in the next few years, partly owing to the application of emerging
nonthermal technologies such as High Hydrostatic Pressure (HHP) and Pulsed
Electric Fields (PEF), which find an interesting field for application in these kinds
of products because they allow cold pasteurization while at the same time
preserving their nutritional components. Studies on the possibility of applying PEF
in fruit juices have proliferated in recent years, concentrating mainly on apple and
orange juice and other substrates of a different nature such as soymilk (Li and
Zhang, 2004), apple cider (Evrendilek et al., 2000), chocolate milk (Evrendilek et
al., 2001), mixed juices (Rodrigo et al., 2001; Rodrigo et al., 2003 a), model beer
(Ulmer et al., 2002), horchata (Spanish beverage) (Selma et al., 2003) and beer
with gas (Evrendilek et al., 2004). However, there are no studies on the application
of PEF in the inactivation of microorganisms in juice-milk mixtures such as the
beverage under study.
In studies on inactivation of microorganisms by PEF, some works were
focused on analyzing the influence of process variables on the inactivation, using
buffers or foods with a simple composition as a suspension medium such as skim
milk (Martín et al., 1997), phosphate buffer (Wouters et al., 1999), NaCl and
peptone solution (Aronsson et al., 2001; Aronsson and Rönner, 2001), sodium
phosphate buffer (Abram et al., 2003), citrate phosphate McIlvaine buffer (Álvarez
et al., 2003) and apple juice from concentrate (Heinz et al., 2003). Some of these
studies (Wouters et al., 1999; Abram et al., 2003; Álvarez et al., 2003; Heinz et al.,
2003) are accompanied by a calculation of the energy applied, which makes it
possible to assess their possible applicability in the industry by comparison with
the energy cost of traditional heat treatments, and it can also be useful for
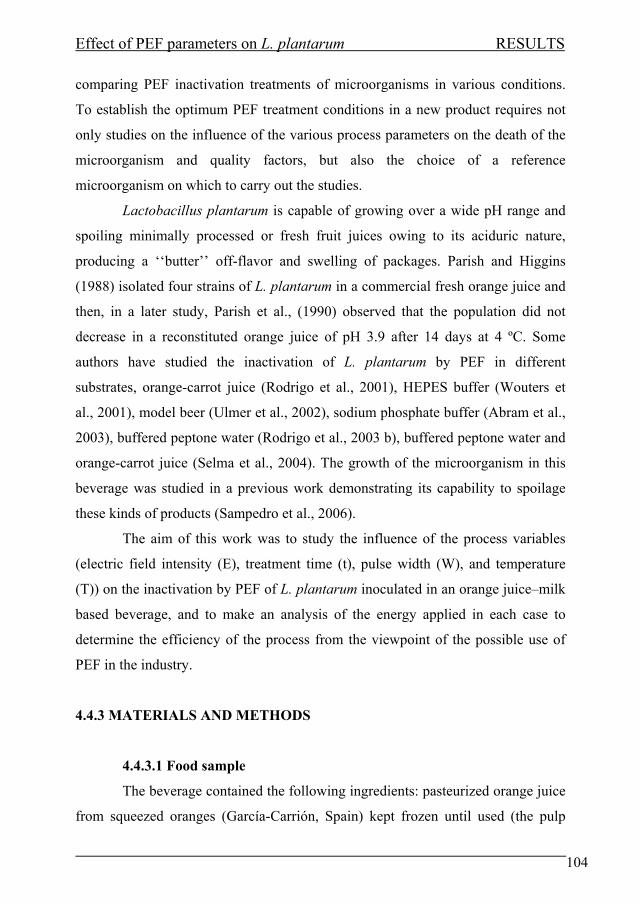
Effect of PEF parameters on L. plantarum RESULTS
104
comparing PEF inactivation treatments of microorganisms in various conditions.
To establish the optimum PEF treatment conditions in a new product requires not
only studies on the influence of the various process parameters on the death of the
microorganism and quality factors, but also the choice of a reference
microorganism on which to carry out the studies.
Lactobacillus plantarum is capable of growing over a wide pH range and
spoiling minimally processed or fresh fruit juices owing to its aciduric nature,
producing a ‘‘butter’’ off-flavor and swelling of packages. Parish and Higgins
(1988) isolated four strains of L. plantarum in a commercial fresh orange juice and
then, in a later study, Parish et al., (1990) observed that the population did not
decrease in a reconstituted orange juice of pH 3.9 after 14 days at 4 ºC. Some
authors have studied the inactivation of L. plantarum by PEF in different
substrates, orange-carrot juice (Rodrigo et al., 2001), HEPES buffer (Wouters et
al., 2001), model beer (Ulmer et al., 2002), sodium phosphate buffer (Abram et al.,
2003), buffered peptone water (Rodrigo et al., 2003 b), buffered peptone water and
orange-carrot juice (Selma et al., 2004). The growth of the microorganism in this
beverage was studied in a previous work demonstrating its capability to spoilage
these kinds of products (Sampedro et al., 2006).
The aim of this work was to study the influence of the process variables
(electric field intensity (E), treatment time (t), pulse width (W), and temperature
(T)) on the inactivation by PEF of L. plantarum inoculated in an orange juice–milk
based beverage, and to make an analysis of the energy applied in each case to
determine the efficiency of the process from the viewpoint of the possible use of
PEF in the industry.
4.4.3 MATERIALS AND METHODS
4.4.3.1 Food sample
The beverage contained the following ingredients: pasteurized orange juice
from squeezed oranges (García-Carrión, Spain) kept frozen until used (the pulp

Effect of PEF parameters on L. plantarum RESULTS
105
was removed), commercial UHT skimmed milk, high methoxyl citrus pectin such
as stabilizer (Unipectine AYD 250, Cargill, USA), commercial citric acid, sugar,
and distilled water. The beverage preparation and physicochemical characteristics
were described in Chapter 1. The beverage was prepared just before use.
4.4.3.2 Lactobacillus plantarum
The culture of L. plantarum CECT 220 was provided by the Spanish Type
Culture Collection. Cells were obtained according to Sampedro et al., (2006). For
that, the freeze-dried microorganism was dissolved in 15 mL of MRS broth
(Scharlau Chemie S.A., Barcelona, Spain) during 30 min at 37ºC. Then, the content
was placed in 500 mL of MRS broth with continuous agitation at 37ºC. The
exponential phase was reached after 12-16 h and the stationary growth stage after
16-20 h. 500 mL of the culture was centrifuged twice (Beckman J-25) at 3220g, 5
min and 4ºC and dissolved in 100 and 50 mL of MRS broth, respectively. The
content was transferred to 2 mL vials with 1 mL of suspension and 1 mL of
glycerol 20% diluted with MRS broth and kept at 80ºC. No cell viability decrease
was observed during frozen storage (data not shown). Just before the PEF
treatment (5 min) the beverage was inoculated with the thawed microorganism,
reaching a final concentration of 3-4 107 CFU/mL.
4.4.3.3 PEF treatment
An OSU-4D bench-scale continuous unit (Ohio State University, USA)
was used to treat the food sample. Six co-field chambers with a diameter of 0.23
cm and a gap distance of 0.293 cm between electrodes were connected in series.
One cooling coil was connected before and after each pair of chambers and
submerged in a circulating bath (Polystat, Cole Parmer, USA) to maintain the
selected initial temperature (35 or 55ºC, final maximum temperature 55 and 72ºC).
The temperature was recorded by thermocouples (T type) at the entrance of the
first treatment chamber (initial temperature) and at the exit of the last treatment
chamber (final temperature). The values were recorded with a data logger (Control

Effect of PEF parameters on L. plantarum RESULTS
106
Company, USA). Pulse waveform, voltage, and current in the treatment chambers
were monitored with a digital oscilloscope (Tektronix TDS 210, Tektronix, USA).
The flow rate was set at 60 mL/min with a peristaltic pump (XX 80002 30, 6–600
rpm, Millipore, USA). A bipolar square-wave of 2.5 μs was selected. Treatment
time ranged from 0 to 180 μs, and the electric field was set at 35 and 40 kV/cm. A
negative control was carried out immediately after the microorganism was added to
the beverage (700 mL) and after the treatment to ensure no inactivation took place
because of the acid environment. One sample was collected after each treatment
time. They were serially diluted in sterile 0.1% peptone water, plated in MRS agar,
and incubated for 48 h at 37ºC. The experiments were performed to obtain three
valid repetitions.
The influence of the temperature was studied by applying electric field
strengths of 35 and 40 kV/cm treatment times between 0 and 180 μs, pulse width
of 2.5 μs (110-356 Hz) and initial temperature of 55ºC. The influence of the pulse
width was also studied by applying 4 μs width pulses (68-123 Hz), electric field
strength of 35 and 40 kV/cm and treatment times ranging from 0 to 180 μs
combined with temperature (35 and 55ºC). The energy input (Q) was calculated by
the following equation used by Abram et al., (2003), Min et al., (2003) and Pérez
and Pilosof, (2004):
Q (J L-1) = E2σt Equation 4.4.1
where E is the electric field strength (kV/cm), σ is the electrical
conductivity of the product (S/m) calculated for each process temperature (Figure
8.2.1) and t is the treatment time (s).
4.4.3.4 Statistical analysis
A hierarchical experimental design was used to study the influence of the
different parameters: two electric field strengths, seven treatment times, two pulse

Effect of PEF parameters on L. plantarum RESULTS
107
widths, and two temperatures. The statistical analysis was performed using the
SPSS 12.0 software, applying a univariant ANOVA test with a significance level of
95.0%.
4.4.4 RESULTS
4.4.4.1 Effect of electric field strength
Figure 4.4.1 showed the survival curves against treatment time (Figure
4.4.1a) and energy applied (Figure 4.4.1b) for L. plantarum with the application of
E=35 and 40 kV/cm. The curves had different slopes. The cell population of the
microorganism decreased rapidly with short treatments (40 μs or 200-285 J/mL)
with an inactivation of 1.5 log but there was a more resistant fraction remaining
(40-110 μs with 40 kV/cm or 130 μs with 35 kV/cm with the application of 813-
891 J/mL). This residue was inactivated slowly when the treatment times were
increased, without producing significant differences in the survival fraction (Table
8.2.7). A final application of 110-130 μs (40 kV/cm) or 180 μs (35 kV/cm) with
1069-1170 J/mL increased the inactivation to 1.9-2.1 log. A maximum inactivation
of 2.12 log was achieved using E = 40 kV/cm, t = 130 μs, and T<55ºC.
Comparison of the two field intensities studied showed that greater
inactivation was achieved by applying 40 kV/cm and 130 μs (2.12 log), using 1069
J/mL of energy, than by 35 kV/cm, 180 μs and 1170 J/mL (1.9 log). When short
treatment times (40-60 μs) were applied, there were non-significant differences
between the 35 and 40 kV/cm fields (Table 8.2.8). When treatment time was
increased (80 and 130 μs), the differences were higher and significant differences
among the electric field strengths were found (Table 8.2.8 and Table 4.4.1). Taking
these differences into account, during the first phase of inactivation treatment time
was the variable with the greatest influence, and as longer treatment times were
applied the inactivation was increasingly due to the electric field intensity.

Effect of PEF parameters on L. plantarum RESULTS
108
A
-2.5
-2
-1.5
-1
-0.5
0
0 50 100 150 200
Treatment time (µs)
Log
(S)
40 kV/cm
35 kV/cm
B
-2.5
-2.0
-1.5
-1.0
-0.5
0.0
0 200 400 600 800 1000 1200 1400
Q (J/ml)
Log
(S)
40 kV/cm
35 kV/cm
Figure 4.4.1: Inactivation curves as a function of the treatment time
(A) and energy applied (B) for L. plantarum with T=35 ºC and pulse width of
2.5 μs. The standard deviation was expressed by error bars.
4.4.4.2 Effect of temperature
The influence of process temperature was studied by setting the bath
temperature at 35 or 55ºC. The results showed that when temperature increased
there was an increase on inactivation for all the treatment times. The analysis of
variance showed significant differences in the logarithm of the survivor fraction
between the two values of temperature at 35 kV/cm (Figure 4.4.2a) and 40 kV/cm
(Figure 4.4.2b) (Table 8.2.9). A maximum inactivation of 2.46 log was achieved
with E=40 kV/cm, 130 μs, 2.5 μs, and 1358 J/mL, which was an increase of almost
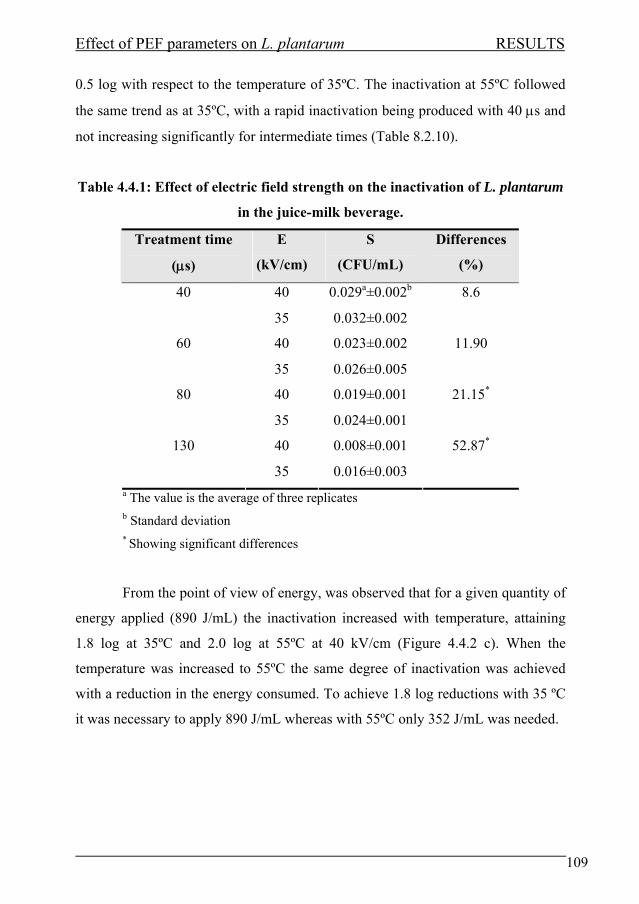
Effect of PEF parameters on L. plantarum RESULTS
109
0.5 log with respect to the temperature of 35ºC. The inactivation at 55ºC followed
the same trend as at 35ºC, with a rapid inactivation being produced with 40 μs and
not increasing significantly for intermediate times (Table 8.2.10).
Table 4.4.1: Effect of electric field strength on the inactivation of L. plantarum
in the juice-milk beverage.
Treatment time
(μs)
E
(kV/cm)
S
(CFU/mL)
Differences
(%)
40 0.029a±0.002b 40
35 0.032±0.002
8.6
40 0.023±0.002 60
35 0.026±0.005
11.90
40 0.019±0.001 80
35 0.024±0.001
21.15*
40 0.008±0.001 130
35 0.016±0.003
52.87*
a The value is the average of three replicates b Standard deviation * Showing significant differences
From the point of view of energy, was observed that for a given quantity of
energy applied (890 J/mL) the inactivation increased with temperature, attaining
1.8 log at 35ºC and 2.0 log at 55ºC at 40 kV/cm (Figure 4.4.2 c). When the
temperature was increased to 55ºC the same degree of inactivation was achieved
with a reduction in the energy consumed. To achieve 1.8 log reductions with 35 ºC
it was necessary to apply 890 J/mL whereas with 55ºC only 352 J/mL was needed.
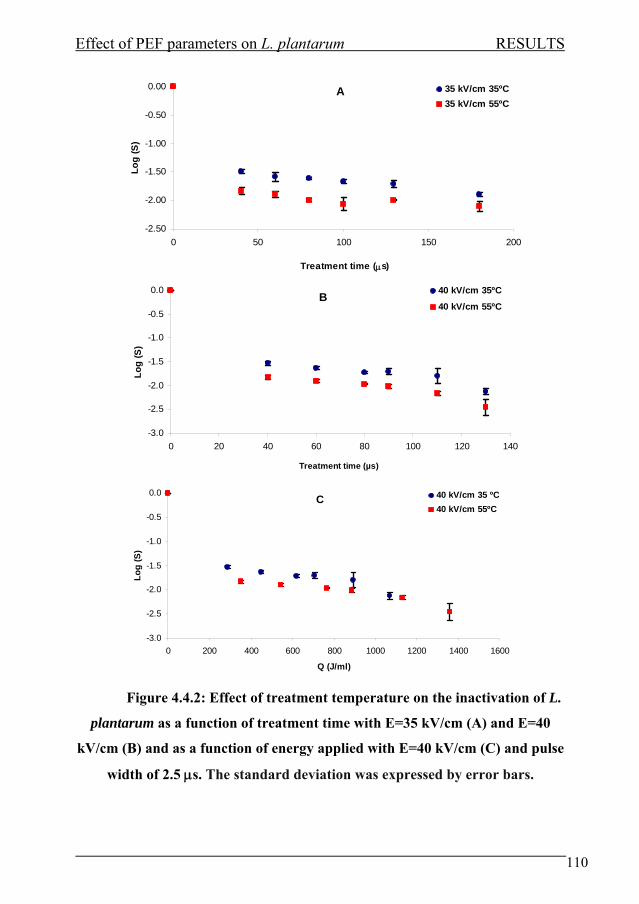
Effect of PEF parameters on L. plantarum RESULTS
110
A
-2.50
-2.00
-1.50
-1.00
-0.50
0.00
0 50 100 150 200
Treatment time (μs)
Log
(S)
35 kV/cm 35ºC35 kV/cm 55ºC
B
-3.0
-2.5
-2.0
-1.5
-1.0
-0.5
0.0
0 20 40 60 80 100 120 140
Treatment time (µs)
Log
(S)
40 kV/cm 35ºC
40 kV/cm 55ºC
C
-3.0
-2.5
-2.0
-1.5
-1.0
-0.5
0.0
0 200 400 600 800 1000 1200 1400 1600
Q (J/ml)
Log
(S)
40 kV/cm 35 ºC40 kV/cm 55ºC
Figure 4.4.2: Effect of treatment temperature on the inactivation of L.
plantarum as a function of treatment time with E=35 kV/cm (A) and E=40
kV/cm (B) and as a function of energy applied with E=40 kV/cm (C) and pulse
width of 2.5 μs. The standard deviation was expressed by error bars.

Effect of PEF parameters on L. plantarum RESULTS
111
4.4.4.3 Effect of pulse width
The influence of pulse width was studied by applying pulse widths of 2.5
and 4 μs. When 40 kV/cm was applied, varying the pulse width did not produce a
significant increase in the inactivation (Table 8.2.11), and in fact a greater
inactivation was achieved with 2.5 μs (Figure 4.4.3b). With 35 kV/cm there were
also no significant differences when the pulse width was increased (Table 8.2.11),
but a slightly greater inactivation was achieved with 4 μs (Figure 4.4.3a).
Analysis of the energy applied showed that for a given quantity of energy
an increase in pulse width did not produce an increase in the degree of inactivation
at 35 kV/cm (Figure 4.4.3c) and 40 kV/cm (Figure 4.4.3d). When the temperature
was increased to 55ºC results were similar to those obtained for 35ºC. There were
no significant differences on inactivation between using pulse widths of 2.5 or 4 μs
with the same quantity of energy applied for 40 kV/cm (Table 8.2.12) (Figure
4.4.4a). Applying 35 kV/cm was also confirmed that there was a slightly greater
inactivation with a pulse width of 4 μs but without significant differences (Table
8.2.12) (Figure 4.4.4b). With 4 μs there was also a greater inactivation when the
process temperature was increased from 35 to 55ºC, which also implied a saving in
the energy consumed to attain the same degree of inactivation (Figure 4.4.5 a and
b).
A
-2.5
-2.0
-1.5
-1.0
-0.5
0.0
0 50 100 150 200
Treatment time (µs)
Log
(S)
35 kV/cm 2.5 µs35 kV/cm 4 µs

Effect of PEF parameters on L. plantarum RESULTS
112
B
-2.5
-2.0
-1.5
-1.0
-0.5
0.0
0 20 40 60 80 100 120 140Treatment time (µs)
Log
(S)
40 kV/cm 2.5 µs40 kV/cm 4 µs
C
-2.5
-2.0
-1.5
-1.0
-0.5
0.0
0 200 400 600 800 1000 1200 1400Q (J/ml)
Log
(S)
35 kV/cm 2.5 µs35 kV/cm 4 µs
D
-2.5
-2.0
-1.5
-1.0
-0.5
0.0
0 200 400 600 800 1000 1200Q (J/ml)
Log
(S)
40 kV/cm 2.5 µs40 kV/cm 4 µs
Figure 4.4.3: Influence of pulse width in the inactivation of L.
plantarum at 35 ºC as a function of treatment time with E=35 kV/m (A) and
E=40 kV/cm (B) and energy applied with E=35 kV/cm (C) and E=40 kV/cm
(D). The standard deviation was expressed by error bars.

Effect of PEF parameters on L. plantarum RESULTS
113
A
-3.0
-2.5
-2.0
-1.5
-1.0
-0.5
0.0
0 200 400 600 800 1000 1200 1400 1600
Q (J/ml)
Log
(S)
2.5 µs 55ºC4 µs 55ºC
B
-3.0
-2.5
-2.0
-1.5
-1.0
-0.5
0.0
0 200 400 600 800 1000 1200 1400 1600
Q (J/ml)
Log
(S)
2.5 µs 55ºC4 µs 55ºC
Figure 4.4.4: Influence of pulse width in the inactivation of L. plantarum at 55
ºC as a function of energy applied with E=35 kV/cm (A) and E=40 kV/cm (B).
The standard deviation was expressed by error bars.
A
-2.5
-2.0
-1.5
-1.0
-0.5
0.0
0 200 400 600 800 1000 1200 1400 1600
Q (J/ml)
Log
(S)
35 kV/cm 4 µs 35ºC35 kV/cm 4 µs 55ºC
Effect of PEF parameters on L. plantarum RESULTS
114
B
-2.5
-2.0
-1.5
-1.0
-0.5
0.0
0 200 400 600 800 1000 1200 1400
Q (J/ml)
Log
(S)
40 kV/cm 4 µs 35ºC40 kV/cm 4 µs 55ºC
Figure 4.4.5: Effect of treatment temperature on the inactivation of L.
plantarum as a function of energy applied with E=35 kV/cm (A) and E=40
kV/cm (B) and pulse width of 4 μs. The standard deviation was expressed by
error bars.
4.4.5 DISCUSSION
Various factors influence the effectiveness with which the application of
PEF inactivates microorganisms. In general, when the electric field or the treatment
time increases there is an increase in the inactivation, but in this study there was a
very rapid decrease in the number of microorganisms at the start of the treatment
and as the treatment continued the microorganism became more pulse-resistant.
The same conclusions were reached by Raso et al., (2000) and Aronsson et al.,
(2001), who observed that at any electric field strength investigated the inactivation
was very fast in the first moments of the treatment and then the number of
survivors decreased slowly. The reduction in the viability was caused mostly by the
first pulses, and increasing the number of pulses did not have the same effect as the
first ones.
If the effect of electric field strength is expressed in terms of energy, it
would succeed in inactivating a substantial fraction of microorganisms with a small
amount of energy at the start of the treatment and it would be necessary to go
beyond a minimum level to increase the inactivation for a given electric field
Effect of PEF parameters on L. plantarum RESULTS
115
intensity. Some authors showed that there were minimum field intensities or
treatment times at which pore formation took place in the membrane of the
microorganism, depending among other things on the geometry and size of the cell
(Li and Zhang, 2004; Picart et al., 2002; Ulmer et al., 2002; Wouters et al., 1999).
In the smallest cells it is usually necessary to apply higher field intensities to cause
electroporation (Heinz et al., 2002). In our case, this was applicable to the quantity
of energy, and therefore, once electroporation took place, it was necessary to go
beyond a certain energy level to increase the inactivation.
When the variable temperature is taken into account, an increase in process
temperature produced an increase in the degree of inactivation achieved. The
increase in inactivation with temperature is attributed to a decrease in the electrical
breakdown potential of the membrane (Reina et al., 1998), which increases the
fluidity of the cell membrane, affecting its physical stability and decreasing the
critical field intensity so that electroporation takes place (Aronsson et al., 2001).
Some authors have studied the heat inactivation of L. plantarum in different
substrates. Tait et al., (1991) studied the heat inactivation of L. plantarum in a
buffer at pH 4 obtaining a D value of 1.81 min at 50ºC and at pH 7 obtaining a D
value of 3.64 min at 55ºC. In a further study, De Angelis et al., (2004) obtained a D
value of 32.9, 14.7 and 7.14 s at 60, 72 and 75ºC of L. plantarum in sterile milk. It
could be deduced that the treatment time used in this study is not enough to
produce heat inactivation of the microorganism. Moreover, increasing the initial
treatment temperature achieved equal or greater levels of inactivation with the
application of much small quantities of energy, which in our case meant a saving of
up to 60%. Wouters et al., (1999) observed that when they applied 40 J/mL a
greater inactivation was achieved with a process temperature of 40ºC than with 20
or 30ºC for Listeria innocua in sodium-phosphate buffer. In order to obtain a
reduction of 5 log, Heinz et al., (2003) observed that with an initial temperature of
45ºC it was necessary to apply 100 kJ/kg, whereas if the temperature was increased
to 65ºC less than 10 kJ/kg was needed.

Effect of PEF parameters on L. plantarum RESULTS
116
It could be also verified that an increase in pulse width did not produce an
increase in inactivation independently from temperature and electric field strength.
Raso et al., (2000) and Mañas et al., (2001) also found that for electric fields of 22
and 33 kV/cm and same treatment time the inactivation was independent of the
pulse width when it ranged between 2-15 μs and 1.2-1.9 μs, respectively. However,
some authors have demonstrated that at a higher pulse width the inactivation is also
higher, but by applying a higher treatment time and in consequence more energy
(Martín et al., 1997; Martín-Belloso et al., 1997). But in this work the treatment
time and energy were the same for the different pulse widths. Nevertheless, some
authors concluded that applying the same quantity of energy, the inactivation
achieved was greater at higher pulse width. Aronsson et al., (2001) increased the
pulse duration from 2 to 4 μs for the same treatment time, they found that the
inactivation was greater with 4 μs but the differences were greater at high electric
field intensities and Abram et al., (2003) also found that when they increased the
pulse width over 1 μs, with E=25 kV/cm and the same energy input, the
inactivation increased with the pulse width. The effect of pulse width is not clear
and seems to vary depending on the conditions applied such as electric field.
According to this, in our study it could be seen that the field intensity was
related with the effectiveness of the pulses, because at smaller intensities there was
greater inactivation with the larger pulse width. Wouters et al., (1999) came to the
same conclusion, observing that varying the pulsed width (2, 3 and 3.9 μs) the
inactivation achieved was greater applying the largest pulse width at an intensity of
28 kV/cm but at 36 kV/cm there were not significant differences in the inactivation
when the pulse width was varied. Further experiments are needed to clarify the
effect of pulse width on the inactivation of microorganisms by PEF.
In connection with what was stated earlier, L. plantarum is not a
particularly small cell and therefore, a priori, it should not be a particularly pulse-
resistant microorganism. In this respect, other authors have achieved greater levels
of inactivation for other strains of the same microorganism in simpler substrates.
Effect of PEF parameters on L. plantarum RESULTS
117
Reductions of 3.6 log was reached by Wouters et al., (2001) after E=25 kV/cm and
120 J/mL in a phosphate buffer (pH 4.5 and 0.15 S/m), and Ulmer et al., (2002)
reached 4 log after E=34.8 kV/cm and 50 kJ/kg in a model beer (pH 3.6 and
electrical conductivity of 0.120-0.178 S/m). Abram et al., (2003) reached 3.66 log
reductions after E=33.4 kV/cm, t = 90 μs, pulse width of 5 μs, and energy applied
of 100 kJ/L in a Na phosphate buffer (pH 4.5 and 0.1 S/m).
If the treatment intensity expressed as quantity of energy applied is
compared, in this work was applied 100 kJ/L and achieved 2.1 log or 135 kJ/L and
achieved 2.5 log. The authors cited earlier achieved greater levels of inactivation
by applying energy quantities 10 times smaller in other substrates and with
different PEF equipment. One of the causes could be the electric conductivity,
which in many cases was considerably less than that of our beverage (0.286 S/m)
and could affect the effectiveness of the treatment. Nevertheless, in similar
conditions with the application of exponential wave pulses, Rodrigo et al., (2001)
achieved 2.5 log after E=35.8 kV/cm and 46.3 μs in orange-carrot juice with an
electric conductivity of 0.455 S/m. The composition also seemed to affect the
effectiveness of the treatment. Some works show that fat and other components
could protect the microorganism (Martín et al., 1997; Min et al., 2002) although
there are other authors who did not observe this phenomenon (Dutreux et al., 2000;
Mañas et al., 2001; Reina et al., 1998).
In a study to optimize process conditions, the treatments and the design of
the equipment for products of this kind should be aimed at the application of high
field intensities and short treatment times, which, on the lines of heat treatment
based on HTST, could be called high electric field short time (HFEST). It would be
necessary to preheat the sample to 30-50ºC and apply pulses of short duration. This
combination of factors would involve a smaller energy cost to obtain a given
degree of inactivation, so that in future it could be possible to equate pulses with
heat treatment and perform an industrial scale-up. Moreover, optimization of these
factors could increase the inactivation and thus obtain degrees of inactivation close
to what is recommended by the authorities concerned with food safety.

Effect of PEF parameters on L. plantarum RESULTS
118
Nevertheless, there is a need for systematic studies on the influence of pulses in
foods with a more complex composition to compare their effectiveness and
understand the mechanisms by which they act.

Effect of temperature and
substrate on PEF inactivation of
Lactobacillus plantarum in an
orange juice–milk beverage


PEF inactivation kinetics of L. plantarum RESULTS
120
Sampedro, F., Rivas, A., Rodrigo, D., Martínez, A. and Rodrigo, M.
Instituto de Agroquímica y Tecnología de Alimentos, CSIC,
Apartado postal 73,
46100 Burjassot, Valencia, Spain
European Food Research and Technology (2006), 223: 30–34.
Keywords: PEF; Orange juice; Milk ; Lactobacillus plantarum ; Inactivation ;
Modelling
4.5.1 ABSTRACT The inactivation kinetics of Lactobacillus plantarum in an orange juice-milk beverage treated by
Pulsed Electric Fields (PEF) were studied. Experimental data were fitted to Bigelow and Hülsheger kinetic models and Weibull frequency distribution function. Results indicate that both
Hülsheger model and Weibull function fit well the experimental data being Accuracy factor
values (Af) closer to 1 and Mean Square Error (MSE) closer to 0. The tcw parameter can be
considered as a kinetic indicator as it expresses the microorganism’s resistance to treatment by electric pulses. An increase in temperature favored the inactivation of L. plantarum by PEF
as reflected by a decreased in tcw value. Under the same conditions to those studied by
other authors we reached less inactivation of L. plantarum in the beverage used in this study than in substrates with a simpler composition.

PEF inactivation kinetics of L. plantarum RESULTS
121
4.5.2 INTRODUCTION
The consumption of fruit juices and drinks based on juice and milk
subjected to a low pasteurization and stored under refrigeration has experienced a
spectacular increase in the last few years, particularly in developed countries. This
is in response to a growing demand for minimally processed foods that are
perceived by consumers as healthier. The potential attraction of these products is
that they preserve the original characteristics of fresh food whilst offering
innovative new flavor mixtures. Over the last few years, nonthermal technologies
such as the Pulsed Electric Fields (PEF) have been studied on both, laboratory and
industrial scale and can be used in the preservation of food as fruit juices, milk and
liquid whole egg (Sampedro et al., 2005; Rodrigo et al., 2005). They have the
potential to inactivate microorganisms while maintaining the products original
characteristics. However, studies showing the capability of PEF as an alternative to
heat in the inactivation of microorganism in foods with a complex composition are
scarce (Vega-Mercado et al., 1996; Sharma et al., 1998; Evrendilek et al., 2000;
Evrendilek et al., 2001; Ulmer et al., 2002; Rodrigo et al., 2001; Rodrigo et al.,
2003 a; Selma et al., 2003; Selma et al., 2004; Li and Zhang, 2004; Evrendilek et
al., 2004).
Lactobacillus plantarum is a spoilage microorganism frequently found in
juice based products. Between 2.7 and 8.9% of L. plantarum on the orange’s
surface enters the juice during extraction and that this level remained constant
overtime (Pao and Davis, 2001). When the juice is mixed with other substrates to
produce a more sophisticated or nutritional foodstuff, contamination is transferred
and there is the likelihood that L. plantarum grows and spoils the product. The
inactivation of this microorganism by PEF has been studied in different substrates
and foodstuffs (Rodrigo et al., 2001; Wouters et al., 2001; Ulmer et al., 2002;
Rodrigo et al., 2003 a; Abram et al., 2003; Selma et al., 2003). However, the nature
of the inactivation of the microorganism by pulse treatment has not been studied in
foods made by a mixture of fruit juice and milk where different components and
their interactions can affect the death of the microorganism.

PEF inactivation kinetics of L. plantarum RESULTS
122
Different authors have tried to model the microorganism inactivation
curves through predictive mathematical models that fit approximately to the curve
shape which relates the survivor fraction with treatment time at different field
intensities. The majority of inactivation curves have been analyzed by predictive
models which presume a linear behavior (Bigelow, 1921; Hülsheger et al., 1981)
and several authors have applied it to PEF technology (Pothakamury et al., 1995;
Martín-Belloso et al., 1997 a and b; Sensoy et al., 1997; Raso et al., 1998; Wouters
et al., 1999). As in many emergent preserving technologies, the relationship
between the log of the survival fraction and the treatment time does not follow in
many cases a lineal behavior, rendering curves with tails or shoulders that make
difficult the application of a lineal model. Trying to give an explanation for such
behavior, several authors have assumed that each cell has a different resistance to
pulse treatment and that the resulting inactivation curve is the sum of a series of
lethal events expressed in the form of distribution. One frequency distribution
model widely applied to interpret biological phenomena was developed (Weibull,
1951). This distribution has been applied by some authors to describe inactivation
curves after PEF treatment (Rodrigo et al., 2001; Rodrigo et al., 2003 a and b,
Álvarez et al., 2003 a and b; Lebovka and Vorobiev, 2004). The aim of this work is
to characterize the inactivation by PEF of L. plantarum in an orange juice-milk
beverage as an influence of temperature throughout the treatment and substrate as
well as select the best model to describe the survival curves.
4.5.3 MATERIAL AND METHODS
4.5.3.1 Food sample
The beverage contained the following ingredients: pasteurized orange juice
from squeezed oranges (García-Carrión, Spain) kept frozen until use (with the pulp
removed) (500 mL/L), commercial UHT skimmed milk (200 mL/L), high
methoxyl citrus pectin (3 g/L) (Unipectine AYD 250, Cargill, USA), commercial
citric acid (1 g/L), sugar (75 g/L) and distilled water (300 mL/L). The beverage
PEF inactivation kinetics of L. plantarum RESULTS
123
preparation and physicochemical characteristics were described in Chapter 1. The
beverage was prepared just before use.
4.5.3.2 Lactobacillus plantarum
The culture of L. plantarum 220 was provided by the Spanish type culture
collection. Cells were obtained according to Sampedro et al., (2006). For that, the
frozen microorganism was placed in 2 mL vials with MRS broth (Scharlab
Chemie, Spain) and 20% sterile glycerol with an initial concentration of 5×10⁹
CFU/mL in exponential growth stage. A vial was diluted and inoculated in 500 mL
of MRS broth to achieve an initial concentration of 103-104 CFU/mL in continuous
agitation at 37ºC. The exponential phase was reached between 12 and 16 h and the
stationary growth stage between 16 and 20 h. The microorganism was kept for 13 h
to reach the early exponential growth stage. A 500 ml of culture was centrifuged
twice (Beckman J-25) at 3220 g, 5 min and 4ºC and dissolved in 100 and 50 mL of
MRS broth, respectively. The content was transferred into 2 mL vials with 1 mL of
suspension and 1 mL of glycerol 20% diluted with MRS broth and kept at -80ºC.
Before the PEF treatment, the beverage was inoculated with the defrozen
microorganism reaching a final concentration of 3-4×10⁷ CFU/mL.
4.5.3.3 PEF treatment
An OSU-4D bench-scale continuous processing unit was used to treat the
food sample. Six co-field chambers with a diameter of 0.23 cm and a gap distance
of 0.293 cm between electrodes were connected in series. One cooling coil was
connected before and after each pair of chambers and submerged in a circulating
bath (Polystat, Cole Parmer, USA) to maintain the selected initial temperature (35
and 55ºC) (55 and 72ºC maximum temperature of the treatment). The temperature
was recorded by thermocouples (T type) at the entrance of the first treatment
chamber (initial temperature) and at the exit of the last treatment chamber (final
temperature). The values were recorded with a data logger (Control Company,
USA). Pulse waveform, voltage and current in the treatment chambers were

PEF inactivation kinetics of L. plantarum RESULTS
124
monitored with a digital oscilloscope (Tektronix TDS 210, Tektronix, USA). The
flow rate was set at 60 mL/min with a peristaltic pump (XX 80002 30, 6-600
r.p.m., Millipore, USA). A bipolar square-wave of 2.5 μs was selected. Treatment
time ranged from 0 to 700 μs and the electric field was set at 15, 25, 35, and 40
kV/cm. Samples were collected after each treatment time. They were serially
diluted in sterile 0.1% peptone water, plated in MRS agar and incubated for 48 h at
37ºC. The experiments were performed to obtain three valid repetitions. The
influence of the temperature was studied applying electric field strengths of 35 and
40 kV/cm, treatment times between 40 and 180 μs and reaching temperatures
below 72ºC.
4.5.3.4 Mathematical models
The data analysis of two valid replicates used the following models:
Bigelow, (1921):
DtSLog −=)( Equation 4.5.1
where S is the survival fraction after the treatment, t is the treatment time
expressed in μs and D is the kinetic parameter, showing the time required to
achieve one decimal reduction, is also expressed in μs and it can be calculated as
the negative inverse of the inactivation curve slope.
Hülsheger et al., (1981):
⎟⎟⎠
⎞⎜⎜⎝
⎛−=
ct t
tLnbSLn *)( Equation 4.5.2
where bt is the regression coefficient, t is the treatment time in μs and tc is
the critical time expressed in μs (the maximum treatment time in which the
survival fraction equals 1)
Weibull, (1951):

PEF inactivation kinetics of L. plantarum RESULTS
125
b
atSLn ⎟⎠⎞
⎜⎝⎛−=)(
Equation 4.5.3
where a and b are scale and shape parameters, respectively. The b value
gives an idea of the form of the curve, if b>1 the curve is concave downwards (it
forms shoulders), if b<1 the curve is concave upwards (it forms tails) and if b=1
the curve is a straight line and can be described by linear models.
The critical mean time ( tcw ), can be defined by the maximum death per
time in response to the PEF treatment and can be expressed by the following
equation:
⎟⎠⎞⎜
⎝⎛ −+Γ= 11* bacwt Equation 4.5.4
where a and b are the parameters of the Weibull equation and Γ is the
gamma function.
4.5.3.5 Statistical analysis
The models were externally validated with a third valid replicate by using
the Accuracy factor parameter (Af) (Ross, 1996). This factor gives and idea of the
model fitting to the survivor curve of the microorganism and can be defined as
follows:
nobservedfittedLog
Af
∑
=
)/(
10 Equation 4.5.5
where n is the number of observations and the fitted and observed values
are referred to the survival fraction. The meaning of this statistic is the closer to 1
the Af values, the better the model fit the data.
Mean square error (MSE) was also calculated as follows:

PEF inactivation kinetics of L. plantarum RESULTS
126
pnobservedfittedMSE−
∑ −=
2)( Equation 4.5.6
where n is the number of observations, the fitted and observed values are
referred to the survival fraction and p is the number of parameters to be estimated
by the model. The meaning of this statistic is the smaller the MSE values, the better
the model fit the data.
4.5.4 RESULTS AND DISCUSSION
The growth of L. plantarum in the juice-milk beverage has been studied in
this work and results showed an increase of 3 log after 20 h (Figure 4.5.1). The
growth ability of L. plantarum in acid products has been demonstrated before.
McDonald et al., (1990) studied the microorganism growth in a buffer with a pH of
around 3 Results of our study indicate that L. plantarum could be a spoilage
problem for the juice processing industry if it is not adequately controlled. Even
more, the problem could be more acute in this kind of beverages because milk and
sugar can supply additional nutrients to the microorganism.
The survivor curves show the relationship between the survivor’s fraction
of L. plantarum in the beverage with treatment time at different electric field
intensities and are characterized by a rapid decrease in the number of
microorganisms followed by a tail. Different mathematical models were fitted to
the data in order to select one which best describe this concave upwards behavior.
Table 4.5.1 shows the calculated kinetic parameters and the Af and MSE
values of different models for each survivor curve. Results indicate that both
Hülsheger model and Weibull function fit well the experimental data being Af
values closer to 1 and MSE closer to 0 but only Bigelow (D value) and Weibull
( tcw ) equations have parameters that decrease significantly as the field intensity
increases (Table 8.2.13 and 8.2.14). Consequently they can be considered as
behavior indexes for the death of L. plantarum by PEF in the beverage.

PEF inactivation kinetics of L. plantarum RESULTS
127
0.0
2.0
4.0
6.0
8.0
10.0
0 4 8 12 16 20 24
Time (h)
Log
(N) (
CFU
/mL)
Figure 4.5.1: Growth curve of L. plantarum in the orange juice-milk beverage
at 37ºC.
Applying the critical time parameter (tc) or the scale parameter (a) of the
Hülsheger and Weibull models, respectively, are therefore unable to provide a
logical interpretation of the behavior of the microorganism as they are not
representative of the treatment intensity. Af values ranged from 1.4 to 2.0 and from
1.0 to 1.1 for the Bigelow and Weibull models, respectively. Accuracy factors
closer to 1 indicate better predictions. Considering the MSE values, in general
values are closer to 0 in the case of Weibull as well as in the Bigelow model.
Consequently, in this study the Weibull model appears to be the more appropriate
model to interpret the death of L. plantarum in the juice–milk beverage. Figure
4.5.2 shows the fitted curves using the Weibull model. It appears that the model fits
better the experimental data obtained at higher field intensities, probably because at
those high field intensities tails are less apparent.
Temperature can play an important role in pulsed electric field treatments.
Figure 4.5.3 shows the evolution of the survivor’s fraction with treatment time and
temperature at 40 kV/cm. Increasing the initial process temperature (from 35 to
55ºC) increased the actual inactivation. The lower pulse-resistance was reflected by

PEF inactivation kinetics of L. plantarum RESULTS
128
a significant decrease in the tcw value, from 7.0 μs to 5.1 μs at 35 and 55ºC
respectively (Table 8.2.15).
-5.0
-4.0
-3.0
-2.0
-1.0
0.0
0 100 200 300 400 500 600 700 800
Treatment time (μs)
Ln (S
)
40 kV/cm
35 kV/cm
25 kV/cm
15 kV/cm
Figure 4.5.2: Survival curves of L. plantarum in juice-milk based
beverage at different electric field strengths at initial T of 35◦C adjusted to the
Weibull model. The standard deviation was expressed by error bars.
-3.0
-2.5
-2.0
-1.5
-1.0
-0.5
0.0
0 20 40 60 80 100 120 140
Treatment time (µs)
Log
(S)
35ºC tcw=7.15 µs55ºC tcw=5.10 µs
Figure 4.5.3: Effect of T in the survival fraction of L. plantarum and tcw of the
Weibull model in the beverage with E=40 kV/cm. The standard deviation was
expressed by error bars.

PEF inactivation kinetics of L. plantarum RESULTS
129
Other authors have observed a higher inactivation level than ours
combining pulses and temperature in different microorganisms and substrates
(Pothakamury et al., 1995; Aronsson and Rönner, 2001; Heinz et al., 2003). For
this reason, it is necessary to study in greater depth how to optimize pulse
treatment alone or combined with heat to achieve improved inactivation in
complex foods.
In the last few years, some authors have observed that by decreasing
electric conductivity of food the effectiveness of pulses increases (Raso et al.,
1998; Wouters et al., 1999; Rodrigo et al., 2003 b). Some explanations have been
proposed to this event. According to Sensoy et al., (1997) when the medium
conductivity is decreased, it increases the conductivity difference between the
microorganism’s cytoplasm and the medium, causing an additional pressure in the
microorganism membrane due to the osmotic forces and making it more sensitive
to the pulse treatment.
Food composition (proteins, fat, etc.) can cause resistance to the treatment
and protect the microorganism against pulses. Inactivation achieved in E. coli was
greater in milk diluted two or three times compared to milk diluted only once, this
may be because of lower protein content and greater resistance, enabling the
absorption of free radicals and ions that actively participate in cell breaking
(Martín-Belloso et al., 1997) and the same conclusions were obtained by (Min et
al., 2002) with E. cloacae in chocolate liquor. Whereas Reina, et al., (1998),
Dutreux et al., (2000) and Mañas et al., (2001) did not found differences in the
inactivation of L. monocytogenes, E. coli and L. innocua and E. coli respectively in
substrates with different concentration in fat.
To illustrate the effect of food composition, the results of this work were
compared with the tcw values for the same strain of L. plantarum obtained in
other products, orange-carrot juice (conductivity of 0.455 S/m) and peptone water
(conductivity of 0.6 S/m) (Rodrigo et al., 2001; Rodrigo et al., 2003 a) in Table
4.5.2. For 25 kV/cm a tcw value of 32.0 μs in peptone water and 50.5 μs in the

PEF inactivation kinetics of L. plantarum RESULTS
130
juice-beverage was obtained. When applying 35 kV/cm a 6.7 μs tcw for the
orange-carrot juice and 9.4 μs for the juice-milk beverage were achieved. This
appears to indicate that the more complex the substrates, the more resistant the
microorganism to pulses. Furthermore, because of distinct substrate composition
the differences are more pronounced between the peptone water and the orange-
milk beverage than between the orange-milk beverage and the orange-carrot juice.
So, pulses are more effective in simpler foods despite of pulsed electric fields are
more effective at low conductivity levels. Therefore, we can conclude despite that
conductivity is the main cause affecting pulse effectiveness, there are other factors
that can influence its effect. Among the reasons for the lower inactivation might be
the incorporation of additives such as pectin, milk protein and fat which seem to
protect the microorganisms from pulses.
To conclude, the Weibull model gives a good adjustment and the tcw parameter
can describe the lethality of treatment it is therefore the model which best describes
the inactivation curves of L. plantarum in the beverage. The combination of
temperature and PEF produces an increase in inactivation as shown by a decreasing
tcw . Compared with other substrates studied in similar conditions by other
authors, the complexity of the beverage produces a decrease in final inactivation.
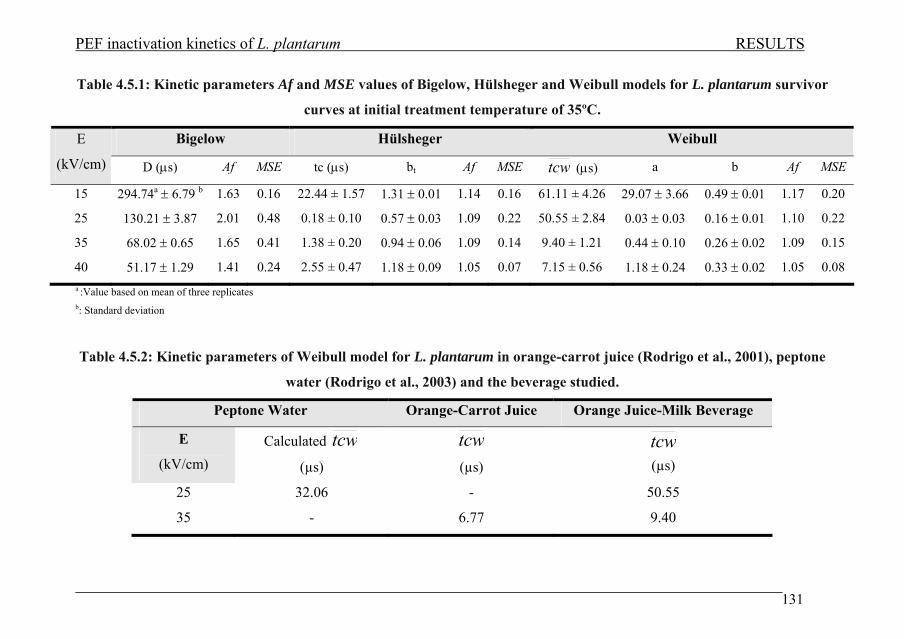
PEF inactivation kinetics of L. plantarum RESULTS
131
Table 4.5.1: Kinetic parameters Af and MSE values of Bigelow, Hülsheger and Weibull models for L. plantarum survivor
curves at initial treatment temperature of 35ºC.
Bigelow Hülsheger Weibull E
(kV/cm) D (μs) Af MSE tc (μs) bt Af MSE tcw (μs) a b Af MSE
15 294.74a ± 6.79 b 1.63 0.16 22.44 ± 1.57 1.31 ± 0.01 1.14 0.16 61.11 ± 4.26 29.07 ± 3.66 0.49 ± 0.01 1.17 0.20
25 130.21 ± 3.87 2.01 0.48 0.18 ± 0.10 0.57 ± 0.03 1.09 0.22 50.55 ± 2.84 0.03 ± 0.03 0.16 ± 0.01 1.10 0.22
35 68.02 ± 0.65 1.65 0.41 1.38 ± 0.20 0.94 ± 0.06 1.09 0.14 9.40 ± 1.21 0.44 ± 0.10 0.26 ± 0.02 1.09 0.15
40 51.17 ± 1.29 1.41 0.24 2.55 ± 0.47 1.18 ± 0.09 1.05 0.07 7.15 ± 0.56 1.18 ± 0.24 0.33 ± 0.02 1.05 0.08 a :Value based on mean of three replicates b: Standard deviation
Table 4.5.2: Kinetic parameters of Weibull model for L. plantarum in orange-carrot juice (Rodrigo et al., 2001), peptone
water (Rodrigo et al., 2003) and the beverage studied.
Peptone Water Orange-Carrot Juice Orange Juice-Milk Beverage
E
(kV/cm) Calculated tcw
(µs)
tcw
(µs)
tcw
(µs)
25 32.06 - 50.55
35 - 6.77 9.40

Effect of pH and pectin
concentration on the inactivation
kinetics by PEF of Salmonella
typhimurium in an orange juice-
milk beverage

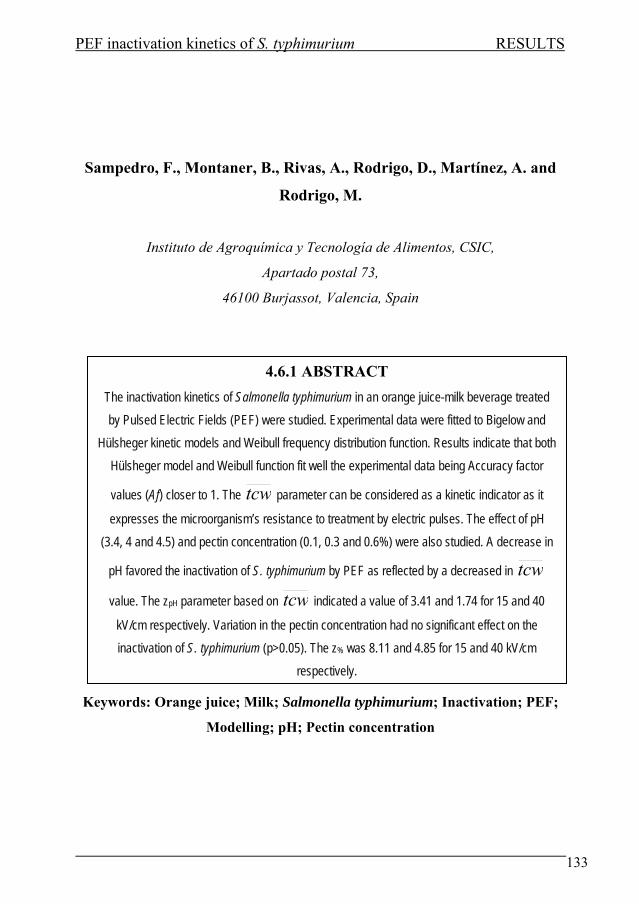
PEF inactivation kinetics of S. typhimurium RESULTS
133
Sampedro, F., Montaner, B., Rivas, A., Rodrigo, D., Martínez, A. and
Rodrigo, M.
Instituto de Agroquímica y Tecnología de Alimentos, CSIC,
Apartado postal 73,
46100 Burjassot, Valencia, Spain
Keywords: Orange juice; Milk; Salmonella typhimurium; Inactivation; PEF;
Modelling; pH; Pectin concentration
4.6.1 ABSTRACT The inactivation kinetics of Salmonella typhimurium in an orange juice-milk beverage treated by Pulsed Electric Fields (PEF) were studied. Experimental data were fitted to Bigelow and
Hülsheger kinetic models and Weibull frequency distribution function. Results indicate that both Hülsheger model and Weibull function fit well the experimental data being Accuracy factor
values (Af) closer to 1. The tcw parameter can be considered as a kinetic indicator as it
expresses the microorganism’s resistance to treatment by electric pulses. The effect of pH (3.4, 4 and 4.5) and pectin concentration (0.1, 0.3 and 0.6%) were also studied. A decrease in
pH favored the inactivation of S. typhimurium by PEF as reflected by a decreased in tcw
value. The zpH parameter based on tcw indicated a value of 3.41 and 1.74 for 15 and 40
kV/cm respectively. Variation in the pectin concentration had no significant effect on the inactivation of S. typhimurium (p>0.05). The z% was 8.11 and 4.85 for 15 and 40 kV/cm
respectively.

PEF inactivation kinetics of S. typhimurium RESULTS
134
4.6.2 INTRODUCTION
Consumption of juices and non-carbonated beverages based on mixes of
citric juices and milk has increased by 30% in Europe in the last ten years, but only
10% belong to the short shelf-life group that needs a chilled chain for their storage
and distribution (Artiach, 2005). Nevertheless, it is thought that the trend will
increase in the next few years, partly owing to the application of emerging non-
thermal technologies such as High Hydrostatic Pressure (HHP) and Pulsed Electric
Fields (PEF), which find an interesting niche for application in those type of
products because they allow cold pasteurization of the product preserving its
nutritional components. Studies on the possibility of applying PEF in fruit juices
have proliferated in recent years, concentrating mainly on apple and orange juice
and other substrates of a different nature with complex composition such as
soymilk (Li and Zhang, 2004), apple cider (Evrendilek et al., 2000), chocolate milk
(Evrendilek et al., 2001), mixed juices (Rodrigo et al., 2001; Rodrigo et al., 2003
a), model beer (Ulmer et al., 2002), horchata (Spanish beverage) (Selma et al.,
2003) and beer with gas (Evrendilek et al., 2004). However studies showing the
capability of PEF as an alternative to heat in the inactivation of microorganisms in
food with a complex composition such as the beverage under study are scarce.
Different outbreaks in orange juice products involving Salmonella genus
have appeared in the last years around the world. Cook et al., (1998) and Khan et
al., (2007) reported 2 Salmonella outbreaks in Florida and Arizona states (USA) in
non-pasteurized orange juice. Five Salmonella enterica serotypes were found in the
juice and packaging samples. Different samples recovered from the industry
revealed cleaning installation deficiencies. These studies demonstrated the
capability of Salmonella to contaminate and survive in non-pasteurized orange
juice. Castillo et al., (2006) performed a study on the sanitary and cleaning
conditions of different small street sellers in the city of Guadalajara (Mexico)
during 2005. The study was based on samples from orange juice, orange surface
and different utensils used for cleaning purposes. The authors observed a high
Salmonella prevalence (14.3, 20.0 and 22.8%) in orange juice, orange surface and

PEF inactivation kinetics of S. typhimurium RESULTS
135
cleaning utensils respectively. It were found 3 principal serotypes and among them
was S. typhimurium. The contamination found in the orange juice samples reached
in some cases 105 CFU/mL. The lack of properly hygienic conditions in utensils
and equipments, cross-contamination or the non adequate storage conditions are
the possible causes of the high Salmonella prevalence.
The acid-tolerance of different Salmonella strains has been previously
studied by different authors. Parish et al., (1997) studied the growth of different
Salmonella serovars in orange juice at different pH values (3.5-4.4) incubated at 0
and 4ºC. The juice was inoculated with 106 CFU/mL surviving 27 days at pH 3.5,
46 days at pH 3.8, 60 days at pH 4.1 and 73 days at pH 4.4. Later on, Pao et al.,
(1998) studied the growth of different pathogen microorganisms (among them
Salmonella) on the orange surface. They obtained a survival period of 14 days at
24ºC and pH of 6-6.5 being inhibited at 4-8ºC. The authors concluded that the
refrigeration of raw material could be a good practice to reduce Salmonella
prevalence in the orange fruit. Yuk and Schneider (2006) showed that the acid pre-
adaptation of several Salmonella strains in fruit juices produced higher resistance
to the gastric juice. The resistance varied depending on the adaptation temperature,
type of juice (organic acid) and serotype used. The study demonstrated that the acid
pre-adaptation in diverse fruit juices could increase the probability of infection
developing.
Parameters such as pH, initial contamination, sugars content or enzyme
activity have a great variability during the orange harvest season. Due to this fact,
is important to know the effect of the product physicochemical characterization on
PEF microbial inactivation. Several authors have studied PEF inactivation of
Salmonella typhimurium (Liang et al., 2002; Álvarez et al., 2003) and the effect of
the pH in several Salmonella strains (Álvarez, et al., 2000) but there are no studies
on a mixture of orange juice and milk. On the other hand, companies are
continuously creating new food formulation and composition to make it more
suggestive to the consumer. Food based on the mixture of different fruit juices and
milk with the addition of an adequate stabilizer (pectin derivatives) is essential to

PEF inactivation kinetics of S. typhimurium RESULTS
136
maintain the product stability. For this reason, is important to know the effect of
pectin concentration on PEF Salmonella inactivation.
The aim of the present work is to study the influence of the pH and pectin
concentration on the inactivation by PEF of S. typhimurium inoculated in an orange
juice-milk based beverage.
4.6.3 MATERIALS AND METHODS
4.6.3.1 Food Sample
The beverage contained the following ingredients: 50% pasteurized orange
juice from squeezed oranges provided by (García-Carrión, Spain) kept frozen until
used (the pulp was removed), 20% commercial UHT skimmed milk, 0.3% high
methoxyl citrus pectin such as stabilizer (Unipectine AYD 250, Cargill, USA),
7.5% sugar, and 30% distilled water. The beverage preparation and
physicochemical characteristics were described in Chapter 1. The beverage was
prepared just before use.
4.6.3.2 Salmonella typhimurium
The culture of Salmonella typhimurium CECT 443 was provided by the
Spanish Type Culture Collection. Cells were obtained according to Sampedro et
al., (2006). For that, the frozen microorganism was placed in 2-mL vials with
Tryptic Soy Broth (TSB) (Scharlab CHEIME, Spain) and 20% sterile glycerol with
an initial concentration of 6x10⁸ CFU/mL in stationary growth stage. A vial was
diluted and inoculated in 500 mL of TSB to achieve an initial concentration of 103-
104 CFU/mL at 37 ºC. The exponential phase was reached after 10 hours and the
stationary growth stage after 14 hours. The 500 mL of the culture was centrifuged
twice (J-25, Beckman, USA) at 3220 x g, 5 min and 4ºC, and was dissolved in 100
and 50 mL of TSB respectively. The content was transferred to 2-mL vials with 1
mL of suspension and 1 mL of glycerol 20% diluted with TSB and kept at -80ºC
observing no cell viability decrease during the frozen storage (data not shown). Just
PEF inactivation kinetics of S. typhimurium RESULTS
137
before the PEF treatment (5 min) the beverage (700 mL) was inoculated with the
defrozen microorganism in stationary growth phase reaching a final concentration
of 3.5x10⁶ CFU/mL.
4.6.3.3 PEF treatment
An OSU-4D bench-scale continuous unit was used to treat the food sample.
Eight co-field chambers with a diameter of 0.23 cm and a gap distance of 0.293 cm
between electrodes were connected in series. One cooling coil was connected
before and after each pair of chambers and submerged in a circulating bath
(Polystat, Cole Parmer, USA) to maintain the selected temperature at 5ºC. The
temperature was recorded by thermocouples (K type) at the entrance of the first
treatment chamber (initial temperature) and at the exit of the last treatment
chamber (final temperature). The values were recorded with a data logger (Control
Company, USA). Pulse waveform, voltage, and current in the treatment chambers
were monitored with a digital oscilloscope (Tektronix TDS 210, Tektronix, USA).
The flow rate was set at 30 mL/min with a peristaltic pump (XX 80002 30, 6-600
rpm, Millipore, USA). A bipolar square-wave of 2.5 μs was selected. Treatment
time ranged from 0 to 2500 μs, and the electric field was set at 15, 25, 35 and 40
kV/cm for the product at pH=4 and 0.3% of pectin concentration. A negative
control was carried out immediately after the microorganism was added to the
beverage and after the treatment to ensure no inactivation took place because of the
acid environment. Samples were collected after each treatment time. The different
treatments were serially diluted in sterile 0.1% peptone water, plated in Tryptic soy
agar (TSA) and incubated for 24 h at 37 ºC. The experiments were performed to
obtain three valid repetitions. The effect of pH (3.5, 4 and 4.5) and pectin
concentration (0.1, 0.3 and 0.6%) was studied at 15 and 40 kV/cm for treatment
times ranged from 0 to 2500 μs.
4.6.3.4 Mathematical models
The data analysis of two valid replicates used the following models:

PEF inactivation kinetics of S. typhimurium RESULTS
138
Bigelow, 1921:
DtSLog −=)( Equation 4.6.1
where S is the survival fraction after the treatment, t is the treatment time
expressed in μs and D is the kinetic parameter, showing the time required to
achieve one decimal reduction, is also expressed in μs and it can be calculated as
the negative inverse of the inactivation curve slope.
Hülsheger et al., (1981):
⎟⎟⎠
⎞⎜⎜⎝
⎛−=
ct t
tLnbSLn *)( ºEquation 4.6.2
where bt is the regression coefficient, t is the treatment time in μs and tc is
the critical time expressed in μs (the maximum treatment time in which the
survival fraction equals 1)
Weibull, 1951:
b
atSLn ⎟⎠⎞
⎜⎝⎛−=)(
Equation 4.6.3
where a and b are scale and shape parameters, respectively. The b value
gives an idea of the form of the curve, if b>1 the curve is concave downwards (it
forms shoulders), if b<1 the curve is concave upwards (it forms tails) and if b=1
the curve is a straight line and can be described by linear models.
The critical mean time ( tcw ) can be defined by the maximum death per
time in response to the PEF treatment and can be expressed by the following
equation:
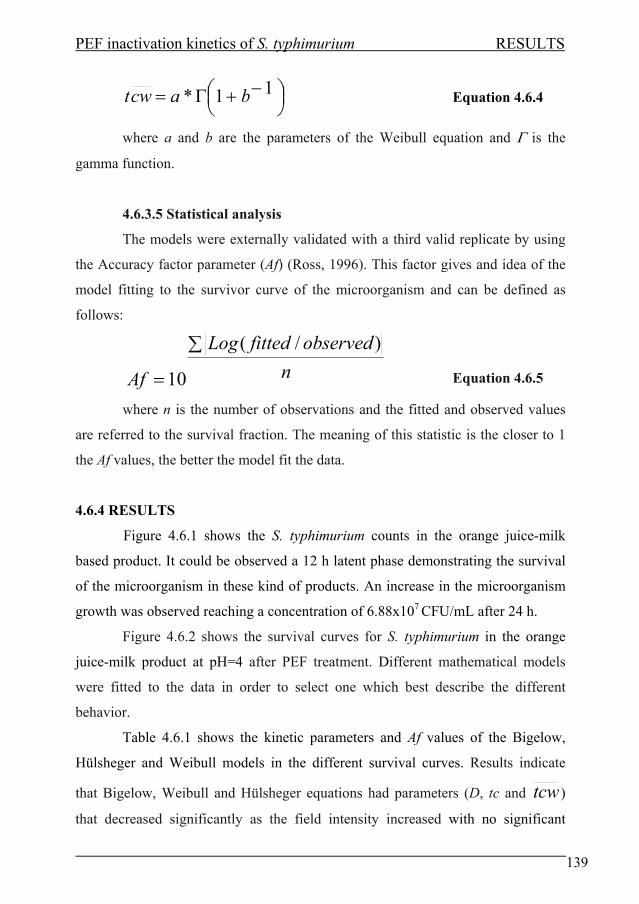
PEF inactivation kinetics of S. typhimurium RESULTS
139
⎟⎠⎞⎜
⎝⎛ −+Γ= 11* bacwt Equation 4.6.4
where a and b are the parameters of the Weibull equation and Γ is the
gamma function.
4.6.3.5 Statistical analysis
The models were externally validated with a third valid replicate by using
the Accuracy factor parameter (Af) (Ross, 1996). This factor gives and idea of the
model fitting to the survivor curve of the microorganism and can be defined as
follows:
nobservedfittedLog
Af
∑
=
)/(
10 Equation 4.6.5
where n is the number of observations and the fitted and observed values
are referred to the survival fraction. The meaning of this statistic is the closer to 1
the Af values, the better the model fit the data.
4.6.4 RESULTS
Figure 4.6.1 shows the S. typhimurium counts in the orange juice-milk
based product. It could be observed a 12 h latent phase demonstrating the survival
of the microorganism in these kind of products. An increase in the microorganism
growth was observed reaching a concentration of 6.88x10⁷ CFU/mL after 24 h.
Figure 4.6.2 shows the survival curves for S. typhimurium in the orange
juice-milk product at pH=4 after PEF treatment. Different mathematical models
were fitted to the data in order to select one which best describe the different
behavior.
Table 4.6.1 shows the kinetic parameters and Af values of the Bigelow,
Hülsheger and Weibull models in the different survival curves. Results indicate
that Bigelow, Weibull and Hülsheger equations had parameters (D, tc and tcw )
that decreased significantly as the field intensity increased with no significant
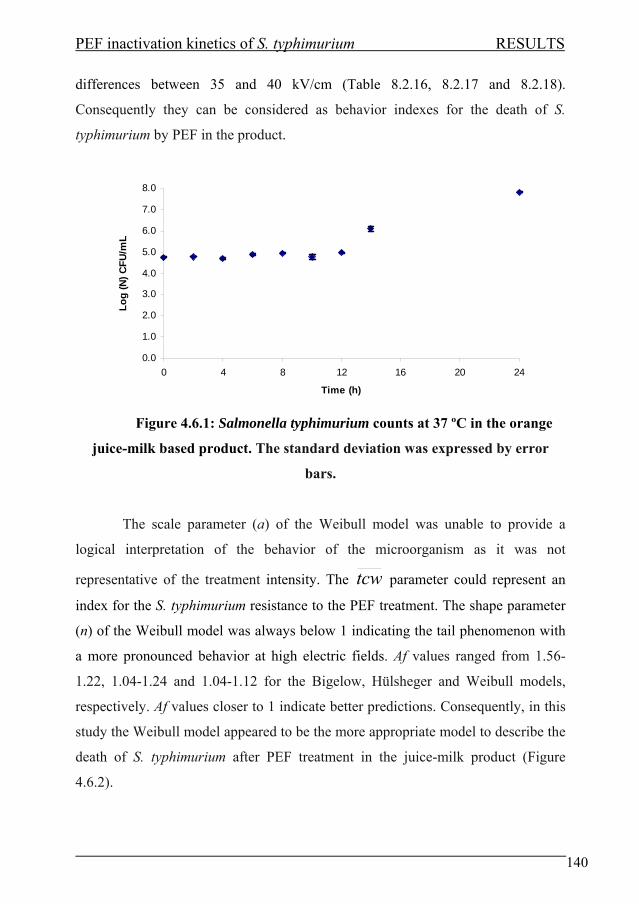
PEF inactivation kinetics of S. typhimurium RESULTS
140
differences between 35 and 40 kV/cm (Table 8.2.16, 8.2.17 and 8.2.18).
Consequently they can be considered as behavior indexes for the death of S.
typhimurium by PEF in the product.
0.0
1.0
2.0
3.0
4.0
5.0
6.0
7.0
8.0
0 4 8 12 16 20 24
Time (h)
Log
(N) C
FU/m
L
Figure 4.6.1: Salmonella typhimurium counts at 37 ºC in the orange
juice-milk based product. The standard deviation was expressed by error
bars.
The scale parameter (a) of the Weibull model was unable to provide a
logical interpretation of the behavior of the microorganism as it was not
representative of the treatment intensity. The tcw parameter could represent an
index for the S. typhimurium resistance to the PEF treatment. The shape parameter
(n) of the Weibull model was always below 1 indicating the tail phenomenon with
a more pronounced behavior at high electric fields. Af values ranged from 1.56-
1.22, 1.04-1.24 and 1.04-1.12 for the Bigelow, Hülsheger and Weibull models,
respectively. Af values closer to 1 indicate better predictions. Consequently, in this
study the Weibull model appeared to be the more appropriate model to describe the
death of S. typhimurium after PEF treatment in the juice-milk product (Figure
4.6.2).

PEF inactivation kinetics of S. typhimurium RESULTS
141
Sampedro et al., (2006) and Rivas et al., (2006) studied the PEF
inactivation kinetics of L. plantarum (Gram+) and E. coli (Gram-) recovered in
logarithmic phase in the orange juice-milk based product. Comparing the tcw
values for both microorganisms it could be observed a higher pulse-resistance of L.
plantarum reflected by an increase in tcw value (Table 4.6.2). Different studies
have showed higher PEF treatment resistance in Gram+ bacteria due principally to
differences in membrane composition (Hülsheger et al., 1981). Comparing tcw
values of both microorganisms with the one of S. typhimurium (Gram-) recovered
in stationary phase, it was observed that tcw value was significantly higher than
the rest of microorganisms studied (Table 8.2.19) demonstrating a higher pulse-
resistance. In consequence the growth phase plays an important role in the
microorganism resistance to PEF treatment.
-5.0-4.5-4.0-3.5-3.0-2.5-2.0-1.5-1.0-0.50.0
0 500 1000 1500 2000 2500 3000
Treatment time (μs)
Ln (S
)
15 kV/cm25 kV/cm40 kV/cm35 kV/cm
Figure 4.6.2-Survival curves of S. typhimurium in the juice-milk based
beverage at (♦) 15 kV/cm, (▲) 25 kV/cm, (■) 35 kV/cm and (●) 40 kV/cm at
pH=4 adjusted to the Weibull model (―).The standard deviation was
expressed by error bars.

PEF inactivation kinetics of S. typhimurium RESULTS
142
Table 4.6.1: Kinetic parameters and Af and MSE values of Bigelow, Hülsheger and Weibull models for S. typhimurium
survivor curves.
Bigelow Hülsheger Weibull E
(kV/cm) D
(μs) Af tc (μs) bt Af
tcw
(μs) a b Af
15 1454.65a ± 27.33b 1.22 53.82 ± 1.48 0.77 ± 0.00 1.24 478.51 ± 9.21 331.38 ± 2.24 0.62 ± 0.01 1.10
25 454.25 ± 15.31 1.47 23.33 ± 1.09 0.99 ± 0.01 1.10 111.45 ± 0.47 33.19 ± 1.29 0.50 ± 0.00 1.12
35 234.81 ± 7.32 1.56 4.60 ± 1.07 0.89 ± 0.09 1.04 38.38 ± 8.54 2.51 ± 0.81 0.27 ± 0.03 1.04
40 149.01 ± 2.17 1.44 1.36 ± 0.02 0.76 ± 0.02 1.12 24.61 ± 1.60 6.48 ± 1.03 0.38 ± 0.01 1.08
Table 4.6.2: Comparison of tcw values of Salmonella typhimurium (Gram-,
Stat. phase), Lactobacillus plantarum (Gram+, Log. phase) and Escherichia coli (Gram-,
Log. phase) in the orange juice-milk based product.
E (kV/cm) Salmonella typhimurium Lactobacillus plantarum Escherichia coli
tcw (μs) tcw (μs) tcw (μs)
15 478.51a ± 9.21b 61.11 ± 4.26 5.37 ± 0.69
25 111.45 ± 0.47 50.55 ± 2.84 2.80 ± 0.06
35 38.38 ± 8.54 9.40 ± 1.21 1.98 ± 0.55
40 24.61 ± 1.60 7.15 ± 0.56 1.60 ± 0.99
a :Value based on mean of three replicates b: Standard deviation
a :Value based on mean of three replicates b: Standard deviation

PEF inactivation kinetics of S. typhimurium RESULTS
143
4.6.1 Effect of pH
Figure 4.6.3 and 4.6.4 show the evolution of the survivor’s fraction with
treatment time and pH at 15 kV/cm and 40 kV/cm respectively fitted to the Weibull
model. Decreasing the pH (from 4.5 to 3.5) and increasing the electric field
strength increased the actual inactivation. The lower pulse-resistance was reflected
by a decreasing in the tcw value but with no differences between pH value of 4
and 4.5 (Table 4.6.3 and Table 8.2.20). The tcw parameter could represent a
resistance index of S. typhimurium to the PEF treatment varying the product pH.
Other authors have observed higher inactivation level than the reached in this study
after PEF treatment in simpler substrates at different pH values. Liang et al., (2002)
obtained 5.9 log in Salmonella typhimurium after 50 pulses, 90 kV/cm at 55 ºC in a
freshly squeezed orange juice at pH=3.8. Álvarez et al., (2003) reached a 7 log
cycle inactivation in Salmonella typhimurium after 28 kV/cm, 1300 μs and 35ºC in
citrate-phosphate McIlvaine buffer at pH 7.0. The higher complexity of the product
composition could be a cause of this phenomenon. For this reason, it is necessary
to study in greater depth how to optimize pulse treatment alone or combined with
an acidic environment to achieve improved inactivation in complex foods.
Table 4.6.3: Effect of pH and electric field on tcw value.
3.5 4 4.5 E
(kV/cm) tcw (µs) tcw (µs) tcw (µs)
15 249.05a±25.83b 371.40±39.65 488.74±16.69
40 16.66±1.50 40.03±9.21 61.36±4.45 a :Value based on mean of three replicates b: Standard deviation
Figure 4.6.5 shows the estimation of zpH parameter at different pH values.
zpH value was 3.41 (R2=0.989) and 1.74 (R2=0.962) at 15 kV/cm and 40 kV/cm

PEF inactivation kinetics of S. typhimurium RESULTS
144
respectively. It was observed that the zpH value was lower at 40 kV/cm indicating
that tcw sensitivity to pH variation was higher than at 15 kV/cm.
-5.00-4.50-4.00-3.50-3.00-2.50-2.00-1.50-1.00-0.500.00
0 500 1000 1500 2000 2500 3000
Treatment time (μs)
Ln (S
)
Figure 4.6.3-Survival curves of S. typhimurium in the juice-milk based
beverage at 15 kV/cm at pH=3.5(♦), pH=4(■) y pH=4.5(▲) adjusted to the
Weibull model (―).The standard deviation was expressed by error bars.
-6.0
-5.0
-4.0
-3.0
-2.0
-1.0
0.0
0 50 100 150 200 250 300 350 400
Treatment time (μs)
Ln (S
)
Figure 4.6.4-Survival curves of S. typhimurium in the juice-milk based
beverage at 40 kV/cm at pH=3.5(♦), pH=4(■) y pH=4.5(▲) adjusted to the
Weibull model (―).The standard deviation was expressed by error bars.

PEF inactivation kinetics of S. typhimurium RESULTS
145
y = 0.2928x + 1.3806R2 = 0.9887
y = 0.5662x - 0.7275R2 = 0.9619
11.21.4
1.61.8
22.2
2.42.62.8
3 3.2 3.4 3.6 3.8 4 4.2 4.4 4.6pH
Log
(tcw
)
Figure 4.6.5: zpH estimation at E = 15 kV/cm (♦) and E = 40 kV/cm (■).
4.6.2 Effect of pectin concentration
Figure 4.6.6 and 4.6.7 show the evolution of the survivor’s fraction with
treatment time and pectin concentration at 15 kV/cm and 40 kV/cm at pH 4 fitted
to the Weibull model. Variation of the pectin concentration (from 0.1 to 0.6%) did
not produce any significant effect in the S. typhimurium inactivation after PEF
treatment (Table 8.2.21). However increasing the electric field an inactivation
increase was produced (Table 8.2.22). Table 4.6.4 shows the tcw value at 15
kV/cm and 40 kV/cm and different pectin concentrations. There were no
significant differences among the different pectin percentage samples (Table
8.2.21). This indicates a non protective effect of pectin concentration on PEF
inactivation of S. typhimurium.
Table 4.6.4: Effect of pectin concentration and electric field strength on tcw
value.
0.10% 0.30% 0.60% E
(kV/cm) tcw (µs) tcw (µs) tcw (µs)
15 402,67 ± 5.81 488,74 ± 16.69 516,93 ± 60.10
40 37.37 ± 9.76 61.36 ± 4.45 45.50 ± 0.58

PEF inactivation kinetics of S. typhimurium RESULTS
146
-4.00
-3.50
-3.00
-2.50
-2.00
-1.50
-1.00
-0.50
0.00
0 500 1000 1500 2000 2500 3000
Treatment time(μs)
Ln (S
)
Figure 4.6.6-Survival curves of S. typhimurium in the juice-milk based
beverage at 15 kV/cm at 0.1% (♦), 0.3% (■) and 0.4% (▲) adjusted to the
Weibull model (―).The standard deviation was expressed by error bars.
-5.0-4.5-4.0-3.5-3.0-2.5-2.0-1.5-1.0-0.50.0
0 50 100 150 200 250 300 350 400
Treatment time (μs)
Ln (S
)
Figure 4.6.7-Survival curves of S. typhimurium in the juice-milk based
beverage at 40 kV/cm at 0.1% (♦), 0.3% (■) and 0.4% (▲) adjusted to the
Weibull model (―).The standard deviation was expressed by error bars.
The z% value obtained was 4.85 (R2=0.831) and 8.11 (R2=0.819) at 15 and
40 kV/cm respectively (Figure 4.6.8).

PEF inactivation kinetics of S. typhimurium RESULTS
147
y = 0.2062x + 2.6004R2 = 0.8315
y = 0.1233x + 1.6317R2 = 0.819
0
0.5
1
1.5
2
2.5
3
0 0.1 0.2 0.3 0.4 0.5 0.6 0.7
% pectin
Log
(tcw
)
Figure 4.6.8: z% estimation at E = 15 kV/cm (♦) and E = 40 kV/cm (■).
To conclude, Weibull model gives a good fitting and tcw parameter can
describe the lethality of treatment, it is therefore the model which best describes the
inactivation curves of S. typhimurium in the product. The combination of pH and
PEF produced an increase in the inactivation by a decreasing in tcwvalue.
Variation in the pectin concentration did not produce any added effect. Compared
with other substrates studied, the complexity of the product produces a decrease in
final inactivation. In our opinion development of new PEF equipment and PEF
processing combined with pH and other technologies (heat and antimicrobials) will
conduct to an overall effectiveness improvement.

Shelf-life study of an orange juice-
milk based beverage after
combined PEF and thermal
processing


Shelf-life study RESULTS
149
Sampedro, F1., Geveke, D. J.2., Fan, X2., Rodrigo, D3. and Zhang, Q.H2.
1Institute of AgroChemistry and Food Technology, CSIC, P.O. Box 73, 46100
Burjassot, Valencia, Spain. 2Eastern Regional Research Center, Agricultural Research Service, United States
Department of Agriculture, 600 East Mermaid Lane, Wyndmoor, PA 19038, USA. 3Nutrition and Bromatology Area, Faculty of Pharmacy, University of Valencia,
Vicent Andrés Estellés S/N, 46100, Burjassot, Valencia, Spain.
Keywords: Orange juice; Milk; Shelf-life; PEF; Thermal
4.7.1 ABSTRACT The effect of thermal and pulsed electric field (PEF) processing, that produced similar PME
inactivation, on shelf-life of an orange juice-milk beverage (OJMB) was studied. Physical properties (pH, ºBrix), microbial population, pectin methyl esterase (PME) activity, color
measurement and volatile compounds concentration were investigated during the storage of the product at 8-10 ºC for 4 weeks. The pH was not affected by any treatment but decreased
during the storage in the untreated sample. The Brix degrees were decreased by the two treatments. The thermal and PEF treatments initially inactivated the PME activity by 90%.
During the storage the PME activity remained constant in the treated samples and decreased slightly in the untreated sample. The bacterial and mold and yeast counts reduction was similar
after the two treatments (4.5 and 4.1 log CFU/mL -thermal- 4.5 and 5.0 log CFU/mL -PEF-). Based on the initial bacterial load of the control, it was estimated that the shelf-lives of the
OJMB treated with thermal and PEF treatment stored at 8-10 °C were 2 and 2.5 weeks respectively. Differences were observed in the color parameters of the OJMB among the two
treatments with a higher difference observed in the thermally processed sample respect to the control. The relative volatile compounds concentration was higher in the OJMB processed by
PEF treatment than thermally processed sample. During storage the loss of volatile compounds was lower in the PEF sample while thermal and control samples had a similar rate
of loss. For an OJMB, the combination of PEF and mild heat achieved the same degree of microbial and enzyme inactivation as thermal treatment, but preserving better the original
product characteristics during the storage.

Shelf-life study RESULTS
150
4.7.2 INTRODUCTION
A high quantity of new minimally processed foods have appeared on the
market in response to a growing demand for natural products that are perceived by
consumers as healthier. Among them, are beverages based on a mixture of fruit
juices and milk, fortified with vitamins, minerals, and fiber, which are the most
widely consumed functional foods (Pszczola, 2005); however, there are little data
related to quality and safety of these products.
These products need a chilled chain for their storage and distribution.
Many refrigerators in Europe are set at a temperature around 8ºC. This situation
points to conducting the research on the shelf-life of these products at more
realistic conditions using temperatures higher than 4ºC. Many studies on shelf-life
that compare different technologies (PEF, thermal and HHP) apply different
intensity treatments (Jia et al., 1999, Yeom et al., 2000, Rivas et al., 2006, Élez, et
al., 2006, Aguilar et al., 2007) being the results not comparable. When fairly
comparing different technologies it is very important to choose the right conditions
in order to apply the same intensity to the product. This comparison can be done
using a microbiological index (inactivation of a selected microorganism or
microbial flora) or enzymatic index (inactivation of a selected enzyme). In our
study the conditions to obtain the same degree of PME inactivation by thermal and
PEF treatment were selected from a previous work (Sampedro et al., 2008).
Pectin methyl esterase (PME) is an important enzyme in orange juice based
products and thermal preservation treatments are based on the PME inactivation
level of >90 % because its thermotolerance is higher than the majority of
microorganisms found naturally in this type of product, causing the cloud loss or
gelification of juice concentrates (Tribess et al., 2006). Severe conditions (90 ºC, 1
min or 95 ºC, 30 s) are necessary to inactivate orange PME (Cameron et al., 1994,
Do Amaral et al., 2005). Normally industry adopts these conditions to pasteurize
orange juice 88-95 ºC, 15-30 s (Irwe and Olson, 1994). Unfortunately, these
treatments can modify the original aroma, color and other attributes of the fresh
orange juice (Farnworth, et al., 2001, Lee and Coates, 2003).
Shelf-life study RESULTS
151
Several authors have studied the shelf-life of different foodstuff after PEF
and thermal treatments such as blended orange and carrot juice (Rivas et al., 2006),
apple juice and cider (Evrendilek, et al., 2000), cranberry juice and chocolate milk
(Evrendilek et al., 2001), tomato juice (Min and Zhang, 2003, Min et al., 2003) and
orange juice (Yeom et al., 2000, Ayhan et al., 2002, Min et al., 2003 a, Élez, et al.,
2006) but there are no studies on the effects of PEF and thermal treatment on the
shelf-life of a mixture of orange juice and milk.
The aim of this work was to perform a shelf-life study of an orange juice-
milk based beverage after thermal and PEF treatment.
4.7.3 MATERIAL AND METHODS
4.7.3.1 Beverage preparation
Fresh Valencia var. oranges were purchased at a local supermarket. The
oranges were squeezed with the aid of a juice extractor (Zumex 38, Zumex, S.A.,
Spain) and the juice was filtered with cheese cloth and stored at -40 ºC until use.
The OJMB contained the following ingredients: fresh orange juice (500 mL/L),
commercial UHT skimmed milk (200 mL/L), high methoxyl citrus pectin
(Unipectine AYD 250, Cargill, USA) (3 g/L), sucrose (75 g/L), and deionized
water (300 mL/L). Prior to mixing, solid ingredients were dissolved in water in the
weight proportions indicated. The OJMB was prepared just before use. The OJMB
physicochemical characteristics were reported in a previous article (Sampedro et
al., 2007).
4.7.3.2 Thermal treatment
Thermal treatment conditions were chosen based on the results obtained in
a previous work in order to obtain a 90% of PME inactivation (Sampedro et al.,
2008). The experiments were carried out in a plate and frame heat exchanger
equipped with nominal 66 s hold time tube (FT74X/HTST/UHT, Armfield, Inc.,
UK). OJMB placed in a feeding tank was driven by a pump to the heat exchanger
Shelf-life study RESULTS
152
at 17 ml/s where it was rapidly heated to 85 ºC. Then the product reached the
holding tube where the treatment conditions (85 ºC, 66 s) were maintained. After
the treatment, the OJMB was immediately cooled with cold water in a cooler
(FT61, Armfield, Inc., UK), and it was packaged and stored until needed for
analysis.
4.7.3.3 PEF treatment
PEF treatment conditions were chosen based on the results obtained in a
previous work in order to obtain a 90% of PME inactivation (Sampedro et al.,
2008). An OSU-4F bench-scale continuous unit (Ohio State University, USA) was
used to treat the food sample (Sampedro et al., 2007). Six co-field chambers with a
diameter of 0.23 cm and a gap distance of 0.29 cm between electrodes were
connected in series. One cooling coil was connected before and after each pair of
chambers and submerged in a circulating bath (model 1016S, Fisher Scientific,
USA) to maintain the selected initial temperature (65ºC). The temperature was
recorded by thermocouples (K type) at the entrance and exit of each pair of
chambers. The entrance of the first treatment chamber can be considered as the
initial temperature and the exit of the last treatment chamber as the final
temperature. The values were recorded with a data logger (Sper Scientific,
Taiwan). Pulse waveform, voltage and current in the treatment chambers were
monitored with a digital oscilloscope (TDS 210, Tektronix, USA). The flow rate
was set at 120 mL/min with a digital gear pump (Cole Parmer, USA). A bipolar
square-wave of 2.5 µs was selected. Treatment time was set at 50 μs and the
electric field at 30 kV/cm. The sample was immediately cooled in ice-water and it
was packaged and stored until needed for analysis.
4.7.3.4 Packaging and storage
The treated product was packaged in clean, sterile twist-off jars inside a
laminar flow hood. The closed jars were stored in a refrigerator at 8-10 ºC in

Shelf-life study RESULTS
153
darkness. Quality analyses discussed in the following sections were carried out
after 1, 2, 3 and 4 weeks.
4.7.3.5 Analysis of headspace volatile compounds
Volatile compounds were extracted with a modification of the method
described by (Fan and Gates, 2001) using a solid-phase microextraction (SPME)
method. A 2 mL aliquot sample was transferred into 6 mL serum vial. The vial,
sealed by a teflon-lined septum and a screw cap, was pre-heated at 60 ºC for 2 min
before a SPME fiber, coated with 100 µm of poly(dimethylsiloxane), was inserted
into the headspace of the sample bottle. After 30 min incubation, the SPME fiber
with adsorbed volatile compounds was inserted into the GC injection port at 250 ºC
and held there for 5 min to desorb volatile compounds. Volatile compounds were
separated by a Hewlett-Packard 6890N/5973 GC-MSD (Agilent Technologies,
USA) equipped with a DB-Wax trace analysis column (30 m x 0.32 mm i.d., 0.5
µm film thickness). The temperature of the GC was programmed from 60 to 96 ºC
at 8 ºC·min-1, increased to 120 ºC at 12 ºC·min-1, then increased to 220 ºC at 10
ºC·min-1 and held for 3 min at the final temperature. Helium was the carrier gas at a
linear flow rate of 39 cm·sec-1. Compounds were identified by comparing spectra
of the sample compounds with those contained in the National Institute of
Standards and Technology library (NIST02). The relative amount of each
compound was expressed as peak area.
4.7.3.6 PME activity measurement
PME activity was determined by measuring the release of acid over time at
pH 7 and 22 ºC. The reaction mixture consisted of 1 mL of sample and 30 mL of
0.35 % citrus pectin solution (Sigma, USA) containing 125 mM NaCl. During
hydrolysis at 22ºC, pH was maintained at 7.0 by adding 10-4 N NaOH using an
automatic pH-stat titrator (Titralab, Radiometer Analytical, SAS). After the first 1
min the consumption of NaOH was recorded every 1 s for a 3 min reaction period.
PME activity was expressed in units (U), defined as micromoles of acid produced
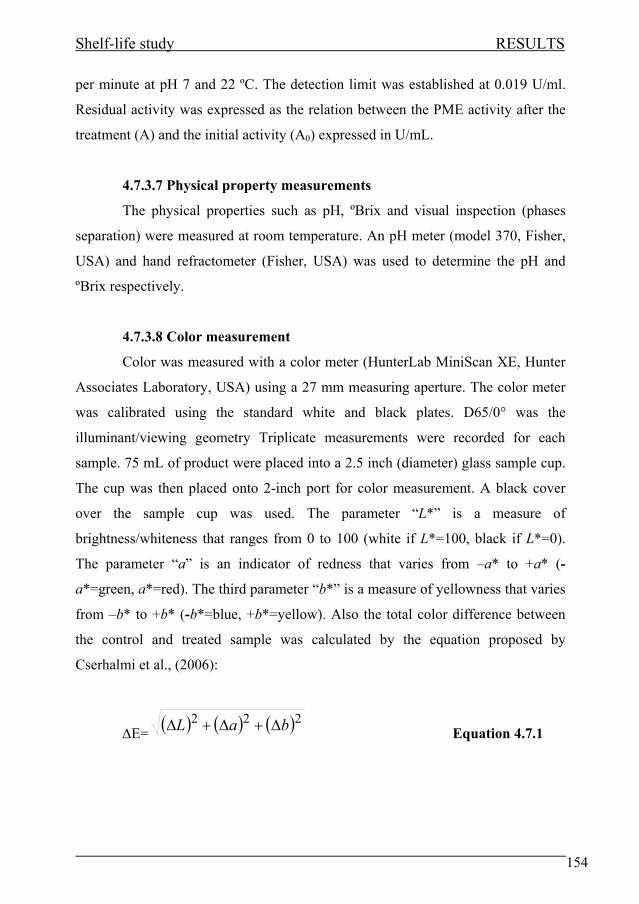
Shelf-life study RESULTS
154
per minute at pH 7 and 22 ºC. The detection limit was established at 0.019 U/ml.
Residual activity was expressed as the relation between the PME activity after the
treatment (A) and the initial activity (A0) expressed in U/mL.
4.7.3.7 Physical property measurements
The physical properties such as pH, ºBrix and visual inspection (phases
separation) were measured at room temperature. An pH meter (model 370, Fisher,
USA) and hand refractometer (Fisher, USA) was used to determine the pH and
ºBrix respectively.
4.7.3.8 Color measurement
Color was measured with a color meter (HunterLab MiniScan XE, Hunter
Associates Laboratory, USA) using a 27 mm measuring aperture. The color meter
was calibrated using the standard white and black plates. D65/0° was the
illuminant/viewing geometry Triplicate measurements were recorded for each
sample. 75 mL of product were placed into a 2.5 inch (diameter) glass sample cup.
The cup was then placed onto 2-inch port for color measurement. A black cover
over the sample cup was used. The parameter “L*” is a measure of
brightness/whiteness that ranges from 0 to 100 (white if L*=100, black if L*=0).
The parameter “a” is an indicator of redness that varies from –a* to +a* (-
a*=green, a*=red). The third parameter “b*” is a measure of yellowness that varies
from –b* to +b* (-b*=blue, +b*=yellow). Also the total color difference between
the control and treated sample was calculated by the equation proposed by
Cserhalmi et al., (2006):
ΔE= ( ) ( ) ( )222 baL Δ+Δ+Δ Equation 4.7.1
Shelf-life study RESULTS
155
Depending on the value of ΔE the color difference could be estimated such
as not noticeable (0-0.5) slightly noticeable (0.5-1.5), noticeable (1.5-3.0), well
visible (3.0-6.0) and great (6.0-12.0).
4.7.3.9 Microbiological assay
The microbial inactivation and growth were examined by diluting the
samples in 0.1 % (w/v) sterile peptone water and plating in Tryptic Soy Agar
(TSA) for bacteria counts and in acidified Potato Dextrose Agar (PDA) for mold
and yeast counts every week for one month. Plates were incubated at 37 ºC for 48 h
for bacteria and yeast counts and at 30 ºC for 5 days for mold counts.
4.7.3.10 Statistical Analysis
The statistical analysis was performed using the software Statgraphics®
Centurion XV (Statistical Graphics Corp.) applying an univariant ANOVA test
with a significance level of 95.0 % (p<0.05). The means of three replicates were
differentiated by Tukey’s test.
4.7.4 RESULTS AND DISCUSSION
4.7.4.1 Effects of processing and storage on physical properties
The effect of thermal and combined PEF and thermal processing on the
OJMB physical properties are shown in Table 4.7.1. There were significant
differences in the pH values after the different treatments (Table 8.2.23), however
the differences were less than 0.3. Many authors have observed no variation in the
pH value after different thermal and PEF treatments in different fruit and vegetable
juices (Min, et al., 2003 a and b, Cserhalmi, et al., 2006, Rivas et al., 2006, Élez, et
al., 2006, Aguilar et al., 2007). During the storage, pH value decreased
significantly in the untreated sample during the first and fourth week due to the
growth of microorganisms that could use the carbohydrates producing lactic acid
(Table 8.2.24). The pH of the thermal and PEF processed samples decreased

Shelf-life study RESULTS
156
significantly during the storage due to the increase in the microbial counts (Table
8.2.24). Élez et al., (2007) found a decrease in pH in the unprocessed sample from
28 to day 56 at 22ºC in an orange juice. Yeom et al., (2000) and Min et al., (2003
a) found no differences in the pH value in the treated samples during the storage of
an orange juice for 112 days at 4 and 22ºC. Rivas et al., (2006) found a decrease in
the pH value in a PEF treated sample (25 kV/cm, 280 μs) at 12ºC after the 8.5th
week owing to the beginning of microbiological spoilage of a blended orange-
carrot juice.
The Brix degrees content decreased significantly after the PEF treatment
with no differences between thermal and untreated sample (Table 8.2.25). However
the differences between the mean values of the untreated and treated samples were
less than 0.5 so practically were negligible. Cserhalmi et al., (2006) and Rivas et
al., (2006) also observed a slight decrease in the Brix content after the PEF
treatment in an orange and blended orange-carrot juice respectively. During the
storage the Brix degrees decreased significantly in the untreated and thermal
sample (Table 8.2.26). The growth of microorganisms could cause this
phenomenon by fermentation of sugars. However there were no significant
differences in the PEF treated samples (Table 8.2.26). Several authors also found
no changes in Brix degrees during the storage of any treated samples at 2 and 12ºC
for 10 weeks in a blended orange-carrot juice and orange juice for 112 days at 4
and 22ºC (Yeom et al ., 2000, Rivas et al., 2006, Min et al., 2003 a).
4.7.4.2 Effects of processing and storage on microbial flora
The effect of thermal processing and combined PEF and thermal treatment
on the total plate count and mold and yeast count in the OJMB are also shown in
Table 4.7.1. Microbial loads of the untreated sample were 5.99 and 5.43 log for
bacteria and yeast and mold counts, respectively. The bacteria and mold and yeast
counts were reduced by 4.5 and 4.1 log cycles by thermal treatment and 4.6 and 5.0
log cycles by the PEF treatment, respectively, with no significant differences in the
microbial reduction among the two technologies (Table 8.2.27). Min et al., (2003 a
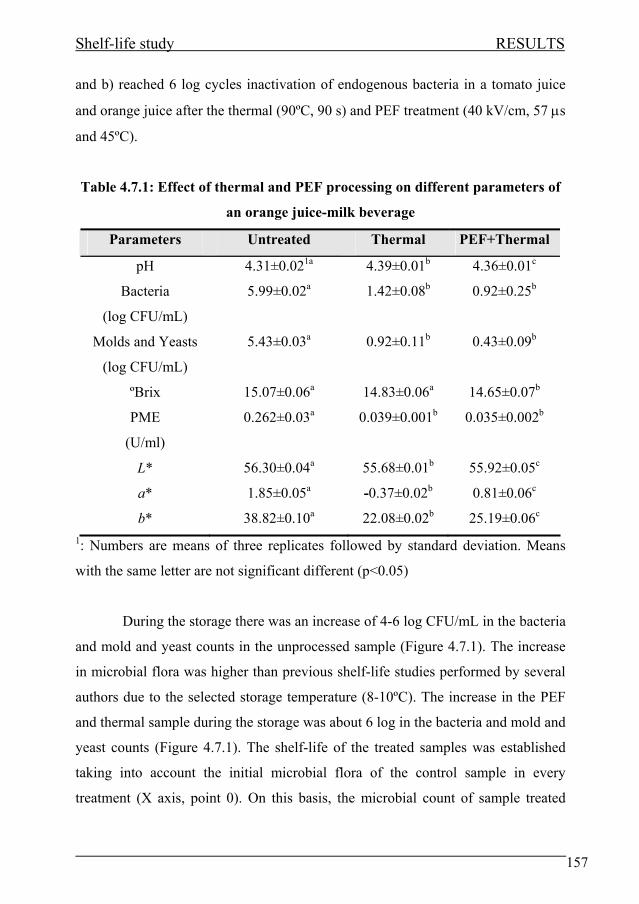
Shelf-life study RESULTS
157
and b) reached 6 log cycles inactivation of endogenous bacteria in a tomato juice
and orange juice after the thermal (90ºC, 90 s) and PEF treatment (40 kV/cm, 57 μs
and 45ºC).
Table 4.7.1: Effect of thermal and PEF processing on different parameters of
an orange juice-milk beverage
Parameters Untreated Thermal PEF+Thermal
pH 4.31±0.021a 4.39±0.01b 4.36±0.01c
Bacteria
(log CFU/mL)
5.99±0.02a 1.42±0.08b 0.92±0.25b
Molds and Yeasts
(log CFU/mL)
5.43±0.03a 0.92±0.11b 0.43±0.09b
ºBrix 15.07±0.06a 14.83±0.06a 14.65±0.07b
PME
(U/ml)
0.262±0.03a 0.039±0.001b 0.035±0.002b
L* 56.30±0.04a 55.68±0.01b 55.92±0.05c
a* 1.85±0.05a -0.37±0.02b 0.81±0.06c
b* 38.82±0.10a 22.08±0.02b 25.19±0.06c 1: Numbers are means of three replicates followed by standard deviation. Means
with the same letter are not significant different (p<0.05)
During the storage there was an increase of 4-6 log CFU/mL in the bacteria
and mold and yeast counts in the unprocessed sample (Figure 4.7.1). The increase
in microbial flora was higher than previous shelf-life studies performed by several
authors due to the selected storage temperature (8-10ºC). The increase in the PEF
and thermal sample during the storage was about 6 log in the bacteria and mold and
yeast counts (Figure 4.7.1). The shelf-life of the treated samples was established
taking into account the initial microbial flora of the control sample in every
treatment (X axis, point 0). On this basis, the microbial count of sample treated
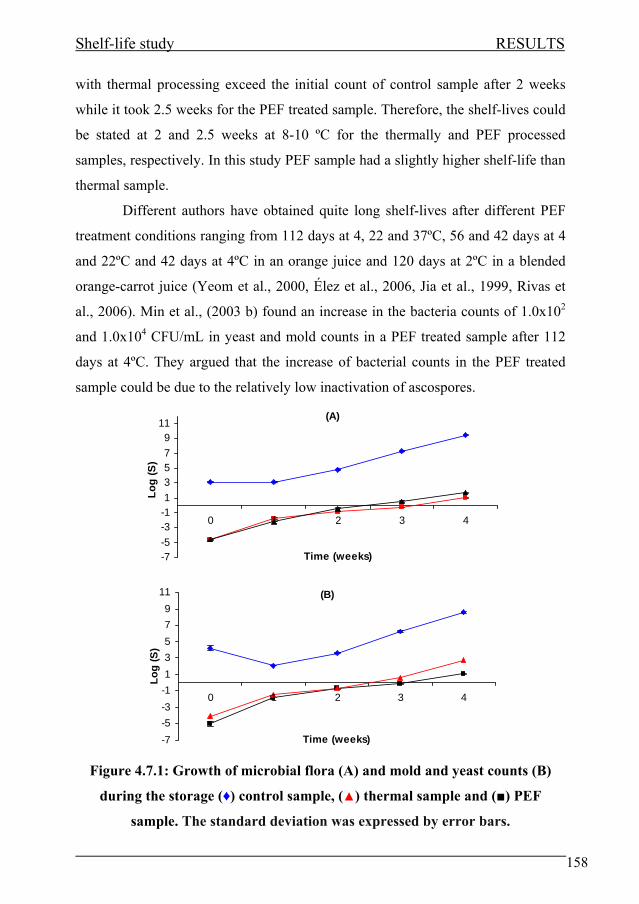
Shelf-life study RESULTS
158
with thermal processing exceed the initial count of control sample after 2 weeks
while it took 2.5 weeks for the PEF treated sample. Therefore, the shelf-lives could
be stated at 2 and 2.5 weeks at 8-10 ºC for the thermally and PEF processed
samples, respectively. In this study PEF sample had a slightly higher shelf-life than
thermal sample.
Different authors have obtained quite long shelf-lives after different PEF
treatment conditions ranging from 112 days at 4, 22 and 37ºC, 56 and 42 days at 4
and 22ºC and 42 days at 4ºC in an orange juice and 120 days at 2ºC in a blended
orange-carrot juice (Yeom et al., 2000, Élez et al., 2006, Jia et al., 1999, Rivas et
al., 2006). Min et al., (2003 b) found an increase in the bacteria counts of 1.0x10²
and 1.0x10⁴ CFU/mL in yeast and mold counts in a PEF treated sample after 112
days at 4ºC. They argued that the increase of bacterial counts in the PEF treated
sample could be due to the relatively low inactivation of ascospores.
(A)
-7-5-3-113579
11
0 1 2 3 4
Time (weeks)
Log
(S)
(B)
-7-5-3-113579
11
0 1 2 3 4
Time (weeks)
Log
(S)
Figure 4.7.1: Growth of microbial flora (A) and mold and yeast counts (B)
during the storage (♦) control sample, (▲) thermal sample and (■) PEF
sample. The standard deviation was expressed by error bars.

Shelf-life study RESULTS
159
4.7.4.3 Effects of processing and storage on PME activity
The effect of thermal and combined PEF and thermal processing on PME
activity in the OJMB is shown in Table 4.7.1. PME activity was inactivated by 89.4
and 90.1 % after the thermal and PEF treatments, respectively, with no significant
differences between the two technologies (Table 8.2.28). Different authors have
also obtained a high degree of PME inactivation after PEF treatment. Élez et al.,
(2006) achieved no PME activity and 81.6% inactivation after thermal (90 ºC, 1
min) and PEF (35 kV/cm, 1000 μs) processing respectively. Rivas et al., (2006)
found 75.6 and 81% after PEF treatment (25 kV/cm, 280 and 330 μs) and 98%
inactivation after thermal treatment (98ºC, 21 s). Yeom et al., (2000) found an
inactivation of 88% after 35 kV/cm, 59 μs and 98% after 94.6 ºC for 30 s and there
was no activation after 112 days at 4 and 22ºC. The differences in the degree of
PME inactivation achieved could be due to the orange variety, harvest season,
treatment intensity or type of food used in the study. Despite of the differences, all
of these studies apply different treatment intensity for thermal and PEF processing
obtaining different PME inactivation degrees being the results among the two
technologies not comparable.
During the storage there was a significant decrease in the PME activity in
all samples (Table 8.2.29) (Figure 4.7.2). Élez et al., (2006) also found a decrease
in the initial PME activity of the untreated sample to around 40% of the initial
activity. A phase separation was observed after two weeks in the unprocessed
sample indicating the destabilization effects of the PME activity. In the treated
samples there were no activation of the enzyme during the storage (p<0.05) and
there was no phase separation. In the thermal sample a slight precipitation was
observed at the bottom, maybe due to the casein precipitation. Several authors have
also observed no PME activation during storage after PEF treatment (Élez et al.,
2006, Rivas et al., 2006). This fact demonstrates that PEF treatment can achieve a
PME irreversible inactivation and a 90% PME reduction is enough to guarantee the
stability of the product stored under refrigeration conditions.

Shelf-life study RESULTS
160
0.000.050.100.150.200.250.300.35
0 1 2 3 4
Time (weeks)
PME
activ
ity (U
/ml)
Figure 4.7.2: Change of PME activity during the storage, (♦) control sample,
(▲) thermal sample and (■) PEF sample. The standard deviation was
expressed by error bars.
4.7.4.4 Effects of processing and storage on color measurement
Table 4.7.1 shows the effect of different treatments on L*, a* and b*
parameters. There was a significant decrease in L*, a* and b* parameters after the
different treatments (Table 8.2.30, Table 8.2.32, Table 8.2.34). The ΔE of samples
was 2.70 after PEF treatment and 2.77 after thermal treatment with a noticeable
color difference compared to controls (Eq. 1). Cserhalmi et al., 2006 found no
differences between the untreated and PEF treated samples in the total color of
orange juice (ΔE=0.47). L* parameter increased slightly during the first three
weeks and decreased in the fourth week in the PEF and thermal treatment samples
however the differences were negligible (Table 8.2.31) (Figure 4.7.3).
There were no significant differences in the a* parameter during the first
three weeks increasing in the fourth week in the untreated and PEF samples and no
differences in the thermal sample (Table 8.2.33) (Figure 4.7.3). b* parameter
decreased significantly during the storage in the unprocessed and PEF sample but
increased after the thermal treatment (Table 8.2.35) (Figure 4.7.3). Rivas et al.,
(2006) found no differences in the luminosity and saturation after the thermal and
PEF treatments in an orange-carrot juice but an increase in the hue angle was
observed after each treatment. During the storage, the authors did not observe
changes in the color parameters in the PEF treated sample but decreasing in the
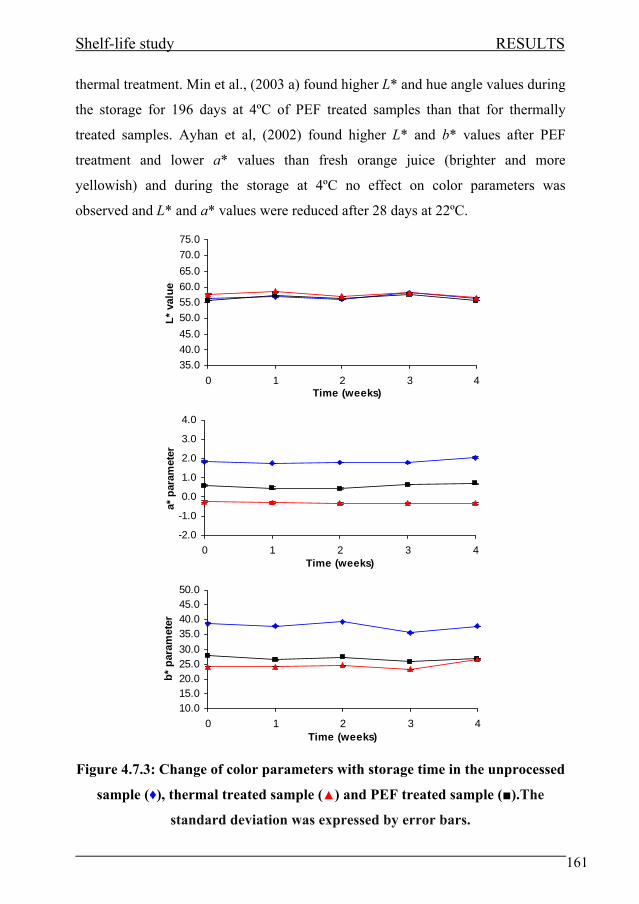
Shelf-life study RESULTS
161
thermal treatment. Min et al., (2003 a) found higher L* and hue angle values during
the storage for 196 days at 4ºC of PEF treated samples than that for thermally
treated samples. Ayhan et al, (2002) found higher L* and b* values after PEF
treatment and lower a* values than fresh orange juice (brighter and more
yellowish) and during the storage at 4ºC no effect on color parameters was
observed and L* and a* values were reduced after 28 days at 22ºC.
35.040.045.050.055.060.065.070.075.0
0 1 2 3 4Time (weeks)
L* v
alue
-2.0
-1.0
0.0
1.0
2.0
3.0
4.0
0 1 2 3 4Time (weeks)
a* p
aram
eter
10.015.020.025.030.035.040.045.050.0
0 1 2 3 4Time (weeks)
b* p
aram
eter
Figure 4.7.3: Change of color parameters with storage time in the unprocessed
sample (♦), thermal treated sample (▲) and PEF treated sample (■).The
standard deviation was expressed by error bars.

Shelf-life study RESULTS
162
4.7.4.5 Effect of processing and storage on volatile compounds content
The effect of thermal and combined PEF and thermal processing on
volatile compounds concentration in the OJMB is presented in Table 4.7.2. There
were no differences in the nonanal, caryophyllene, valencene and dodecanal
content after PEF and thermal treatment (Table 8.2.36). The average loss of
volatile compounds content was -1.68 and 20.95% after the PEF and thermal
treatment respectively. Several authors have also observed less volatile compounds
loss after PEF treatment. Cserhalmi et al., (2006) found no loss of volatile
compounds content in an orange juice after PEF treatment (28 kV/cm, 100 μs)
whereas Jia et al., (1999) and Aguilar, et al., (2007) found less volatile compounds
loss after PEF than thermal treatment in an orange and apple juice respectively.
They contented that the different sensitivity of the volatile compounds to the PEF
and thermal treatments may be due to the molecular weight and boiling point
differences with the lower ones more easily lost during the treatments. However
the PEF treatments studied achieved less microbial inactivation than did the
thermal treatment so the results were not comparable.
The compounds most sensitive to the thermal treatment were β-
phellandrene and α-phellandrene whereas limonene, 4-carene and ethyl octanoate
were the least sensitive to heat. On the other hand, β-phellandrene and
caryophyllene were most sensitive to the PEF treatment. The content of β-myrcene,
limonene, 3-carene, 4-carene and ethyl octanoate was increased by the PEF
treatment. Different theories could explain this phenomenon. Min et al., (2003 c)
found that after PEF treatment some compounds increased in content claiming that
the PEF sample had a lower particle size distribution and consequently an increase
in the release of the volatile compounds. Ayhan et al., (2002) found an increase in
the content of different volatile compounds (limonene, myrcene, valencene and α-
pinene) after PEF treatment (35 kV/cm, 59 μs) in an orange juice. They reasoned
that these compounds are found in higher concentration in the pulp and could be
released after the PEF treatment into the aqueous phase.

Shelf-life study RESULTS
163
During the storage all compounds in the untreated sample decreased in
content except limonene and caryophyllene (Figure 4.7.4-A). The average loss was
34.24%. The compounds that were lost to a higher extent were decanal and β-
phellandrene. The content of volatile compounds in the thermal sample decreased
during the storage except limonene, caryophyllene and α-phellandrene (Figure
4.7.4-B). The average loss was 27.13%. β-phellandrene, nonanal, ethyl octanoate
and decanal were lost most during the storage. Regarding to the PEF sample, the
average loss was 3.72% (Figure 4.7.4-C). Compounds that increased their content
during the storage were α-pinene, β-myrcene, α-phellandrene, 3-carene, 4-carene
and caryophyllene whereas the content of decanal and β-phellandrene decreased.
Different authors observed a slightly better preservation of volatile compounds in
different fruit juices (orange and apple juice) after PEF treatment during the shelf-
life (Min et al., 2003 a; Min et al., 2003 c; Ayhan et al., 2002; Yeom et al., 2000).
The storage temperature seemed to influence to a great extent the acceleration of
the loss of volatile compounds content.
During the shelf-life of the OJMB at 8ºC, the unprocessed sample spoiled
after 1 week, whereas the PEF and thermally treated samples remained stable
during the entire storage period (4 weeks). A decrease in the color parameters was
observed after the different treatments. A slight decrease in pH, Brix and PME
values were observed in the unprocessed sample and a slight increase in the PME
and no variation in the pH and Brix values were observed in the PEF and thermally
treated samples. Both technologies achieved the same enzyme and microbial
inactivation. During storage, populations of bacteria, molds and yeasts increased by
4-6 log cycles in the unprocessed sample. In the thermal and PEF treated samples
the population increased by 6 log cycles. A decrease in the concentration of volatile
compounds was also observed in all samples, although the decrease of the PEF
treated sample was smaller. The results showed that with the same microbial and
enzyme inactivation PEF processed sample has longer shelf-life with higher
standard of quality than thermal processed sample.

Shelf-life study RESULTS
164
Table 4.7.2: Effect of thermal and PEF processing on volatile compounds
content of an orange juice-milk beverage.
Loss (%) Compound
PEF Thermal
α-pinene 9.111±2.612a 36.30±0.28b
β-pinene 4.66±1.98a 44.14±1.15b
β-phellandrene 46.18±0.25a 79.32±9.02b
β-myrcene -25.76±8.14a 31.74±7.74b
Limonene -5.68±6.42a 8.26±4.60b
α-phellandrene 3.86±5.50a 62.88±0.86b
3-Carene -23.01±13.67a 40.91±4.94b
4-Carene -108.94±2.20a 7.80±13.12b
Nonanal 18.54±7.67a 31.11±5.80a
Ethyl Octanoate -26.39±18.36a -161.97±22.85b
Decanal 11.80±9.12a 28.99±2.01b
Caryophyllene 35.93±1.54a 39.52±1.79a
Dodecanal 14.42±1.85a 16.64±7.96a
Valencene 21.77±1.23a 27.74±3.93b
Average loss (%) -1.68 20.95 1: Numbers are means of three replicates followed by standard deviation. Means with the
same letter are not significant different (p<0.05).

Shelf-life study RESULTS
165
(A)
-150
-100
-50
0
50
100
150
Alph
a-pi
nene
Beta
-pin
ene
Beta
-ph
ella
ndre
ne
Beta
-myr
cene
Lim
onen
e
Alph
a-ph
ella
ndre
ne
3-C
aren
e
4-C
aren
e
Non
anal
Ethy
lO
ctan
oate
Dec
anal
Car
yoph
ylle
ne
Dod
ecan
al
Vale
ncen
e
Compound
% L
oss
1 week2 week3 week4 week
(B)
-150
-100
-50
0
50
100
150
Alp
ha-p
inen
e
Beta
-pin
ene
Beta
-ph
ella
ndre
ne
Beta
-myr
cene
Lim
onen
e
Alph
a-ph
ella
ndre
ne
3-C
aren
e
4-C
aren
e
Non
anal
Ethy
lO
ctan
ate
Dec
anal
Car
yoph
ylle
ne
Dod
ecan
al
Vale
ncen
e
Compound
% L
oss
1 week2 week3 week4 week
(C)
-200
-150
-100
-50
0
50
100
150
Alp
ha-p
inen
e
Bet
a-pi
nene
Bet
a-ph
ella
ndre
ne
Bet
a-m
yrce
ne
Lim
onen
e
Alp
ha-
phel
land
rene
3-C
aren
e
4-C
aren
e
Non
anal
Eth
ylO
ctan
oate
Dec
anal
Car
yoph
ylle
ne
Dod
ecan
al
Val
ence
ne
Compound
% L
oss
1 week2 week3 week4 week
Figure 4.7.4: Change of volatile compounds content during the storage (A)
control sample, (B) thermal sample and (C) PEF sample. The standard
deviation was expressed by error bars.


5.-GENERAL DISCUSSION


GENERAL DISCUSSION
168
In recent years, a large quantity of new pasteurized liquid foods requiring
chilled storage and distribution has appeared on the European market. Among
these, fruit-juice mixes, vegetable soups and different sauces are predominant; they
are produced from food ingredients of very different natures, leading to complex
compositions. Within these products fruit juices and milk based beverages offer an
innovating flavor providing essential nutritional components such as water-soluble
vitamins and natural antioxidants from juice and calcium and vitamin-D from milk,
among others.
In order to apply a preservation technology (HHP, PEF or thermal) to a
new product it is necessary to find the adequate formulation based on the consumer
acceptability that allows developing inactivation kinetic studies. The new
formulation must suppose a substantial nutritional and sensorial improvement
respect to the products of such nature commercialized nowadays. Different product
formulations based on the orange juice content were studied. A more suitable
physicochemical characteristics, better consumer sensory evaluation and higher
microbial inactivation degree was obtained in the 50% orange juice sample. This
new formulation represents an increase in the vitamin-C and antioxidants supply.
One of the most important aspects in fruit juice preservation is enzyme
activity. Enzymes are responsible for juice quality losses and the structure and
treatment resistance differs among them. In the orange juice, pectin methyl esterase
(PME) is mainly responsible for its destabilization. Its resistance to thermal and
HHP treatment is higher than the majority of the microorganisms found in the
juice. This fact justifies the characterization of the PME kinetic behavior against
the different new preservation technologies (PEF and HHP). PME inactivation
study in the orange juice-milk based product corroborated the enzyme treatment
resistance. Intense treatment conditions were necessary to inactivate it (90ºC, 1 min
and 700 MPa at 55ºC for 2 min). The presence of two fractions (92% labile and 6-
8% stable) with different stability to the treatment was confirmed. A biphasic
model was able to describe enzyme inactivation curves. Kinetic constants,

GENERAL DISCUSSION
169
activation energy and activation volume values obtained for each fraction allowed
to characterize its behavior against the combined HHP and thermal treatment.
By comparing PME kinetic constants and activation energy values
obtained in the beverage with other PME inactivation kinetic studies in orange
juice, it was observed higher values in the orange juice-milk system so therefore,
higher treatment resistance demonstrating a protective effect. This fact alerted over
the need to study the substrate effect in the thermal and HHP PME inactivation.
There were significant differences in PME inactivation in the different orange
matrices (juice-milk beverage, orange juice and purified PME in buffer at basic
pH). At same pH values lesser thermal and HHP PME inactivation was obtained in
the beverage than in the orange juice matrix. In the purified enzyme differences
were also observed being more pressure resistant and less thermostable than the
rest of matrices. The inactivation mechanism of the different technologies, pH
value or purifying level, are the possible main causes of the differences in the
inactivation degree obtained.
In the PME inactivation study by PEF treatment in the orange juice-milk
system it was observed that at low treatment temperature (25 ºC) some enzyme
activation effect was found as indicated by an increase in PME activity (between
11-60%). Application of a mild PEF treatment could increase the permeability of
the orange pulp by facilitating the release of the bounded PME. After PEF
treatment, PME activity measured as “free” enzyme, increased. By increasing the
temperature, the inactivation reached a maximum of 91% inactivation after 30
kV/cm, 65 ºC (final temperature 80 ºC) and 50 µs demonstrating the synergetic
effect between the temperature and PEF treatment.
Other important food quality aspect is the aroma. The effect of different
preservation technologies (PEF, HHP and thermal) on the volatile compounds
concentration was studied. The different treatments were equivalent in the intensity
applied (30 kV/cm, 50 μs and 65ºC -PEF-, 650 MPa and 50ºC-HHP- and 85ºC, 1
min for thermal treatment) by obtaining a 90% of PME inactivation. In the thermal
treatment between 16 and 43% of volatile compounds content was lost. After PEF

GENERAL DISCUSSION
170
treatment, losses varied between -13 and 30% and an increase in the content of
certain compounds was produced possibly due to their release from the pulp. In the
HHP processing the same phenomenon was presented with an increase in the
content of certain volatile compounds but treatment losses (between -14 and 42%)
were similar to those of thermal treatment. In conclusion, PEF technology was the
one which best preserved the original aroma of the fresh product so this technology
was decided to be used in the microbial inactivation studies.
One of the main problems related to the microbial spoilage effects in fruit
juice based products is the development of acid-tolerant microorganisms. Within
them Lactobacillus genus is one of the most important due to its capability to grow
in these kind of products, being essential to know its behavior against PEF
treatment. For that purpose, the effect of different PEF processing variables
(electric field strength, treatment time, temperature and pulse width) on the
inactivation of Lactobacillus plantarum was studied.
An increase in electric field and treatment time generally produces higher
inactivation degree. However, this behavior is not always demonstrated. Every
microorganism has a critical electric field and increasing it membrane
electroporation is produced leading to the death of the microorganism. The
membrane electroporation depends on the cellular wall characteristics (Gram+ or
Gram-) and cell size and shape (rod-shape and greater size cells are more
susceptible to the treatment). The critical electric field could be transformed in
critical energy applied that corresponds to a minimal energy level enough to
produce electroporation. Within the present study it was observed that an
increasing in the energy applied produced a rapid decreasing in the initial survivors
number corresponding to the most susceptible group of cells. A higher energy
applied did not produce any significant inactivation corresponding to a fraction of
cells resistant to the treatment. It was necessary to overpass a higher energy level to
obtain microorganism inactivation. Finally the most PEF resistant fraction
remained unaffected. This circumstance makes that the survival curve do not
present a linear behavior against energy applied.
GENERAL DISCUSSION
171
An increase in the initial treatment temperature produced higher
inactivation with lower energy consumption. This is produced by an increase in the
membrane permeability making it more susceptible to the PEF treatment. Based on
that, PEF and mild temperature combination could be a good strategy to improve
treatment effectiveness and reduce the energy applied up to 60%. An increase in
pulse width did not produce any significant inactivation effect.
An optimization study based on the energy applied has the main objective
of designing a treatment that obtains a higher inactivation degree with lesser energy
consumption. The influence of different process variables on L. plantarum
inactivation study showed that a treatment based on high electric fields (40
kV/cm), short treatment times (100 μs), pulse width (~2 μs) and mild temperature
(30-50ºC) produced the highest inactivation degree with the lowest energy
consumption. Comparing the energy applied in this study with other studies in
simpler substrates it could be observed that the energy applied was 10 times higher
in the beverage substrate. By comparison with the HTST thermal treatment (High
Temperature Short Time) the optimum PEF treatment could be HEFST (High
Electric Field Intensity Short Time).
Once it was observed that the electric field, treatment time and temperature
were the three most influential variables on PEF inactivation of L. plantarum, it
was decided to study PEF inactivation kinetics based on them. Weibull model was
able to properly describe L. plantarum survival curves against PEF treatment and
tcw parameter was an index of the microorganism treatment resistance. On the
other hand, simpler composition food provided lower tcwvalue indicating a
protective effect in the L. plantarum treatment resistance. An increase in the initial
temperature also favored PEF inactivation by a decrease in tcw value.
In orange juice processing raw material physicochemical characteristics
vary greatly during the year. Among them, pH is probably the most influential
factor in the product microbiological safety and enzyme activity on the product
stability. Stabilization of an orange juice-milk product during the shelf-life requires

GENERAL DISCUSSION
172
the use of an adequate stabilizer (pectin). On the other hand, within the latest years,
several Salmonella outbreaks in fresh orange juice have appeared showing the
acid-tolerance of certain Salmonella strains such as S. typhimurium. This fact
alerted sanitary authorities over the duty to control certain new microorganisms to
improve the microbiological safety of these kind of foods.
Due to the lack of information about the effect of PEF treatment on
microbiological safety of this product, it is important to study the influence of the
physicochemical variables on pathogen inactivation. A pH reduction increased S.
typhimurium PEF inactivation. Weibull model was useful to describe
microorganism behavior through tcw parameter and zpH parameter was also useful
to estimate the tcw sensitivity against pH. A variation in the stabilizer
concentration (pectin) did not produce any significant effect on the inactivation
degree, thus, such characteristic does not present a microbiological safety problem
on these type of products. Through this study it was demonstrate the importance of
physicochemical characteristics in a PEF treatment design.
Once microbiological and quality aspects were established, the shelf-life of
the product at refrigerated conditions (8-10ºC) after PEF and an equivalent thermal
treatment (same PME inactivation) was studied. After the thermal treatment, Brix
degrees, color and volatile compounds concentration significantly diminished
being the overall loss lower in the PEF treatment. During the storage, pH and Brix
degrees diminished in both treatments due to a logical microorganism growing
within the temperature range (8-10ºC). PEF and thermal treatment obtained the
same microbial flora reduction. However, the product shelf-life after PEF treatment
was slightly higher (2.5 weeks) than the thermally treated sample. Enzyme activity
did not increase during the storage showing an irreversible inactivation. Volatile
compounds content diminished during the storage in a higher degree in the
thermally treated sample. This fact showed that PEF processing could achieve the
same degree of microbial and enzyme inactivation as thermal treatment, but

GENERAL DISCUSSION
173
preserving better the original characteristics during the storage of an orange juice-
milk beverage.

6.-CONCLUSIONS

CONCLUSIONS
176
1. The complex composition of the beverage offered a protective effect on
microbial and enzyme inactivation.
2. PME HHP and thermal inactivation appeared to be biphasic with the
appearance of two fractions with different treatment stability.
3. Substrate, purifying level or pH affected PME HHP and thermal resistance
being more thermostable as endogenous form in the beverage and more
pressure resistant as purified form in the buffer.
4. PEF and HHP low intensity treatments produced PME activation (11-60%)
and increase the volatile compounds concentration (14%).
5. PEF processing was the one that best preserved the original volatile
compounds concentration of the beverage.
6. PEF treatment based on high electric field, short treatment time and mild
temperature could achieve a high microbial inactivation degree with lower
energy consumption (60% reduction).
7. Weibull model was able to describe L. plantarum and S. typhimurium
inactivation behavior and the effect of physicochemical characteristics (pH
and pectin concentration) after PEF treatment.
8. tcw parameter could be considered an index of microorganism resistance
to PEF treatment.
9. A decrease in the pH value increased S. typhimurium PEF inactivation
while pectin concentration did not have any significant effect.
10. Shelf-life at 8-10ºC of PEF treated sample was 2.5 weeks with no enzyme
reactivation, similar color and microbial inactivation and greater volatile
compounds content than thermally treated sample.
11. PEF technology could achieve the same degree of microbial and enzyme
inactivation as thermal treatment, but preserving better the original
characteristics during the storage of an orange juice-milk beverage.


7.-REFERENCES

REFERENCES
179
• Abram, F., Smelt, J. P. P. M., Bos, R., and Wouters, P. C. 2003. Modelling and optimization of
inactivation of Lactobacillus plantarum by pulsed electric field treatment. Journal of Applied
Microbiology, 94:571–579.
• Ade-Omowaye, BIO., Angersbach, A., Taiwo, K.A. and Knorr, D. 2001. Use of pulsed electric field
pre-treatment to improve dehydration characteristics of plant based foods. Trends in Food Science and
Technology, 12:285-295.
• Aguilar, S.F., Ballinas, M.L., Nevarez, G.V., Martin, O. and Ortega, E. 2007. Thermal and pulsed
electric fields pasteurization of apple juice: effects on physicochemical properties and flavor
compounds. Journal of Food Engineering, 83:41-46.
• Alpas, H., Kalchayanand, N., Bozoglu, F. and Ray, B. 2000. Interactions of high hydrostatic pressure,
pressurization temperature and pH on death and injury of pressure-resistant and pressure-sensitive
strains of foodborne pathogens. International Journal of Food Microbiology, 60:33-42.
• Álvarez, I., Mañas, P., Condón, S. and Raso, J. 2003 a. Resistance variation of Salmonella enterica
serovars to pulsed electric fields Journal of Food Science, 68:2316-2320.
• Álvarez, I., Pagán, R. Condón, S. and Raso, J. 2003 b. The influence of process parameters for the
inactivation of Listeria monocytogenes by pulsed electric fields. International Journal of Food
Microbiology, 87:87-95.
• Álvarez, I., Pagán, R., Raso, J. and Condón, S. 2002. Environmental factors influencing the
inactivation of Listeria monocytogenes by pulsed electric fields. Letters in applied Microbiology,
35:489-493.
• Álvarez, I., Raso, J., Palop, A. and Sala, F.J. 2000. Influence of different factors on the inactivation of
Salmonella senftenberg by pulsed electric fields. International Journal of Food Microbiology, 55:143-
146.
• Aronsson, K., Lindgren, M., Johansson, B. R.. and Rönner, U. 2001. Inactivation of microorganisms
using pulsed electric fields: the influence of process parameters on Escherichia coli, Listeria innocua,
Leuconostoc mesenteroides and Saccharomyces cerevisiae. Innovative Food Science and Emerging
Technologies, 2:41-54.
• Aronsson, K. and Rönner, U. 2001. Influence of pH, water activity and temperature on the inactivation
of Escherichia coli and Saccharomyces cerevisiae by pulsed electric fields. Innovative Food Science
and Emerging Technologies, 2:105-112.
• Arrhenius, S. 1889. Über die reaktionsgeschwindigkeit bei der inversion von rohrzucker durch säuren,
Zeitschrift für Physikalische Chemie, 4:226-248.
• Artiach, J. 2004. SPAIN: Progress in Juices & Nectars Market 1988-2003.
• Asaka, M. and Hayashi, R. 1991. Activation of polyphenoloxidase in pear fruits by high pressure
treatment. Agricultural and Biological Chemistry, 55:2439-2440.
• Asaka, M., Aoyama, Y., Nakanishi, R. and Hayashi, R. 1994. Purification of a latent form of
polyphenoloxidase from La France pear fruit and its pressure-activation. Bioscience Biotechnology and
Biochemistry, 58:1486-1489.
• Ayhan, Z., Zhang, Q.H. and Min, D.B. 2002. Effects of pulsed electric field processing and storage on
the quality and stability of single-strength orange juice. Journal of Food Protection, 65:1623-1627.

REFERENCES
180
• Balasubramaniam, V.M., Ting, E.Y., Stewart, C.M. and Robbins, J.A. 2004. Recommended laboratory
practices for conducting high-pressure microbial inactivation experiments. Innovative Food Science
and Emerging Technologies, 5:299-306.
• Barbosa-Cánovas, G.V., Gongora-Nieto, M., Pothakamury U. and Swanson B. 1999. Preservation of
foods with pulsed electric fields, pp. 5-10, Academic Press, San Diego, USA.
• Barbosa-Cánovas, G., Palou, E., Pothakamury, U. R. and Swanson, B. G. 1998. Nonthermal
preservation of foods, pp. 9-20, 53-110, Marcel Dekker Inc., New York, USA.
• Baxter, I.A., Easton, K., Schneebeli, K. and Whitfield, F.B. 2005. High pressure processing of
Australian navel orange juice: Sensory analysis and volatile flavor profiling. Innovative Food Science
and Emerging Technologies, 6:372-387.
• Bendicho, S., Barbosa-Cánovas, G.V. and Martín, O. 2003. Reduction of protease activity in milk by
continuous flow high-intensity pulsed electric field treatments. Journal of Dairy Science, 86:697-703.
• Bendicho, S., Marsellés-Fontanet, A.R., Barbosa-Cánovas, G.V. and Martín-Belloso, O. 2005. High
intensity pulsed electric fields and heat treatment applied to a protease from Bacillus subtilis. A
comparison study of multiple systems. Journal of Food Engineering, 69:317-323.
• Bigelow, W.D. 1921. The logarithmic nature of thermal death time curves. Journal of. Infective.
Disease, 29:528–536.
• Black, E.P., Wei1, J., Atluri, S., Cortezzo, D.E., Koziol-Dube, K., Hoover, D.G. and Setlow, P. 2006.
Analysis of factors influencing the rate of germination of spores of Bacillus subtilis by very high
pressure. Journal of Applied Microbiology, 102:65-76.
• Boff, J.M., Truong, T.T., Min, D.B. and Shellhammer, T.H. 2003. Effect of thermal processing and
carbon dioxide-assisted high pressure processing on pectinmethylesterase and chemical changes in
orange juice. Journal of Food Science, 68-4:1179-1184.
• Cameron, R.G., Baker, R.A. and Grohmann, K. 1998. Multiple forms of pectinmethylesterase from
citrus peel and their effects on juice cloud stability, Journal of Food Science, 63:253-256.
• Cameron, R.G. and Grohmann, K. 1996. Purification and characterization of a thermally tolerant pectin
methylesterase from commercial Valencia fresh orange juice, Journal of Agricultural and Food
Chemistry, 44:458-462.
• Cameron, R.G., Niedz, R.P. and Grohmannt, K. 1994. Variable heat stability for multiple forms of
pectinmethylesterase from citrus tissue culture cells. Journal of Agriculture and Food Chemistry,
43:903-908.
• Castillo, A., Villarruel-López, A., Navarro-Hidalgo, V., Martínez-González, N.E. and Torres-Vitela,
M.R. 2006. Salmonella and Shigella in freshly squeezed orange juice, fresh oranges, and wiping cloths
collected from public markets and street booths in Guadalajara, Mexico: incidence and comparison of
analytical routes. Journal of Food Protection, 69:2595-2599.
• Clark, J.P. 2006. Pulsed electric field processing. Food Technology, 1:66-67.
• Cook, K.A., Dobbs, T.E., Hlady, W.G., Wells, J.G., Barrett, T.J., Puhr, N.D., Lancette, G.A., Bodager,
D.W., Toth, B.L., Genese, C.A., Highsmith, A.K., Pilot, K.E., Finelli, L. and Swerdlow, D.L. 1998.
Outbreak of Salmonella serotype Hartford infections associated with unpasteurized orange juice.
Journal of the American Medical Association, 280:1504-1509.
REFERENCES
181
• Cserhalmi, Zs., Vidács, I., Beczner, J. and Czukor, B. 2002. Inactivation of Saccharomyces cerevisiae
and Bacillus cereus by pulsed electric fields technology. Innovative Food Science and Emerging
Technologies, 3:41-45.
• Cserhalmi, Zs., Sass-Kiss, Á., Tóth-Markus, M. and Lechner, N. 2006. Study of pulsed electric field
treated citrus juices. Innovative Food Science and Emerging Technologies, 7:49-54.
• Damar, S., Bozoglu, F., Hizal, M. and Bayindirh, A. 2002. Inactivation and injury of Escherichia coli
O157:H7 and Staphylococcus aureus by pulsed electric fields. World Journal of Microbiology and
Biotechnology, 18:1-6.
• De Angelis, M., Di Cagno, R., Huet, C., Crecchio, C., Fox, P. F.and Gobbetti, M. 2004. Heat shock
response in Lactobacillus plantarum. Applied and Environmental Microbiology, 70:1336–1346.
• De Kruif, C. G. 1998. Supra-aggregates of casein micelles as a prelude to coagulation. Journal of Dairy
Science, 81:3019-3028.
• Do Amaral, S.H., De Assis, S.A. and De Faria Oliveira, O.M.M. 2005. Partial purification and
characterization of pectin methylesterase from orange (citrus sinensis) cv. pera-rio. Journal of Food
Biochemistry, 29:367-380.
• Dutreux, N., Notermans, S., Wijtzes, T., Góngora-Nieto, M, Barbosa-Cánovas, G.V. and Swanson,
B.G. 2000. Pulsed electric fields inactivation of attached and free-living Escherichia coli and Listeria
innocua under several conditions. International Journal of Food Microbiology, 54:91-98.
• Élez-Martínez, P., Escolà-Hernández, J., Soliva-Fortuny, R.C. and Martín-Belloso, O. 2005.
Inactivation of Lactobacillus brevis in orange juice by high-intensity pulsed electric fields. Food
Microbiology, 22:311-319.
• Élez-Martínez, P., Aguiló-Aguado, I. and Martín-Belloso, O. 2006.a Inactivation of orange juice
peroxidase by high-intensity pulsed electric fields as influenced by process parameters. Journal of the
Science of Food and Agriculture, 86:71-81.
• Élez, P., Soliva, R.C. and Martín, O. 2006 b. Comparative study on shelf-life of orange juice processed
by high intensity pulsed electric fields or heat treatment. European Food Research and Technology,
222:321-329.
• Evrendilek, G.A., Zhang, Q. H., Richter, E. R. 1999. Inactivation of Escherichia coli O157:H7 and
Escherichia coli 8739 in apple juice by pulsed electric fields. Journal of Food Protection, 62:793-796.
• Evrendilek, G. A., Dantzer, W. R., Streaker, C. B., Ratanatriwong, P. and Zhang, Q. H. 2001. Shelf-life
evaluations of liquid foods treated by pilot plant pulsed electric field system. Journal of Food
Processing and Preservation, 25:283-297.
• Evrendilek, G. A., Jin, Z. T., Ruhlman, K. T., Qiu, X., Zhang, Q. H.and Richter, E. R. 2000. Microbial
safety and shelf-life of apple juice and cider processed by bench and pilot scale PEF systems.
Innovative Food Science and Emerging Technologies, 1:77-86.
• Evrendilek, G. A. Li, S., Dantzer, W.R. and Zhang, Q.H. 2004. Pulsed electric field processing of beer:
Microbial, sensory and quality analyses. Journal of Food Science, 69:228-232.
• Evrendilek, G. and Zhang, Q.H. 2003. Effects of pH, temperature and pre-pulsed electric field
treatment on pulsed electric field and heat inactivation of Escherichia coli O157:H7. Journal of Food
Protection, 5:755-759.

REFERENCES
182
• Eyring, H., Johnson, F.H. and Gensler, R.L. 1946. Pressure and reactivity of proteins, with particular
interest to invertase. Journal of Physical Chemistry, 50:453-464.
• Fan, X. and Gates, R.A. 2001. Degradation of monoterpenes in orange juice by gamma irradiation.
Journal of Agricultural and Food Chemistry, 49:2422-2426.
• Forsythe, S.J. 2003. Alimentos seguros: microbiología, pp. 33-40, Ed. Acribia S.A., Zaragoza (España).
• Gerardi, S., Barzarini, R., Bigliardi, D., Trifiro, A. and Montarani, A. 1983. Envasado y Calidad.
Alimentaria, 139:231-236.
• Giner, J., Gimeno, V., Barbosa-Cánovas, G.V. and Martín, O. 2001. Effects of pulsed electric field
processing on apple and pear polyphenoloxidases. Journal of Food Science and Technology
International, 7:339-345.
• Goodner, J.K., Braddock, R.J. and Parish, M.E. 1998. Inactivation of pectinarase in orange and
grapefruit juices by high pressure. Journal of Agricultural and Food Chemistry, 46:1997-2000.
• Grahl, T. and Märkl, H. 1996. Killing of microorganisms by pulsed electric fields. Applied
Microbiology and Biotechnology, 45:148-157.
• Guderjan, M., Élez-Martínez, P. Knorr, D. 2007. Application of pulsed electric fields at oil yield and
content of functional food ingredients at the production of rapeseed oil. Innovative Food Science and
Emerging Technologies, 8:55-62.
• Han, Y., Nielsen, S.S. and Nelson, P.E. 2000. Thermostable and theriviolabile isoforms in commercial
orange peel pectinarase. Journal of Food Biochemistry, 24:41-54.
• Harrison S. L., Barbosa-Cánovas., G.V. and Swanson B. 1997. Saccharomyces cerevisiae structural
changes induced by pulsed electric fields treatment. Lebensmittel Wissenchaft under Technology,
30:236-240.
• Heinz, V., Álvarez, I., Angersbach, A. and Knorr, D. 2002. Preservation of liquids foods by high
intensity pulsed electric fields, basic concepts for process design. Trends in Food Science and
Technology, 12:103-111.
• Heinz, V., Toepfl, S.and Knorr, D. 2003. Impact of temperature on lethality and energy efficiency of
apple juice pasteurization by pulsed electric fields treatment. Innovative Food Science and Emerging
Technologies, 4:167-175.
• Heremans, K. 2002. The effects of high pressure on biomaterials, in “Ultra High Pressure Treatments
of Foods”, pp. 23-25. Ed. Hendrickx, M. & Knorr, D., Kluwer Academic, New York, USA.
• Hilliam, M. 2003a. Healthy yoghurt drinks. The World of Food Ingredients, 10:12-14.
• Hilliam, M. 2003b. Fortified juice trends. The World of Food Ingredients, 12:17-19.
• Ho, S., Cross, J. and Griffiths, M. 1995. Inactivation of Pseudomonas fluorescens by high voltage
electric pulses. Journal of Food Science, 60:1337-1343.
• Ho, S.Y., Mittal, G.S. and Cross, J.D. 1997. Effects of high field electric pulses on the activity of
selected enzymes. Journal of Food Engineering, 31:69-84.
• Hou, W.N., Jeong, Y., Walker, B.L., Wei, C.I. and Marshall, M.R. 1997. Isolation and characterization
of pectinarase from Valencia orange. Journal of Food Biochemistry, 21:309-333.
• Hülsheger, H., Potel, J. and Niemann, E.G. 1981. Killing of bacteria with electric pulses of high field
strength. Radiation and Environmental Biophysics, 20:53-65.

REFERENCES
183
• Hülsheger, H. and Nieman, E. 1980. Lethal effect of high voltage pulses on E. coli K12. Radiation and
Environmental Biophysics, 18:281-288.
• Irwe, S. and Olson, I. 1994. Reduction of pectinarase activity in orange juice by high-pressure
treatment in Minimal Processing of Foods and Process Optimization, pp.74-76 Ed. Sing, R.P. and
Oliveira, F.A.R. CRC Press, Florida, USA.
• ISO. 1988 a. Sensory analysis. General guidance for design of test rooms. Standard nº 8589. Geneva,
Switzerland.
• ISO. 1988 b. Sensory analysis. Methodology. Ranking. Standard nº 8587. Geneva, Switzerland.
• Jayaram, S. Castle, G. S. and Margaritis, A. 1992. Kinetics of sterilization of Lactobacillus brevis by
the application of high voltage pulses. Biotechnology and Bioengineering, 40:1412-1420.
• Jia, M., Zhang, Q.H. and Min, D.B. 1999. Pulsed electric field processing effects on flavor compounds
and microorganisms of orange juice. Food Chemistry, 65:445-451.
• Jin, T., Zhang, H., Boyd, G. and Tang, J. 2007. Thermal resistance of Salmonella enteritidis and
Escherichia coli K12 in liquid egg determined by thermal-death-time disks. Journal of Food
Engineering, 84:608-614.
• Khan, K. A., Melvin, C. D. and Dagdag, E.B. 2007. Identification and molecular characterization of
Salmonella spp. from unpasteurized orange juices and identification of new serotype Salmonella strain
S. enterica serovar Tempe. Food Microbiology, 24:539-543.
• Klavons, J. A. and Bennet, R. D. 1987. Nature of the pectin constituent of commercial lemon juice
cloud. Journal of Agriculture and Food Chemistry, 35:159-161.
• Körner, B., Zimmerman, G. and Berk, Z. 1980. Orange pectinarase: purification, properties and effect
on cloud stability. Journal of Food Science, 45:1203-1206.
• Kumura, H., Mikawa, K. and Saito, Z. 1993. Influence of milks proteins on the thermostability of the
lipase from Pseudomonas fluorescens. Journal of Dairy Science, 76:2164-2167.
• Lafuente, B. 1985. Factores que afectan la calidad y la estabilidad del zumo de naranja semielaborado.
Revista de Agroquímica y Tecnología de Alimentos, 25:334-352.
• Lee, J.Y., Lin, Y.S., Chang, H.M., Chen, W. and Wu, M.C. 2003. Temperature-time relationships for
thermal inactivation of pectinarases in orange juice. Journal of the Science of Food and Agriculture,
83:681-684.
• Lebovka, N.I. and Vorobiev, E. 2004. On the origin of the deviation from the first-order kinetics in
activation of microbial cells by pulsed electric fields. International Journal of Food Microbiology,
91:83-89.
• Li, S. Q. and Zhang, Q. H. 2004. Inactivation of E. coli 8739 in enriched soymilk using pulsed electric
fields. Journal of Food Science, 69:169-174.
• Liang, Z., Mittal, G.S. and Griffiths, M.W. 2002. Inactivation of Salmonella typhimurium in orange
juice containing antimicrobial agents by pulsed electric field. Journal of Food Protection, 65:1081-
1087.
• Ludikhuyze, L., Van Loey, A., Indrawati. and Hendrickx, M. 2002. High pressure processing of fruit
and vegetables, in “Ultra High Pressure Treatments of Foods”, pp. 168-171. Ed. Hendrickx, M. &
Knorr, D., Kluwer Academic, New York, USA.

REFERENCES
184
• Ly Nguyen, B., Van Loey, A., Fachin, D., Verlent, I., Indrawati and Hendrickx, M. 2002. Partial
purification, characterization, thermal and high pressure inactivation of pectinmethylesterase from
carrots (Daucus Carota L.). Journal of Agricultural and Food Chemistry, 50:5437-5444.
• Mañas, P., Barsotti, L. and Cheftel, J. C. 2001. Microbial inactivation by pulsed electric fields in a
batch treatment chamber: effects of some electrical parameters and food constituents. Innovative Food
Science and Emerging Technologies, 2:239-249.
• Mañas, P. and Pagán, R. 2005. Microbial inactivation by new technologies of food preservation.
Journal of Applied Microbiology, 98:1387-1399.
• Marshall, M.R., Marcy, J.E. and Braddock, R.J. 1985. Effect of total solids level on heat inactivation of
pectinesterase in orange juice. Journal of Food Science, 50:220-222.
• Martín, O., Swanson, B. G., Chang, F. J., Qin, B. L. and Barbosa-Cánovas, G. V. 1997. Inactivation of
Escherichia coli in skim milk by high intensity pulsed electric fields. Journal of Food Process
Engineering, 20:317-336.
• Martín-Belloso, O., Vega-Mercado, H., Qin, B. L., Chang, F. J., Barbosa- Cánovas, G. V. and
Swanson, B. G. 1997. Inactivation of Escherichia coli suspended in liquid egg using pulsed electric
fields. Journal of Food Processing and Preservation, 21:193-208.
• Martín J. J., Solanes E., Bota, E. and Sancho, J. 1995. Evolución química y organoléptica del zumo de
naranja pasterizado. Alimentaria, 95:59-63.
• McDonald, L.C., Fleming, H.P. and Hassan, H.M. 1990. Acid tolerance of Leuconostoc mesenteroides
and Lactobacillus plantarum. Applied and Environmental Microbiology, 56:2120–2124.
• Menrad, K. 2004. Market and marketing of functional food in Europe. Journal of Food Engineering,
56: 181-188.
• Mills, G., Earnshaw, R. and Patterson, M.F. 1998. Effects of high hydrostatic pressure on Clostridium
sporogenes spores. Letters of Applied Microbiology, 26:227-230.
• Min, S., Jin, Z.T., Min, S.K., Yeom, H. and Zhang, Q.H. 2003 a. Commercial-scale pulsed electric field
processing of orange juice. Journal of Food Science, 68:1265-1271.
• Min, S., Jin, T. and Zhang, Q.H. 2003 b. Commercial scale pulsed electric field processing of tomato
juice. Journal of Agricultural and Food Chemistry, 51:3338-3344.
• Min, S., Min, S. K. and Zhang, Q. H. 2003 c. Inactivation kinetics of tomato juice lipoxygenase by
pulsed electric fields. Food Engineering and Physical Properties, 68:1995-2001.
• Min, S., Reina, L. and Zhang, Q. H. 2002. Water activity and the inactivation of Enterobacter cloacae
inoculated in chocolate liquor and a model system by pulsed electric field treatment. Journal of Food
Processing and Preservation, 26:323-337.
• Min, S and Zhang, Q.H. 2003. Effects of commercial-scale pulsed electric field processing on flavor
and color of tomato juice. Journal of Food Science, 68:1600-1606.
• Ministerio de Agricultura, Pesca y Alimentación (MAPA) of Spain. 2003. Spain total citric
transformation, 2002–2003 campaign.
• Morris, C.E. 1998. Pending regulations stir R&D juices. Food Engineering, 1:49-51.
• Mossel, D.A.A., Moreno, B. and Struijk, C.B. 2002. Microbiología de los alimentos, pp.15-20. Ed.
Acribia S.A., Zaragoza (España).

REFERENCES
185
• Nakamura, A., Yoshida, R., Maeda, H. and Corredig, M. 2006. The stabilizing behaviour of soybean
soluble polysaccharide and pectin in acidified milk beverages. International Dairy Journal, 16:361-369.
• Nienaber, U. and Shellhammer, T.H. 2001. High-pressure processing of orange juice: kinetics of
pectinmethylesterase inactivation. Journal of Food Science, 66:328-331.
• Norton, T and Sun D.W. 2007. Recent advances in the use of high pressure processing technique in the
food industry. Food and Bioprocess Technology, DOI 10.1007/s11947-007-0007-0.
• Pagán, R., Esplugas, S., Góngora-Nieto, M.M., Barbosa-Cánovas, G.V. and Swanson, B.G. 1998.
Inactivation of Bacillus subtilis spores using high intensity pulsed electric fields in combination with
other food conservation technologies. Food Sciencie and Technology International, 4:33-44.
• Pao, S., Brown, G.E. and Schneider, K.R. 1998. Challenge studies with selected pathogenic bacteria on
freshly peeled Hamlin orange. Journal of Food Science, 63:359-362.
• Pao, S. Davis, C.L. 2001. Transfer of natural and artificially inoculated microorganisms from orange
fruit to fresh juice during extraction. Lebensmittel Wissenchaft under Technology, 34:113–117.
• Parish, M. and Higgins, D. 1988. Isolation and identification of lactic acid bacteria from samples of
citrus molasses and unpasteurized orange juice. Journal of Food Science, 53:645-646.
• Parish, M.E., Narciso, J.A. and Friedrich, L.M. 1997. Survival of Salmonellae in orange juice. Journal
of Food Safety, 17:273-281.
• Parish, M. E., Sadler, G. D. and Wicker, L. 1990. Viability of Lactobacillus plantarum in orange juice
under low pH and temperature conditions. Journal of Food Science, 55:1023-1025.
• Parish, M.E. 1997. Public health and nonpasteurized fruit juices. Critical Reviews in Microbiology
23:109-119.
• Peleg M. 1995. A model of microbial survival after exposure to pulsed electric fields. Journal of the
Science of Food and Agriculture, 67:93-99.
• Pérez, O. E. and Pilosof, A. M. R. 2004. Pulsed electric effects on the molecular structure and gelation
of β-lactoglobulin concentrate and egg white. Food Research International, 37:102-110.
• Pereyra, R., Schmidt, K. A. and Wicker, L. 1997. Interaction and stabilization of acidified casein
dispersions with low and high methoxyl pectins. Journal of Agricultural and Food Chemistry, 45:3448-
3451.
• Picart, L., Dumay, E. and Cheftel, J. C. 2002. Inactivation of Listeria innocua in dairy fluids by pulsed
electric fields: influence of electric parameters and food composition. Innovative Food science and
Emerging Technologies, 3:357-369.
• Pilnik, W. and Voragen, A.G.J. 1991. The significance of endogenous and exogenous pectic enzymes
in fruit and vegetable processing In “Food Enzymology” editor, Fox, P.F., pp. 306, Elsevier Science
Publishers, Ltd, England.
• Pothakamury, U.R., Monsalve-González, A., Barbosa-Cánovas, G.V., Swanson, B.G.1995. Inactivation
of Escherichia coli and Staphylococcus aureus in model foods by pulsed electric field technology.
Food Research International, 28:167–171.
• Pothakamury, U. R., Vega-Mercado, H., Zhang, Q., Barbosa-Cánovas, G.V. and Swanson, B.G. 1996.
Effect of growth stage and temperature on inactivation of E. coli by pulse electric fields. Journal of
Food Protection, 59:1167-1171.

REFERENCES
186
• Primo, E. 1979. Química Agrícola de Alimentos III, pp. 230-276. Alambra, Madrid, España
• Pszczola, D. E. 2005. Ingredients. Making fortification functional. Food Technology, 59:44-61.
• Qin, B., Barbosa-Canovas, G. V., Swanson, B. and Pedrow, P. 1998. Inactivating microorganism using
a pulsed electric field continuous treatment system. IEEE Trans Industry Application, 34:43-49.
• Ramaswamy, H.S. and Chen, C.R. 2002. Maximising the quality of thermally processed fruits and
vegetables in “Fruit and vegetable: Processing-Improving quality”, pp. 188-214. Ed. Jongen, W.,
Woodhead Publishing, London, UK.
• Raso, J., Góngora-Nieto, M.M., Barbosa-Cánovas, G.V. and Swanson, B.G. 1998. Influence of several
environmental factors on the initiation of germination and inactivation of Bacillus cereus by high
hydrostatic pressure. International Journal of Food Microbiology, 44:125-132.
• Raso, J., Calderón, M.L., Góngora, M., Barbosa-Cánovas, G.V. and Swanson, B.G. 1998 Inactivation
of mold ascospores and conidiospores suspended in fruit juices by pulsed electric fields. Lebensmittel
Wissenchaft under Technology, 31:668–672.
• Raso, J., Álvarez, I., Condón, S. and Sala-Trepat, F.J. 2000. Predicting inactivation of Salmonella
senftenberg by pulsed electric fields. Innovative Food Science and Emerging Technologies, 1:21-29.
• Raso, J., Barbosa-Cánovas, G.V. 2003. Nonthermal preservation of foods using combined processing
techniques. Critical Reviews in Food Science and Nutrition, 43:265-285.
• Rastogi, N.K., Raghavarao, K.S.M.S., Balasubramaniam, V.M., Niranjan, K.and Knorr, D. 2007.
Opportunities and challenges in high pressure processing of foods. Critical Reviews in Food Science
and Nutrition, 47:69-112.
• Ray, B. 2004. Fundamental food microbiology, pp. 123-136. Ed. CRC Press, Florida (EEUU).
• Reina, L. D., Jin, Z. T., Zhang, Q. H. and Yousef, A. E. 1998. Inactivation of Listeria monocytogenes
in milk by pulsed electric field. Journal of Food Protection, 61:1203-1206.
• Rivas, A., Rodrigo, D., Martínez, A., Barbosa-Cánovas, G.V. and Rodrigo, M. 2006 a. Effect of PEF
and heat pasteurization on the physical-chemical characteristics of blended orange and carrot juice.
LWT, 39:1163-1170.
• Rivas, A., Sampedro, F., Rodrigo, D., Martínez, A. and Rodrigo, M. 2006 b. Nature of the inactivation
of Escherichia coli suspended in an orange juice and milk beverage. European Food Research and
Technology, 223:541–545.
• Roberts, C.M. and Hoover, D.G. 1996. Sensitivity of Bacillus coagulans spores to combinations of
high hydrostatic pressure, heat, acidity and nisin. Journal of Applied Bacteriology, 81:363-368.
• Rodrigo, D., Martínez, A., Harte, F., Barbosa-Cánovas, G. V. and Rodrigo, M. 2001. Study of
inactivation of Lactobacillus plantarum in orange-carrot juice by means of pulsed electric fields:
Comparison of inactivation models. Journal of Food Protection, 64:259-263.
• Rodrigo, D., Barbosa-Cánovas, G. V., Martínez, A. and Rodrigo, M. 2003 a. Weibull distribution
function based on an empirical mathematical model for inactivation of Escherichia coli by pulsed
electric fields. Journal of Food Protection, 66:1007-1012.
• Rodrigo, D., Ruíz, P., Barbosa-Cánovas, G.V., Martinez, A. and Rodrigo, M. 2003 b. Kinetic model for
the inactivation of Lactobacillus plantarum by pulsed electric fields. International Journal of Food
Microbiology, 81:223-229.

REFERENCES
187
• Rodrigo D., Sampedro, F., Martínez, A., Rodrigo, M. and Barbosa-Cánovas, G.V. 2005. Application of
PEF in orange juice products in novel food processing technologies, pp 131-144. CRC press, Boca
Raton, Florida,
• Roodenburg, B., Morren, J., Berg, H.E. and de Haan, S.W.H. 2005 a. Metal release in a stainless steel
Pulsed Electric Field (PEF) system Part I. Effect of different pulse shapes; theory and experimental
method. Innovative Food Science and Emerging Technologies, 6:326-337.
• Roodenburg, B., Morren, J., Berg, H.E. and de Haan, S.W.H. 2005 b. Metal release in a stainless steel
pulsed electric field (PEF) system Part II. The treatment of orange juice; related to legislation and
treatment chamber lifetime. Innovative Food Science and Emerging Technologies, 6:337-345.
• Ross, T. 1996. Indices for performance evaluation of predictive models in food microbiology. Journal
of Applied Bacteriology, 81:501–508.
• Rovere, P. 2002. Industrial-scale high pressure processing of foods, in “Ultra High Pressure Treatments
of Foods”, pp. 251-255. Ed. Hendrickx, M. & Knorr, D., Kluwer Academic, New York, USA.
• Sampedro, F., Rivas A., Rodrigo, D., Martínez, A. and Rodrigo, M. 2006. Effect of temperature and
substrate on PEF inactivation of Lactobacillus plantarum in an orange juice–milk beverage. European
Food Research and Technology, 223:30-34.
• Sampedro F, Rodrigo M, Martínez A, Rodrigo D, Barbosa-Cánovas G.V. 2005. Quality and safety
aspects of PEF application in milk and milk products. Critical Reviews in Food Science and Nutrition,
45:25-47.
• Sampedro, F., Rivas, A., Rodrigo, D., Martínez, A. and Rodrigo, M. 2007 a. Pulsed electric fields
inactivation of Lactobacillus plantarum in an orange juice–milk based beverage: Effect of process
parameters. Journal of Food Engineering, 80:931-938.
• Sampedro, F., Rodrigo, D. and Hendrickx, M. 2007 b. Inactivation kinetics of pectin methyl esterase
under combined thermal–high pressure treatment in an orange juice–milk beverage. Journal of Food
Engineering, doi:10.1016/j.jfoodeng.2007.09.019.
• Sampedro, F., Geveke, D.J., Fan, X. and Zhang, Q.H. Effect of PEF, HHP and thermal treatment on
PME inactivation and volatile compounds concentration of an orange juice-milk based beverage.
Journal of Agricultural and Food Chemistry, review process.
• Schilling, S., Alber, T., Toepfl, S., Neidhart, S., Knorr, D., Schieber, A. Carle, R. 2007. Effects of
pulsed electric field treatment of apple mash on juice yield and quality attributes of apple juices.
Innovative Food Science and Emerging Technologies, 8:127-134.
• Selma, M. V., Salmerón, M. C., Valero, M. and Fernández, P. S. 2004. Control of Lactobacillus
plantarum and Escherichia coli by pulsed electric fields in MRS Broth, Nutrient Broth and orange-
carrot juice. Food Microbiology, 21:519-524.
• Selma, M. V., Fernández, P. S., Valero, M. and Salmerón, M. C. 2003. Control of Enterobacter
aerogenes by high-intensity, pulsed electric fields in horchata, a Spanish low acid vegetable beverage.
Food Microbiology, 20:105-110.
• Sensoy, I., Zhang, Q.H. and Sastry, S.K. 1997. Inactivation kinetics of Salmonella dublin by pulsed
electric field. Journal of Food Process Engineering, 20:367–381.

REFERENCES
188
• Sepulveda, D.R., Góngora-Nieto, M.M., San-Martin, M.F. and Barbosa-Cánovas, G.V. 2005. Influence
of treatment temperature on the inactivation of Listeria innocua by pulsed electric fields. Lebensmittel
Wisenchaft under Technologie, 38:167-172.
• Seyderhelm, I., Boguslawski, S., Michaelis, G. and Knorr, D. 2004. Pressure induced inactivation of
selected food enzymes. Journal of Food Science, 61:308-310.
• Sharma, S.K., Zhang, Q.H. and Chism, G.W. 1998. Development of a protein fortified fruit beverage
and its quality when processed with pulsed electric field treatment. Journal of Food Quality, 21:459–
473.
• Sivapalasingam, S., Friedman, C.R., Cohen, L. and Tauxe, R.V. 2004. Review fresh produce: A
growing cause of outbreaks of foodborne illness in the United States, 1973 through 1997. Journal of
Food Protection, 67:2342-2353.
• Smelt, J.P., Hellemons, J.C. and Patterson, M. 2002. Effects og high pressure on vegetatice
microorganisms, in “Ultra High Pressure Treatments of Foods”, pp. 64. Ed. Hendrickx, M. & Knorr,
D., Kluwer Academic, New York, USA.
• Snir, R., Koehler, P.E., Sims, K.A. and Wicker, L. 1996. Total and thermostable pectinesterases in
citrus juices. Journal of Food Science, 61: 379-382.
• Sojka, B. and Ludwig, H. 1994. Pressure-induced germination and inactivation of Bacillus subtilis
spores. Pharmacology Industry, 56:660-663.
• Sojka, B. and Ludwig, H. 1997. Release of dipicolinic acid and amino acids during high pressure
treatment of Bacillus subtilis spores. Pharmacology Industry, 59:355-359.
• Soliva, R., Bendicho, S. and Martin, O. 2006. Modelling high-intensity pulsed electric field
inactivation of a lipase from Pseudomonas fluorescens. Journal of Dairy Science 89 (11):4096-4104.
• Southon, S. and Faulks, R. 2002. Health benefits of increased fruit and vegetable consumption in “Fruit
and vegetable: Processing-Improving quality”, pp. 5-22. Ed. Jongen, W., Woodhead Publishing.
• Steffen, A., Pawliszyn, J. 1996. Analysis of flavor volatiles using headspace solid-phase
microextraction. Journal of Agricultural and Food Chemistry, 44:2187-2193.
• Stern, J. A., and B. E. Proctor. 1954. A micro method and apparatus for the multiple determination of
rates of destruction of bacteria and bacterial spores subjected to heat. Food Technology, 8:139-143.
• Tajchakavit, S. and Ramaswamy, H.S. 1997. Thermal vs. microwave inactivation kinetics of
pectinmethylesterase in orange juice under batch mode heating conditions. Lebensmittel Wissenchaft
under Technologie, 30:85-93.
• Tait, S. A., Gaze, J. E. and Figuereido, A. 1991. Heat resistance of Enterococcus faecalis,
Lactobacillus plantarum and Bacillus licheniformis in pH 4 and pH 7 buffers. In Technical
memorandum, Campden, UK.
• Toepfl, S., Mathys, A., Heinz, V. and Knorr, D. 2006. Review: Potential of high hydrostatic pressure
and pulsed electric fields for energy efficient and environmentally friendly food processing. Food
Reviews International, 22:405-423.
• Tribess, T.B. and Tadini, C.C. 2006. Inactivation kinetics of pectin methyl esterase in orange juice as a
function of pH and temperature/time process conditions. Journal of the Science of Food and
Agriculture, 86:1328-1335.
REFERENCES
189
• Trujillo, A.J., Capellas, M., Saldo, J., Gervilla, R. and Guamis, B. 2002. Applications of high-
hydrostatic pressure milk and dairy products: a review. Innovative Food Science and Emerging
Technologies, 3:295-307.
• Truong, T.T., Boff, J.M., Min, D.B. and Shellhammer, T.H. 2002. Effects of carbon dioxide and high-
pressure processing on pectinmethylesterase in single-strength orange juice. Journal of Food Science,
67:3058-3062.
• Tsou, C.L. 1986. Location of active sites of some enzymes in limited and flexible molecular regions.
Trends in Biochemical Science, 67:3058-3062.
• Ulmer, H. M., Heinz, V., Gänzle, M. G., Knorr, D. and Vogel, R. F. 2002. Effects of pulsed electric
fields on inactivation and metabolic activity of Lactobacillus plantarum in model beer. Journal of
Applied Microbiology, 93:326-335.
• Urrutia-Benet, G. 2005. High-pressure-low-temperature processing of foods: Impact of metastable
phases of process and quality parameters. PhD thesis, Berlin University of Technology.
• Van den Broeck, I., Ludikhuyze, L.R., Weemaes, C.A., Van Loey, A.M. and Hendrickx, M. 1999 a.
Thermal inactivation kinetics of pectinarase extracted from oranges. Journal of Food Processing
Preservation, 23:391-406.
• Van den Broeck, I., Ludikhuyze, L.R., Van Loey, A.M., Weemaes, C.A. and Hendrickx, M. 1999 b.
Thermal and combined pressure-temperature inactivation of orange pectinesterase: influence of pH and
additives. Journal of Agricultural and Food Chemistry, 47:2950-2958.
• Van den Broeck, I., Ludikhuyze, L.R., Van Loey, A.M. and Hendrickx, M. 2000. Inactivation of
orange pectinesterase by combined high-pressure and temperature treatments: a kinetic study. Journal
of Agricultural and Food Chemistry, 48:1960-1970.
• Van der Berg, R.W., Hoogland, H., Lelieveld, H.L.M. and Schepdael, L.V. 2002. High pressure
equipment designs for food processing applications, in “Ultra High Pressure Treatments of Foods”, pp.
297-304. Ed. Hendrickx, M. & Knorr, D., Kluwer Academic, New York, USA.
• Van loey, A., Verachert, B. and Hendrickx, M. 2002. Effects of high electric field pulses on enzymes.
Trends in Food Science and Technology, 12:94-102.
• Vega-Mercado, H., Pothakamury, U. R., Chang, F. J., Barbosa-Cánovas, G.V. and Swanson, B.G.
1996. Inactivation of Escherichia coli by combining pH, ionic strength and pulse electric field hurdles.
Food Research International, 29:117-121
• Versteeg, C., Rombouts, F. M., Spaansen, C.H. and Pilnik, W. 1980. Thermoestability and orange juice
cloud stabilizing properties of multiple pectinesterases from orange. Journal of Food Science, 45:969-
971.
• Weibull, W. 1951. A statistical distribution function of wide applicability. Journal of Applied.
Mechanic, 51:293– 297.
• Wicker, L. and Temelli, F. 1988. Heat inactivation of pectinarase in orange juice pulp. Journal of Food
Science, 53:162-164.
• Wouters, P.C., Bos, Ad.P. and Ueckert, J. 2001. Membrane permeabilization in relation to inactivation
kinetics of Lactobacillus species due to pulsed electric fields. Applied and Environmental
Microbiology, 67:3092-3101.

REFERENCES
190
• Wouters, P.C., Dutreux, N., Smelt, J.P.P.M. and Lelieveld, H.L.M. 1999. Effects of pulsed electric
fields on inactivation kinetics of Listeria innocua. Applied and Environmental Microbiology, 65:5364-
5371.
• Wuytack, E.Y., Boven, S. and Michiels, C.W. 1998. Comparative study of pressure-induced
germination Bacillus subtilis spores at low and high pressures. Applied and Environmental
Microbiology, 64:3220-3224.
• Wuytack, E.Y. 1999. Pressure-induced germination and inactivation of Bacillus subtilis spores. Ph.D.
thesis, Faculty of Agricultural and Applied Biological Sciences, Katholieke Universiteit Leuven.
• Yang, R.J., Li, S.Q. and Zhang, Q.H. 2004. Effects of pulsed electric fields on the activity of enzymes
in aqueous solution. Journal of Food Science, 69:241-248.
• Yeom, H.W., Streaker, C.B., Zhang, Q.H. and Min, D.B. 2000. Effects of pulsed electric fields on the
quality of orange juice and comparison with heat pasteurization. Journal of Agricultural and Food
Chemistry, 48:4597-4605.
• Yeom, H.W., Zhang, Q.H. and Chism, G.W. 2002. Inactivation of pectin methyl esterase in orange
juice by pulsed electric fields. Journal of Food Science, 67:2154-2159.
• Yuk, H.G. and Schneider, K.R. 2006. Adaptation of Salmonella spp. in juice stored under refrigerated
and room temperature enhances acid resistance to simulated gastric fluid. Food Microbiology, 23:694-
700.
• Zhang, Q.H., Chang, F.J., Barbosa-Cánovas, G.V. and Swanson, B.G. 1994. Inactivation of
microorganisms in a semisolid model food using high voltaje pulsed electric fields. Lebensmittel
Wissenchaft under Technologie, 27:538-543.
• Zhang, Q.H., Monsalve-González, A., Qin, B.L., Barbosa-Cánovas, G.V. and Swanson, B.G. 1994.
Inactivation of Saccharomyces cerevisiae in apple juice by square-wave and exponential-decay pulsed
electric fields. Journal of Food Process Engineering, 17:469-478.
• Zhao, T., Doyle, M.P. and Besser, R.E. 1993. Fate of enterohemorrhagic Escherichia coli O157:H7 in
apple cider with and without preservatives. Applied and Environmental Microbiology 59:2526-2530.
• Zimmermann,U. 1986. Electrical breakdown, electropermeabilization and electrofusion. Reviews of
Physiology, Biochemistry and Pharmacology, 105:175-256.

8.-ANEXES


ANNEXES
193
8.1 COMMUNICATIONS BASED ON THESIS WORK

ANNEXES
194

ANNEXES
195

ANNEXES
196

ANNEXES
197

ANNEXES
198
8.2 STATISTICAL ANALYSIS
Table 8.2.1: Effect of juice content on PEF inactivation of E.coli at 40 kV/cm. Log (S) by % juice
--------------------------------------------------------------------------------Método: 95.0 porcentaje HSD de Tukey% juice Frec. Media Grupos homogéneos--------------------------------------------------------------------------------15 4 -1.91 X 25 4 -1.9 X 50 4 -1.7225 X 70 4 -1.195 X--------------------------------------------------------------------------------Contraste Diferencias +/- Límites--------------------------------------------------------------------------------15 - 25 -0.01 0.467063 15 - 50 -0.1875 0.467063 15 - 70 *-0.715 0.467063 25 - 50 -0.1775 0.467063 25 - 70 *-0.705 0.467063 50 - 70 *-0.5275 0.467063 --------------------------------------------------------------------------------* indica una diferencia significativa.
Table 8.2.2: Effect of temperature on volatile compounds concentration after
thermal treatment. Volatile compounds loss (%) by T
--------------------------------------------------------------------------------Método: 95.0 porcentaje HSD de TukeyT Frec. Media Grupos homogéneos--------------------------------------------------------------------------------60 12 15.9806 X 65 12 19.877 XX 70 12 26.1924 XXX75 12 27.9513 XXX80 12 33.051 XX85 12 39.325 X90 12 41.0536 X--------------------------------------------------------------------------------Contraste Diferencias +/- Límites--------------------------------------------------------------------------------60 - 65 -3.89642 16.3351 60 - 70 -10.2118 16.3351 60 - 75 -11.9708 16.3351 60 - 80 *-17.0704 16.3351 60 - 85 *-23.3444 16.3351 60 - 90 *-25.073 16.3351 65 - 70 -6.31542 16.3351 65 - 75 -8.07433 16.3351 65 - 80 -13.174 16.3351 65 - 85 *-19.448 16.3351 65 - 90 *-21.1766 16.3351 70 - 75 -1.75892 16.3351 70 - 80 -6.85858 16.3351 70 - 85 -13.1326 16.3351 70 - 90 -14.8612 16.3351 75 - 80 -5.09967 16.3351 75 - 85 -11.3737 16.3351 75 - 90 -13.1022 16.3351 80 - 85 -6.274 16.3351 80 - 90 -8.00258 16.3351 85 - 90 -1.72858 16.3351 --------------------------------------------------------------------------------* indica una diferencia significativa.
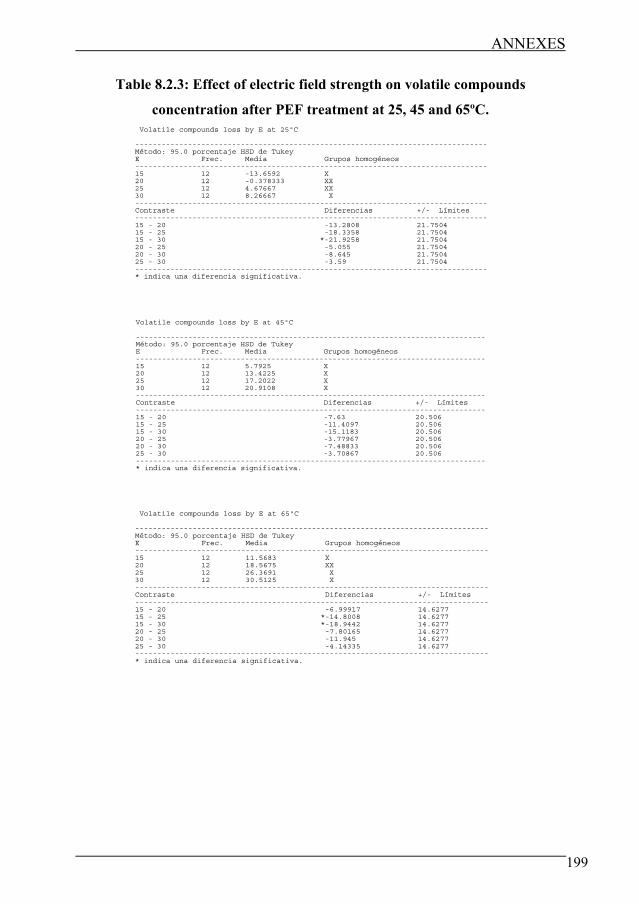
ANNEXES
199
Table 8.2.3: Effect of electric field strength on volatile compounds
concentration after PEF treatment at 25, 45 and 65ºC. Volatile compounds loss by E at 25ºC
--------------------------------------------------------------------------------Método: 95.0 porcentaje HSD de TukeyE Frec. Media Grupos homogéneos--------------------------------------------------------------------------------15 12 -13.6592 X 20 12 -0.378333 XX25 12 4.67667 XX30 12 8.26667 X--------------------------------------------------------------------------------Contraste Diferencias +/- Límites--------------------------------------------------------------------------------15 - 20 -13.2808 21.7504 15 - 25 -18.3358 21.7504 15 - 30 *-21.9258 21.7504 20 - 25 -5.055 21.7504 20 - 30 -8.645 21.7504 25 - 30 -3.59 21.7504 --------------------------------------------------------------------------------* indica una diferencia significativa.
Volatile compounds loss by E at 45ºC
--------------------------------------------------------------------------------Método: 95.0 porcentaje HSD de TukeyE Frec. Media Grupos homogéneos--------------------------------------------------------------------------------15 12 5.7925 X20 12 13.4225 X25 12 17.2022 X30 12 20.9108 X--------------------------------------------------------------------------------Contraste Diferencias +/- Límites--------------------------------------------------------------------------------15 - 20 -7.63 20.506 15 - 25 -11.4097 20.506 15 - 30 -15.1183 20.506 20 - 25 -3.77967 20.506 20 - 30 -7.48833 20.506 25 - 30 -3.70867 20.506 --------------------------------------------------------------------------------* indica una diferencia significativa.
Volatile compounds loss by E at 65ºC
--------------------------------------------------------------------------------Método: 95.0 porcentaje HSD de TukeyE Frec. Media Grupos homogéneos--------------------------------------------------------------------------------15 12 11.5683 X 20 12 18.5675 XX25 12 26.3691 X30 12 30.5125 X--------------------------------------------------------------------------------Contraste Diferencias +/- Límites--------------------------------------------------------------------------------15 - 20 -6.99917 14.6277 15 - 25 *-14.8008 14.6277 15 - 30 *-18.9442 14.6277 20 - 25 -7.80165 14.6277 20 - 30 -11.945 14.6277 25 - 30 -4.14335 14.6277 --------------------------------------------------------------------------------* indica una diferencia significativa.

ANNEXES
200
Table 8.2.4: Effect of temperature on volatile compounds concentration after
PEF treatment at 15, 20, 25 and 30 kV/cm. Volatile compounds loss by T at 15 kV/cm
--------------------------------------------------------------------------------Método: 95.0 porcentaje HSD de TukeyT Frec. Media Grupos homogéneos--------------------------------------------------------------------------------25 12 -13.6592 X 45 12 5.7925 XX65 12 11.5683 X--------------------------------------------------------------------------------Contraste Diferencias +/- Límites--------------------------------------------------------------------------------25 - 45 -19.4517 21.2267 25 - 65 *-25.2275 21.2267 45 - 65 -5.77583 21.2267 --------------------------------------------------------------------------------* indica una diferencia significativa.
Volatile compounds loss by T at 20 kV/cm
--------------------------------------------------------------------------------Método: 95.0 porcentaje HSD de TukeyT Frec. Media Grupos homogéneos--------------------------------------------------------------------------------25 12 -0.378333 X 45 12 13.4225 XX65 12 18.5675 X--------------------------------------------------------------------------------Contraste Diferencias +/- Límites--------------------------------------------------------------------------------25 - 45 -13.8008 18.3794 25 - 65 *-18.9458 18.3794 45 - 65 -5.145 18.3794 --------------------------------------------------------------------------------* indica una diferencia significativa.
Volatile compounds loss by T at 25 kV/cm
--------------------------------------------------------------------------------Método: 95.0 porcentaje HSD de TukeyT Frec. Media Grupos homogéneos--------------------------------------------------------------------------------25 12 4.67667 X 45 12 17.2022 XX65 12 26.3691 X--------------------------------------------------------------------------------Contraste Diferencias +/- Límites--------------------------------------------------------------------------------25 - 45 -12.5255 15.3591 25 - 65 *-21.6925 15.3591 45 - 65 -9.16698 15.3591 --------------------------------------------------------------------------------* indica una diferencia significativa.
Volatile compounds loss by T at 30 kV/cm
--------------------------------------------------------------------------------Método: 95.0 porcentaje HSD de TukeyT Frec. Media Grupos homogéneos--------------------------------------------------------------------------------25 12 8.26667 X 45 12 20.9108 XX65 12 30.5125 X--------------------------------------------------------------------------------Contraste Diferencias +/- Límites--------------------------------------------------------------------------------25 - 45 -12.6442 14.9421 25 - 65 *-22.2458 14.9421 45 - 65 -9.60167 14.9421 --------------------------------------------------------------------------------* indica una diferencia significativa.

ANNEXES
201
Table 8.2.5: Effect of pressure level on volatile compounds concentration after
HHP treatment at 30 and 50ºC. Volatile compounds loss by P at 30ºC
--------------------------------------------------------------------------------Método: 95.0 porcentaje HSD de TukeyP Frec. Media Grupos homogéneos--------------------------------------------------------------------------------500 12 -14.4427 X450 12 -14.1837 X550 12 -12.0736 X600 12 -3.76867 X650 12 7.47825 X--------------------------------------------------------------------------------Contraste Diferencias +/- Límites--------------------------------------------------------------------------------450 - 500 0.259 31.8213 450 - 550 -2.11008 31.8213 450 - 600 -10.415 31.8213 450 - 650 -21.6619 31.8213 500 - 550 -2.36908 31.8213 500 - 600 -10.674 31.8213 500 - 650 -21.9209 31.8213 550 - 600 -8.30492 31.8213 550 - 650 -19.5518 31.8213 600 - 650 -11.2469 31.8213 --------------------------------------------------------------------------------* indica una diferencia significativa.
Volatile compounds loss by P at 50ºC
--------------------------------------------------------------------------------Método: 95.0 porcentaje HSD de TukeyP Frec. Media Grupos homogéneos--------------------------------------------------------------------------------450 12 22.9283 X500 12 30.3541 X550 12 32.383 X600 12 35.9505 X650 12 42.3475 X--------------------------------------------------------------------------------Contraste Diferencias +/- Límites--------------------------------------------------------------------------------450 - 500 -7.42575 22.1508 450 - 550 -9.45467 22.1508 450 - 600 -13.0222 22.1508 450 - 650 -19.4192 22.1508 500 - 550 -2.02892 22.1508 500 - 600 -5.59642 22.1508 500 - 650 -11.9934 22.1508 550 - 600 -3.5675 22.1508 550 - 650 -9.9645 22.1508 600 - 650 -6.397 22.1508 --------------------------------------------------------------------------------* indica una diferencia significativa.
Table 8.2.6: Effect of temperature on volatile compounds concentration after
HHP treatment at 450, 500, 550, 600 and 650 MPa. Volatile compounds loss by T at 450 MPa
--------------------------------------------------------------------------------Método: 95.0 porcentaje HSD de TukeyT Frec. Media Grupos homogéneos--------------------------------------------------------------------------------30 12 -14.1837 X 50 12 22.9283 X--------------------------------------------------------------------------------Contraste Diferencias +/- Límites--------------------------------------------------------------------------------30 - 50 *-37.112 20.9987 --------------------------------------------------------------------------------* indica una diferencia significativa.

ANNEXES
202
Volatile compounds loss by T at 500 MPa
--------------------------------------------------------------------------------Método: 95.0 porcentaje HSD de TukeyT Frec. Media Grupos homogéneos--------------------------------------------------------------------------------30 12 -14.4427 X 50 12 30.3541 X--------------------------------------------------------------------------------Contraste Diferencias +/- Límites--------------------------------------------------------------------------------30 - 50 *-44.7968 19.6123 --------------------------------------------------------------------------------* indica una diferencia significativa.
Volatile compounds loss by T at 550 MPa
--------------------------------------------------------------------------------Método: 95.0 porcentaje HSD de TukeyT Frec. Media Grupos homogéneos--------------------------------------------------------------------------------30 12 -12.0736 X 50 12 32.383 X--------------------------------------------------------------------------------Contraste Diferencias +/- Límites--------------------------------------------------------------------------------30 - 50 *-44.4566 21.1014 --------------------------------------------------------------------------------* indica una diferencia significativa.
Volatile compounds loss by T at 600 MPa
--------------------------------------------------------------------------------Método: 95.0 porcentaje HSD de TukeyT Frec. Media Grupos homogéneos--------------------------------------------------------------------------------30 12 -3.76867 X 50 12 35.9505 X--------------------------------------------------------------------------------Contraste Diferencias +/- Límites--------------------------------------------------------------------------------30 - 50 *-39.7192 20.8567 --------------------------------------------------------------------------------* indica una diferencia significativa.
Volatile compounds loss by T at 650 MPa
--------------------------------------------------------------------------------Método: 95.0 porcentaje HSD de TukeyT Frec. Media Grupos homogéneos--------------------------------------------------------------------------------30 12 7.47825 X 50 12 42.3475 X--------------------------------------------------------------------------------Contraste Diferencias +/- Límites--------------------------------------------------------------------------------30 - 50 *-34.8693 18.0579 --------------------------------------------------------------------------------* indica una diferencia significativa.

ANNEXES
203
Table 8.2.7: Effect of treatment time on survivors fraction of L. plantarum
after PEF treatment at 35 and 40 kV/cm and 35ºC. Log (S) by Treatment time at 40 kV/cm and 35ºC
--------------------------------------------------------------------------------Método: 95.0 porcentaje HSD de TukeyTreatment time Frec. Media Grupos homogéneos--------------------------------------------------------------------------------130 3 -2.12333 X 110 3 -1.80333 X 80 3 -1.71667 XX90 3 -1.7 XX60 3 -1.63667 XX40 3 -1.53667 X--------------------------------------------------------------------------------Contraste Diferencias +/- Límites--------------------------------------------------------------------------------40 - 60 0.1 0.209094 40 - 80 0.18 0.209094 40 - 90 0.163333 0.209094 40 - 110 *0.266667 0.209094 40 - 130 *0.586667 0.209094 60 - 80 0.08 0.209094 60 - 90 0.0633333 0.209094 60 - 110 0.166667 0.209094 60 - 130 *0.486667 0.209094 80 - 90 -0.0166667 0.209094 80 - 110 0.0866667 0.209094 80 - 130 *0.406667 0.209094 90 - 110 0.103333 0.209094 90 - 130 *0.423333 0.209094 110 - 130 *0.32 0.209094 --------------------------------------------------------------------------------* indica una diferencia significativa.
Log (S) by Treatment time at 35 kV/cm and 35ºC
--------------------------------------------------------------------------------Método: 95.0 porcentaje HSD de TukeyTreatment time Frec. Media Grupos homogéneos--------------------------------------------------------------------------------180 3 -1.9 X 130 3 -1.70667 X 100 3 -1.67 X 80 3 -1.61333 XX60 3 -1.58667 XX40 3 -1.49333 X--------------------------------------------------------------------------------Contraste Diferencias +/- Límites--------------------------------------------------------------------------------40 - 60 0.0933333 0.133595 40 - 80 0.12 0.133595 40 - 100 *0.176667 0.133595 40 - 130 *0.213333 0.133595 40 - 180 *0.406667 0.133595 60 - 80 0.0266667 0.133595 60 - 100 0.0833333 0.133595 60 - 130 0.12 0.133595 60 - 180 *0.313333 0.133595 80 - 100 0.0566667 0.133595 80 - 130 0.0933333 0.133595 80 - 180 *0.286667 0.133595 100 - 130 0.0366667 0.133595 100 - 180 *0.23 0.133595 130 - 180 *0.193333 0.133595 --------------------------------------------------------------------------------* indica una diferencia significativa.

ANNEXES
204
Table 8.2.8: Effect of electric field strength on survivors fraction of L.
plantarum after PEF treatment at 40, 60, 80 and 130 μs and 35ºC. Log (S) by E at 40 micros and 35ºC
--------------------------------------------------------------------------------Método: 95.0 porcentaje HSD de TukeyE Frec. Media Grupos homogéneos--------------------------------------------------------------------------------40 3 -1.53667 X35 3 -1.49333 X--------------------------------------------------------------------------------Contraste Diferencias +/- Límites--------------------------------------------------------------------------------35 - 40 0.0433333 0.0692569 --------------------------------------------------------------------------------* indica una diferencia significativa.
Log (S) by E at 60 micros and 35ºC
--------------------------------------------------------------------------------Método: 95.0 porcentaje HSD de TukeyE Frec. Media Grupos homogéneos--------------------------------------------------------------------------------40 3 -1.63667 X35 3 -1.58667 X--------------------------------------------------------------------------------Contraste Diferencias +/- Límites--------------------------------------------------------------------------------35 - 40 0.05 0.130883 --------------------------------------------------------------------------------* indica una diferencia significativa.
Log (S) by E at 80 micros and 35ºC
--------------------------------------------------------------------------------Método: 95.0 porcentaje HSD de TukeyE Frec. Media Grupos homogéneos--------------------------------------------------------------------------------40 3 -1.71667 X 35 3 -1.61333 X--------------------------------------------------------------------------------Contraste Diferencias +/- Límites--------------------------------------------------------------------------------35 - 40 *0.103333 0.0471906 --------------------------------------------------------------------------------* indica una diferencia significativa.
Log (S) by E at 130 micros and 35ºC
--------------------------------------------------------------------------------Método: 95.0 porcentaje HSD de TukeyE Frec. Media Grupos homogéneos--------------------------------------------------------------------------------40 3 -2.12333 X 35 3 -1.70667 X--------------------------------------------------------------------------------Contraste Diferencias +/- Límites--------------------------------------------------------------------------------35 - 40 *0.416667 0.147498 --------------------------------------------------------------------------------* indica una diferencia significativa.
Table 8.2.9: Effect of temperature on survivors fraction of L. plantarum after
PEF treatment at 35 and 40 kV/cm. Log (S) by T at 40 kV/cm
--------------------------------------------------------------------------------Método: 95.0 porcentaje HSD de TukeyT Frec. Media Grupos homogéneos--------------------------------------------------------------------------------55 6 -2.055 X 35 6 -1.75333 X--------------------------------------------------------------------------------Contraste Diferencias +/- Límites--------------------------------------------------------------------------------35 - 55 *0.301667 0.275271 --------------------------------------------------------------------------------* indica una diferencia significativa.

ANNEXES
205
Log (S) by T at 35 kV/cm
--------------------------------------------------------------------------------Método: 95.0 porcentaje HSD de TukeyT Frec. Media Grupos homogéneos--------------------------------------------------------------------------------55 18 -1.97278 X 35 18 -1.66167 X--------------------------------------------------------------------------------Contraste Diferencias +/- Límites--------------------------------------------------------------------------------35 - 55 *0.311111 0.0820346 --------------------------------------------------------------------------------* indica una diferencia significativa.
Table 8.2.10: Effect of treatment time on survivors fraction of L. plantarum
after PEF treatment at 35 and 40 kV/cm and 55ºC Log (S) by Treatment time at 40 kV/cm and 55ºC
--------------------------------------------------------------------------------Método: 95.0 porcentaje HSD de TukeyTreatment time Frec. Media Grupos homogéneos--------------------------------------------------------------------------------130 3 -2.45667 X 110 3 -2.16333 X 90 3 -2.01333 XX80 3 -1.97 XX60 3 -1.89667 X40 3 -1.83333 X--------------------------------------------------------------------------------Contraste Diferencias +/- Límites--------------------------------------------------------------------------------40 - 60 0.0633333 0.20177 40 - 80 0.136667 0.20177 40 - 90 0.18 0.20177 40 - 110 *0.33 0.20177 40 - 130 *0.623333 0.20177 60 - 80 0.0733333 0.20177 60 - 90 0.116667 0.20177 60 - 110 *0.266667 0.20177 60 - 130 *0.56 0.20177 80 - 90 0.0433333 0.20177 80 - 110 0.193333 0.20177 80 - 130 *0.486667 0.20177 90 - 110 0.15 0.20177 90 - 130 *0.443333 0.20177 110 - 130 *0.293333 0.20177 --------------------------------------------------------------------------------* indica una diferencia significativa.
Log (S) by Treatment time at 35 kV/cm and 55ºC
--------------------------------------------------------------------------------Método: 95.0 porcentaje HSD de TukeyTreatment time Frec. Media Grupos homogéneos--------------------------------------------------------------------------------180 3 -2.06667 X 100 3 -2.06 X 130 3 -1.99667 XX80 3 -1.99333 XX60 3 -1.88667 XX40 3 -1.83333 X--------------------------------------------------------------------------------Contraste Diferencias +/- Límites--------------------------------------------------------------------------------40 - 60 0.0533333 0.180097 40 - 80 0.16 0.180097 40 - 100 *0.226667 0.180097 40 - 130 0.163333 0.180097 40 - 180 *0.233333 0.180097 60 - 80 0.106667 0.180097 60 - 100 0.173333 0.180097 60 - 130 0.11 0.180097 60 - 180 0.18 0.180097 80 - 100 0.0666667 0.180097 80 - 130 0.00333333 0.180097 80 - 180 0.0733333 0.180097 100 - 130 -0.0633333 0.180097 100 - 180 0.00666667 0.180097 130 - 180 0.07 0.180097 --------------------------------------------------------------------------------* indica una diferencia significativa.

ANNEXES
206
Table 8.2.11: Effect of pulse width on survivors fraction of L. plantarum after
PEF treatment at 40 and 35 kV/cm and 35ºC. Log (S) by Pulse width at 40 kV/cm and 35ºC
--------------------------------------------------------------------------------Método: 95.0 porcentaje HSD de TukeyPulse width Frec. Media Grupos homogéneos--------------------------------------------------------------------------------2.5 18 -1.75278 X4 11 -1.69 X--------------------------------------------------------------------------------Contraste Diferencias +/- Límites--------------------------------------------------------------------------------2.5 - 4 -0.0627778 0.13804 --------------------------------------------------------------------------------* indica una diferencia significativa.
Log (S) by Pulse width at 35 kV/cm and 35ºC
--------------------------------------------------------------------------------Método: 95.0 porcentaje HSD de TukeyPulse width Frec. Media Grupos homogéneos--------------------------------------------------------------------------------4 12 -1.74583 X2.5 18 -1.66167 X--------------------------------------------------------------------------------Contraste Diferencias +/- Límites--------------------------------------------------------------------------------2.5 - 4 0.0841667 0.129114 --------------------------------------------------------------------------------* indica una diferencia significativa.
Table 8.2.12: Effect of pulse width on survivors fraction of L. plantarum after
PEF treatment at 40 and 35 kV/cm and 55ºC. Log (S) by Pulse width at 40 kV/cm and 55ºC
--------------------------------------------------------------------------------Método: 95.0 porcentaje HSD de TukeyPulse width Frec. Media Grupos homogéneos--------------------------------------------------------------------------------2.5 18 -2.05556 X4 12 -1.96 X--------------------------------------------------------------------------------Contraste Diferencias +/- Límites--------------------------------------------------------------------------------2.5 - 4 -0.0955556 0.161506 --------------------------------------------------------------------------------* indica una diferencia significativa.
Log (S) by Pulse width at 35 kV/cm and 55ºC
--------------------------------------------------------------------------------Método: 95.0 porcentaje HSD de TukeyPulse width Frec. Media Grupos homogéneos--------------------------------------------------------------------------------4 12 -2.04667 X2.5 18 -1.97278 X--------------------------------------------------------------------------------Contraste Diferencias +/- Límites--------------------------------------------------------------------------------2.5 - 4 0.0738889 0.133183 --------------------------------------------------------------------------------* indica una diferencia significativa.
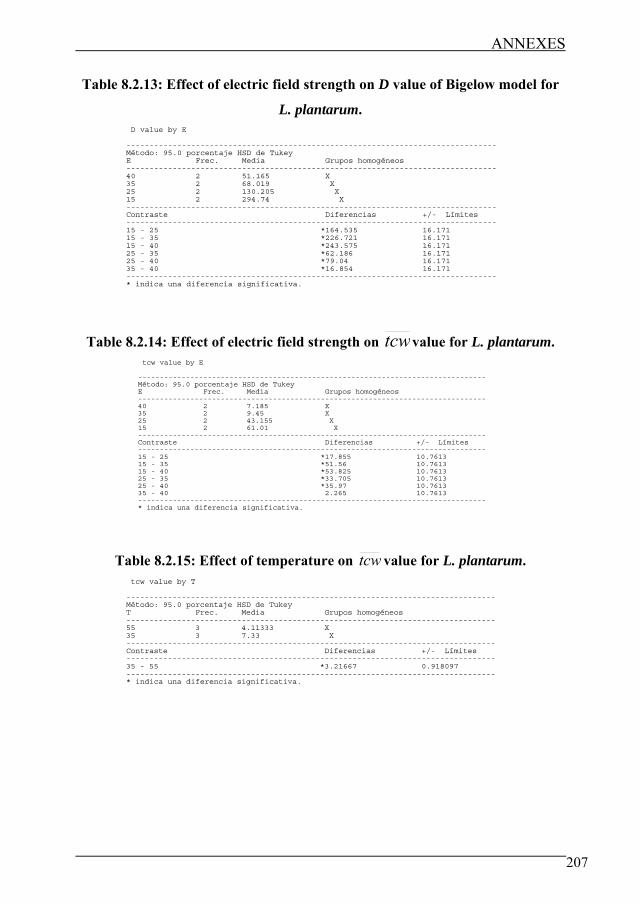
ANNEXES
207
Table 8.2.13: Effect of electric field strength on D value of Bigelow model for
L. plantarum. D value by E
--------------------------------------------------------------------------------Método: 95.0 porcentaje HSD de TukeyE Frec. Media Grupos homogéneos--------------------------------------------------------------------------------40 2 51.165 X 35 2 68.019 X 25 2 130.205 X 15 2 294.74 X--------------------------------------------------------------------------------Contraste Diferencias +/- Límites--------------------------------------------------------------------------------15 - 25 *164.535 16.171 15 - 35 *226.721 16.171 15 - 40 *243.575 16.171 25 - 35 *62.186 16.171 25 - 40 *79.04 16.171 35 - 40 *16.854 16.171 --------------------------------------------------------------------------------* indica una diferencia significativa.
Table 8.2.14: Effect of electric field strength on tcwvalue for L. plantarum. tcw value by E
--------------------------------------------------------------------------------Método: 95.0 porcentaje HSD de TukeyE Frec. Media Grupos homogéneos--------------------------------------------------------------------------------40 2 7.185 X 35 2 9.45 X 25 2 43.155 X 15 2 61.01 X--------------------------------------------------------------------------------Contraste Diferencias +/- Límites--------------------------------------------------------------------------------15 - 25 *17.855 10.7613 15 - 35 *51.56 10.7613 15 - 40 *53.825 10.7613 25 - 35 *33.705 10.7613 25 - 40 *35.97 10.7613 35 - 40 2.265 10.7613 --------------------------------------------------------------------------------* indica una diferencia significativa.
Table 8.2.15: Effect of temperature on tcw value for L. plantarum.
tcw value by T
--------------------------------------------------------------------------------Método: 95.0 porcentaje HSD de TukeyT Frec. Media Grupos homogéneos--------------------------------------------------------------------------------55 3 4.11333 X 35 3 7.33 X--------------------------------------------------------------------------------Contraste Diferencias +/- Límites--------------------------------------------------------------------------------35 - 55 *3.21667 0.918097 --------------------------------------------------------------------------------* indica una diferencia significativa.

ANNEXES
208
Table 8.2.16: Effect of electric field strength on D value of Bigelow model for
S. typhimurium. D value by E
--------------------------------------------------------------------------------Método: 95.0 porcentaje HSD de TukeyE Frec. Media Grupos homogéneos--------------------------------------------------------------------------------40 2 149.015 X 35 2 234.81 X 25 2 454.25 X 15 2 1454.65 X--------------------------------------------------------------------------------Contraste Diferencias +/- Límites--------------------------------------------------------------------------------15 - 25 *1000.4 65.6374 15 - 35 *1219.84 65.6374 15 - 40 *1305.63 65.6374 25 - 35 *219.44 65.6374 25 - 40 *305.235 65.6374 35 - 40 *85.795 65.6374 --------------------------------------------------------------------------------* indica una diferencia significativa.
Table 8.2.17: Effect of electric field strength on tc value of Hülsheger model
for S. typhimurium. tc value by E
--------------------------------------------------------------------------------Método: 95.0 porcentaje HSD de TukeyE Frec. Media Grupos homogéneos--------------------------------------------------------------------------------40 2 1.365 X 35 2 4.6 X 25 1 22.56 X 15 1 54.87 X--------------------------------------------------------------------------------Contraste Diferencias +/- Límites--------------------------------------------------------------------------------15 - 25 *32.31 7.34749 15 - 35 *50.27 6.36311 15 - 40 *53.505 6.36311 25 - 35 *17.96 6.36311 25 - 40 *21.195 6.36311 35 - 40 3.235 5.19546 --------------------------------------------------------------------------------* indica una diferencia significativa.
Table 8.2.18: Effect of electric field strength on tcw value for S. typhimurium.
tcw value by E
--------------------------------------------------------------------------------Método: 95.0 porcentaje HSD de TukeyE Frec. Media Grupos homogéneos--------------------------------------------------------------------------------40 2 24.605 X 35 2 38.375 X 25 1 111.111 X 15 1 484.51 X--------------------------------------------------------------------------------Contraste Diferencias +/- Límites--------------------------------------------------------------------------------15 - 25 *373.399 60.1472 15 - 35 *446.135 52.089 15 - 40 *459.905 52.089 25 - 35 *72.736 52.089 25 - 40 *86.506 52.089 35 - 40 13.77 42.5305 --------------------------------------------------------------------------------* indica una diferencia significativa.

ANNEXES
209
Table 8.2.19: Effect of type of microorganism on tcw value. tcw value by Microorganism at 15 kV/cm
--------------------------------------------------------------------------------Método: 95.0 porcentaje HSD de TukeyMicroorganism Frec. Media Grupos homogéneos--------------------------------------------------------------------------------E. coli 2 5.1 X L. plantarum 2 61.01 X S. typhimurium 1 484.51 X--------------------------------------------------------------------------------Contraste Diferencias +/- Límites--------------------------------------------------------------------------------E. coli - L. plantarum *-55.91 17.7562 E. coli - S. typhimurium *-479.41 21.7468 L. plantarum - S. typhimurium *-423.5 21.7468 --------------------------------------------------------------------------------* indica una diferencia significativa.
tcw value by Microorganism at 25 kV/cm
--------------------------------------------------------------------------------Método: 95.0 porcentaje HSD de TukeyMicroorganism Frec. Media Grupos homogéneos--------------------------------------------------------------------------------E. coli 2 2.83 X L. plantarum 2 43.155 X S. typhimurium 1 111.11 X--------------------------------------------------------------------------------Contraste Diferencias +/- Límites--------------------------------------------------------------------------------E. coli - L. plantarum *-40.325 11.7816 E. coli - S. typhimurium *-108.28 14.4295 L. plantarum - S. typhimurium *-67.955 14.4295 --------------------------------------------------------------------------------* indica una diferencia significativa.
tcw value by Microorganism at 35 kV/cm
--------------------------------------------------------------------------------Método: 95.0 porcentaje HSD de TukeyMicroorganism Frec. Media Grupos homogéneos--------------------------------------------------------------------------------E. coli 2 2.19 X L. plantarum 2 9.45 X S. typhimurium 2 38.375 X--------------------------------------------------------------------------------Contraste Diferencias +/- Límites--------------------------------------------------------------------------------E. coli - L. plantarum -7.26 20.7949 E. coli - S. typhimurium *-36.185 20.7949 L. plantarum - S. typhimurium *-28.925 20.7949 --------------------------------------------------------------------------------* indica una diferencia significativa.
tcw value by Microorganism at 40 kV/cm
--------------------------------------------------------------------------------Método: 95.0 porcentaje HSD de TukeyMicroorganism Frec. Media Grupos homogéneos--------------------------------------------------------------------------------E. coli 2 1.11 X L. plantarum 2 7.185 X S. typhimurium 2 24.605 X--------------------------------------------------------------------------------Contraste Diferencias +/- Límites--------------------------------------------------------------------------------E. coli - L. plantarum *-6.075 4.42459 E. coli - S. typhimurium *-23.495 4.42459 L. plantarum - S. typhimurium *-17.42 4.42459 --------------------------------------------------------------------------------* indica una diferencia significativa.

ANNEXES
210
Table 8.2.20: Effect of pH on tcw value at 15 and 40 kV/cm. tcw by pH at 40 kV/cm
--------------------------------------------------------------------------------Método: 95.0 porcentaje HSD de TukeypH Frec. Media Grupos homogéneos--------------------------------------------------------------------------------3.5 2 16.66 X 4 2 40.03 XX4.5 2 61.365 X--------------------------------------------------------------------------------Contraste Diferencias +/- Límites--------------------------------------------------------------------------------3.5 - 4 -23.37 24.9119 3.5 - 4.5 *-44.705 24.9119 4 - 4.5 -21.335 24.9119 --------------------------------------------------------------------------------* indica una diferencia significativa.
tcw by pH at 15 kV/cm
--------------------------------------------------------------------------------Método: 95.0 porcentaje HSD de TukeypH Frec. Media Grupos homogéneos--------------------------------------------------------------------------------3.5 2 249.05 X 4 2 371.4 X4.5 2 488.74 X--------------------------------------------------------------------------------Contraste Diferencias +/- Límites--------------------------------------------------------------------------------3.5 - 4 *-122.35 120.964 3.5 - 4.5 *-239.69 120.964 4 - 4.5 -117.34 120.964 --------------------------------------------------------------------------------* indica una diferencia significativa.
Table 8.2.21: Effect of pectin concentration on tcw value at 15 and 40 kV/cm.
tcw by pectin concentration at 40 kV/cm
--------------------------------------------------------------------------------Método: 95.0 porcentaje HSD de Tukey% pectina Frec. Media Grupos homogéneos--------------------------------------------------------------------------------0.1 2 37.37 X0.6 2 45.5 X0.3 2 61.365 X--------------------------------------------------------------------------------Contraste Diferencias +/- Límites--------------------------------------------------------------------------------0.1 - 0.3 -23.995 25.8898 0.1 - 0.6 -8.13 25.8898 0.3 - 0.6 15.865 25.8898 --------------------------------------------------------------------------------* indica una diferencia significativa.
tcw by pectin concentration at 15 kV/cm
--------------------------------------------------------------------------------Método: 95.0 porcentaje HSD de Tukey% pectina Frec. Media Grupos homogéneos--------------------------------------------------------------------------------0.1 2 402.67 X0.3 2 488.74 X0.6 2 516.925 X--------------------------------------------------------------------------------Contraste Diferencias +/- Límites--------------------------------------------------------------------------------0.1 - 0.3 -86.07 151.009 0.1 - 0.6 -114.255 151.009 0.3 - 0.6 -28.185 151.009 --------------------------------------------------------------------------------* indica una diferencia significativa.
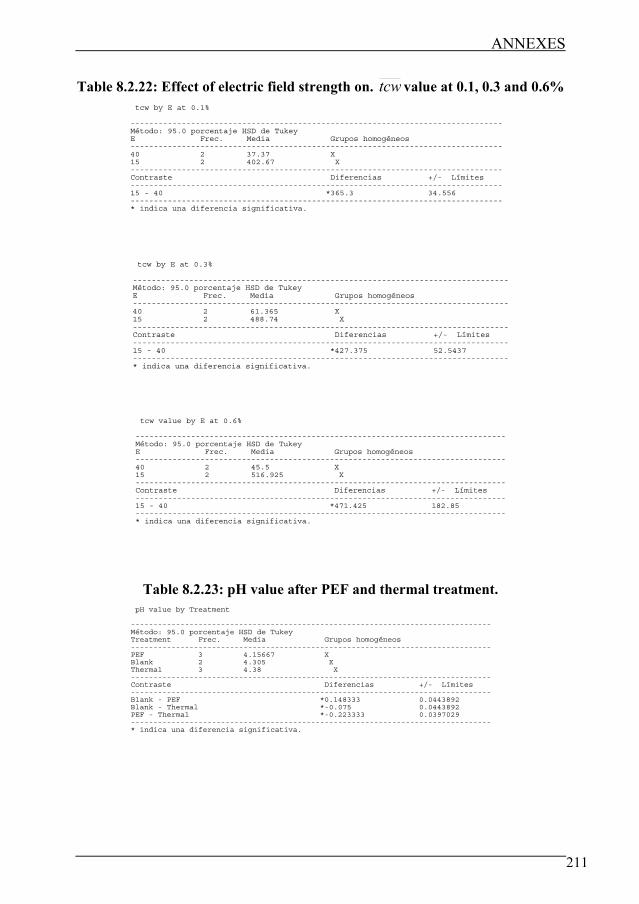
ANNEXES
211
Table 8.2.22: Effect of electric field strength on. tcw value at 0.1, 0.3 and 0.6% tcw by E at 0.1%
--------------------------------------------------------------------------------Método: 95.0 porcentaje HSD de TukeyE Frec. Media Grupos homogéneos--------------------------------------------------------------------------------40 2 37.37 X 15 2 402.67 X--------------------------------------------------------------------------------Contraste Diferencias +/- Límites--------------------------------------------------------------------------------15 - 40 *365.3 34.556 --------------------------------------------------------------------------------* indica una diferencia significativa.
tcw by E at 0.3%
--------------------------------------------------------------------------------Método: 95.0 porcentaje HSD de TukeyE Frec. Media Grupos homogéneos--------------------------------------------------------------------------------40 2 61.365 X 15 2 488.74 X--------------------------------------------------------------------------------Contraste Diferencias +/- Límites--------------------------------------------------------------------------------15 - 40 *427.375 52.5437 --------------------------------------------------------------------------------* indica una diferencia significativa.
tcw value by E at 0.6%
--------------------------------------------------------------------------------Método: 95.0 porcentaje HSD de TukeyE Frec. Media Grupos homogéneos--------------------------------------------------------------------------------40 2 45.5 X 15 2 516.925 X--------------------------------------------------------------------------------Contraste Diferencias +/- Límites--------------------------------------------------------------------------------15 - 40 *471.425 182.85 --------------------------------------------------------------------------------* indica una diferencia significativa.
Table 8.2.23: pH value after PEF and thermal treatment.
pH value by Treatment
--------------------------------------------------------------------------------Método: 95.0 porcentaje HSD de TukeyTreatment Frec. Media Grupos homogéneos--------------------------------------------------------------------------------PEF 3 4.15667 X Blank 2 4.305 X Thermal 3 4.38 X--------------------------------------------------------------------------------Contraste Diferencias +/- Límites--------------------------------------------------------------------------------Blank - PEF *0.148333 0.0443892 Blank - Thermal *-0.075 0.0443892 PEF - Thermal *-0.223333 0.0397029 --------------------------------------------------------------------------------* indica una diferencia significativa.

ANNEXES
212
Table 8.2.24: pH value during storage of PEF, thermal and untreated sample. pH value by Week PEF sample
--------------------------------------------------------------------------------Método: 95.0 porcentaje HSD de TukeyWeek Frec. Media Grupos homogéneos--------------------------------------------------------------------------------4 3 4.16333 X 2 3 4.20333 X 3 3 4.23333 X 0 3 4.34667 X1 3 4.35333 X--------------------------------------------------------------------------------Contraste Diferencias +/- Límites--------------------------------------------------------------------------------0 - 1 -0.00666667 0.0310313 0 - 2 *0.143333 0.0310313 0 - 3 *0.113333 0.0310313 0 - 4 *0.183333 0.0310313 1 - 2 *0.15 0.0310313 1 - 3 *0.12 0.0310313 1 - 4 *0.19 0.0310313 2 - 3 -0.03 0.0310313 2 - 4 *0.04 0.0310313 3 - 4 *0.07 0.0310313 --------------------------------------------------------------------------------* indica una diferencia significativa.
pH value by Week thermal sample
--------------------------------------------------------------------------------Método: 95.0 porcentaje HSD de TukeyWeek Frec. Media Grupos homogéneos--------------------------------------------------------------------------------2 3 4.11667 X 4 3 4.13 X 3 3 4.13667 X 1 3 4.24333 X 0 3 4.28 X--------------------------------------------------------------------------------Contraste Diferencias +/- Límites--------------------------------------------------------------------------------0 - 1 *0.0366667 0.0240368 0 - 2 *0.163333 0.0240368 0 - 3 *0.143333 0.0240368 0 - 4 *0.15 0.0240368 1 - 2 *0.126667 0.0240368 1 - 3 *0.106667 0.0240368 1 - 4 *0.113333 0.0240368 2 - 3 -0.02 0.0240368 2 - 4 -0.0133333 0.0240368 3 - 4 0.00666667 0.0240368 --------------------------------------------------------------------------------* indica una diferencia significativa.
pH value by Week Untreated sample
--------------------------------------------------------------------------------Método: 95.0 porcentaje HSD de TukeyWeek Frec. Media Grupos homogéneos--------------------------------------------------------------------------------4 3 4.01667 X 3 3 4.15 X 2 3 4.16 X 1 3 4.18333 X 0 2 4.305 X--------------------------------------------------------------------------------Contraste Diferencias +/- Límites--------------------------------------------------------------------------------0 - 1 *0.121667 0.0477713 0 - 2 *0.145 0.0477713 0 - 3 *0.155 0.0477713 0 - 4 *0.288333 0.0477713 1 - 2 0.0233333 0.0427279 1 - 3 0.0333333 0.0427279 1 - 4 *0.166667 0.0427279 2 - 3 0.01 0.0427279 2 - 4 *0.143333 0.0427279 3 - 4 *0.133333 0.0427279 --------------------------------------------------------------------------------* indica una diferencia significativa.

ANNEXES
213
Table 8.2.25: Brix degrees after PEF and thermal treatment. Brix degrees by Treatment
--------------------------------------------------------------------------------Método: 95.0 porcentaje HSD de TukeyTreatment Frec. Media Grupos homogéneos--------------------------------------------------------------------------------PEF 3 14.6667 X Blank 3 15.0667 XThermal 3 15.1 X--------------------------------------------------------------------------------Contraste Diferencias +/- Límites--------------------------------------------------------------------------------Blank - PEF *0.4 0.186731 Blank - Thermal -0.0333333 0.186731 PEF - Thermal *-0.433333 0.186731 --------------------------------------------------------------------------------* indica una diferencia significativa.
Table 8.2.26: Brix degrees during the storage of PEF, thermal and untreated
sample.
Brix degrees by Week PEF sample--------------------------------------------------------------------------------Método: 95.0 porcentaje HSD de TukeyWeek Frec. Media Grupos homogéneos--------------------------------------------------------------------------------3 3 14.3667 X2 3 14.6 X1 3 14.6 X4 3 14.6 X0 2 14.65 X--------------------------------------------------------------------------------Contraste Diferencias +/- Límites--------------------------------------------------------------------------------0 - 1 0.05 0.34164 0 - 2 0.05 0.34164 0 - 3 0.283333 0.34164 0 - 4 0.05 0.34164 1 - 2 0.0 0.305572 1 - 3 0.233333 0.305572 1 - 4 0.0 0.305572 2 - 3 0.233333 0.305572 2 - 4 0.0 0.305572 3 - 4 -0.233333 0.305572 --------------------------------------------------------------------------------* indica una diferencia significativa.
Brix degrees by Week Thermal sample
--------------------------------------------------------------------------------Método: 95.0 porcentaje HSD de TukeyWeek Frec. Media Grupos homogéneos--------------------------------------------------------------------------------4 3 13.9 X 3 3 14.8 X 2 3 14.9333 XX1 3 14.9333 XX0 3 15.0667 X--------------------------------------------------------------------------------Contraste Diferencias +/- Límites--------------------------------------------------------------------------------0 - 1 0.133333 0.208164 0 - 2 0.133333 0.208164 0 - 3 *0.266667 0.208164 0 - 4 *1.16667 0.208164 1 - 2 0.0 0.208164 1 - 3 0.133333 0.208164 1 - 4 *1.03333 0.208164 2 - 3 0.133333 0.208164 2 - 4 *1.03333 0.208164 3 - 4 *0.9 0.208164 --------------------------------------------------------------------------------* indica una diferencia significativa.

ANNEXES
214
Brix degrees by Week Untreated sample
--------------------------------------------------------------------------------Método: 95.0 porcentaje HSD de TukeyWeek Frec. Media Grupos homogéneos--------------------------------------------------------------------------------4 3 13.9 X 3 3 14.8 X 2 3 14.9333 XX1 3 14.9333 XX0 3 15.0667 X--------------------------------------------------------------------------------Contraste Diferencias +/- Límites--------------------------------------------------------------------------------0 - 1 0.133333 0.208164 0 - 2 0.133333 0.208164 0 - 3 *0.266667 0.208164 0 - 4 *1.16667 0.208164 1 - 2 0.0 0.208164 1 - 3 0.133333 0.208164 1 - 4 *1.03333 0.208164 2 - 3 0.133333 0.208164 2 - 4 *1.03333 0.208164 3 - 4 *0.9 0.208164 --------------------------------------------------------------------------------* indica una diferencia significativa.
Table 8.2.27: Microbial inactivation after PEF and thermal treatment.
Log S by Treatment for microbial counts
--------------------------------------------------------------------------------Método: 95.0 porcentaje HSD de TukeyTreatment Frec. Media Grupos homogéneos--------------------------------------------------------------------------------PEF 3 -4.59333 XThermal 4 -4.45414 X--------------------------------------------------------------------------------Contraste Diferencias +/- Límites--------------------------------------------------------------------------------PEF - Thermal -0.139197 0.154954 --------------------------------------------------------------------------------* indica una diferencia significativa.
Table 8.2.28: PME activity after PEF and thermal treatment. PME activity by Treatment
--------------------------------------------------------------------------------Método: 95.0 porcentaje HSD de TukeyTreatment Frec. Media Grupos homogéneos--------------------------------------------------------------------------------PEF 3 0.0356667 X Thermal 3 0.0393333 X Blank 4 0.2615 X--------------------------------------------------------------------------------Contraste Diferencias +/- Límites--------------------------------------------------------------------------------Blank - PEF *0.225833 0.0477405 Blank - Thermal *0.222167 0.0477405 PEF - Thermal -0.00366667 0.0510367 --------------------------------------------------------------------------------* indica una diferencia significativa.
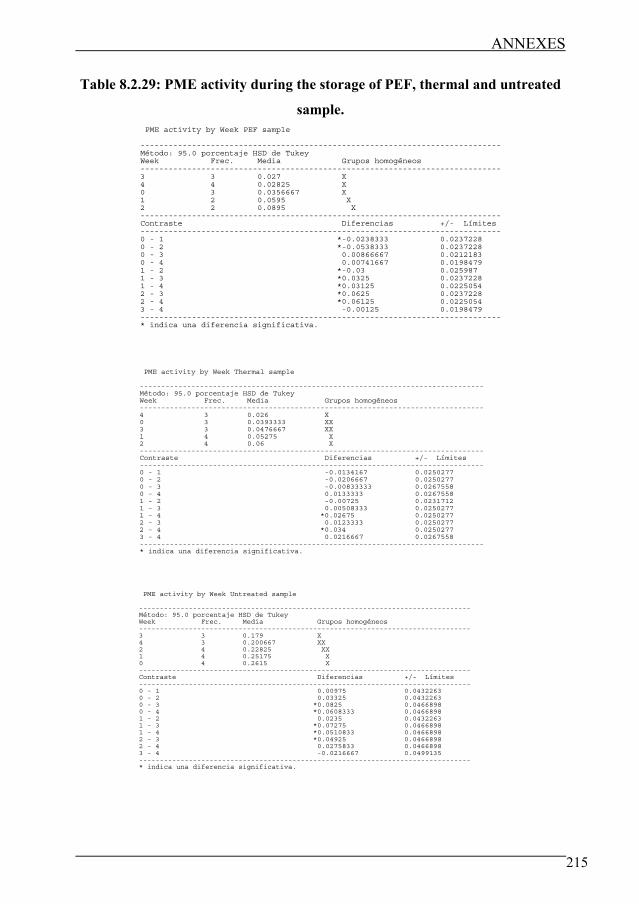
ANNEXES
215
Table 8.2.29: PME activity during the storage of PEF, thermal and untreated
sample.
PME activity by Week PEF sample-----------------------------------------------------------------------------Método: 95.0 porcentaje HSD de TukeyWeek Frec. Media Grupos homogéneos-----------------------------------------------------------------------------3 3 0.027 X 4 4 0.02825 X 0 3 0.0356667 X 1 2 0.0595 X 2 2 0.0895 X-----------------------------------------------------------------------------Contraste Diferencias +/- Límites-----------------------------------------------------------------------------0 - 1 *-0.0238333 0.0237228 0 - 2 *-0.0538333 0.0237228 0 - 3 0.00866667 0.0212183 0 - 4 0.00741667 0.0198479 1 - 2 *-0.03 0.025987 1 - 3 *0.0325 0.0237228 1 - 4 *0.03125 0.0225054 2 - 3 *0.0625 0.0237228 2 - 4 *0.06125 0.0225054 3 - 4 -0.00125 0.0198479 -----------------------------------------------------------------------------* indica una diferencia significativa.
PME activity by Week Thermal sample
--------------------------------------------------------------------------------Método: 95.0 porcentaje HSD de TukeyWeek Frec. Media Grupos homogéneos--------------------------------------------------------------------------------4 3 0.026 X 0 3 0.0393333 XX3 3 0.0476667 XX1 4 0.05275 X2 4 0.06 X--------------------------------------------------------------------------------Contraste Diferencias +/- Límites--------------------------------------------------------------------------------0 - 1 -0.0134167 0.0250277 0 - 2 -0.0206667 0.0250277 0 - 3 -0.00833333 0.0267558 0 - 4 0.0133333 0.0267558 1 - 2 -0.00725 0.0231712 1 - 3 0.00508333 0.0250277 1 - 4 *0.02675 0.0250277 2 - 3 0.0123333 0.0250277 2 - 4 *0.034 0.0250277 3 - 4 0.0216667 0.0267558 --------------------------------------------------------------------------------* indica una diferencia significativa.
PME activity by Week Untreated sample
--------------------------------------------------------------------------------Método: 95.0 porcentaje HSD de TukeyWeek Frec. Media Grupos homogéneos--------------------------------------------------------------------------------3 3 0.179 X 4 3 0.200667 XX 2 4 0.22825 XX1 4 0.25175 X0 4 0.2615 X--------------------------------------------------------------------------------Contraste Diferencias +/- Límites--------------------------------------------------------------------------------0 - 1 0.00975 0.0432263 0 - 2 0.03325 0.0432263 0 - 3 *0.0825 0.0466898 0 - 4 *0.0608333 0.0466898 1 - 2 0.0235 0.0432263 1 - 3 *0.07275 0.0466898 1 - 4 *0.0510833 0.0466898 2 - 3 *0.04925 0.0466898 2 - 4 0.0275833 0.0466898 3 - 4 -0.0216667 0.0499135 --------------------------------------------------------------------------------* indica una diferencia significativa.

ANNEXES
216
Table 8.2.30: L* value after PEF and thermal treatment. L value by Treatment
--------------------------------------------------------------------------------Método: 95.0 porcentaje HSD de TukeyTreatment Frec. Media Grupos homogéneos--------------------------------------------------------------------------------Thermal 3 55.6833 X PEF 3 55.9233 X Blank 3 56.3033 X--------------------------------------------------------------------------------Contraste Diferencias +/- Límites--------------------------------------------------------------------------------Blank - PEF *0.38 0.0891627 Blank - Thermal *0.62 0.0891627 PEF - Thermal *0.24 0.0891627 --------------------------------------------------------------------------------* indica una diferencia significativa.
Table 8.2.31: L* value during the storage of PEF, thermal and untreated
sample. L value by Week PEF sample
--------------------------------------------------------------------------------Método: 95.0 porcentaje HSD de TukeyWeek Frec. Media Grupos homogéneos--------------------------------------------------------------------------------4 3 55.4133 X 0 3 55.61 X 2 3 56.2067 X 1 3 57.2667 X 3 3 57.54 X--------------------------------------------------------------------------------Contraste Diferencias +/- Límites--------------------------------------------------------------------------------0 - 1 *-1.65667 0.176224 0 - 2 *-0.596667 0.176224 0 - 3 *-1.93 0.176224 0 - 4 *0.196667 0.176224 1 - 2 *1.06 0.176224 1 - 3 *-0.273333 0.176224 1 - 4 *1.85333 0.176224 2 - 3 *-1.33333 0.176224 2 - 4 *0.793333 0.176224 3 - 4 *2.12667 0.176224 --------------------------------------------------------------------------------* indica una diferencia significativa.
L value by Week Thermal sample
--------------------------------------------------------------------------------Método: 95.0 porcentaje HSD de TukeyWeek Frec. Media Grupos homogéneos--------------------------------------------------------------------------------4 3 56.5667 X 2 3 57.16 X 0 3 57.7 X 3 3 58.0867 X 1 3 58.6067 X--------------------------------------------------------------------------------Contraste Diferencias +/- Límites--------------------------------------------------------------------------------0 - 1 *-0.906667 0.272476 0 - 2 *0.54 0.272476 0 - 3 *-0.386667 0.272476 0 - 4 *1.13333 0.272476 1 - 2 *1.44667 0.272476 1 - 3 *0.52 0.272476 1 - 4 *2.04 0.272476 2 - 3 *-0.926667 0.272476 2 - 4 *0.593333 0.272476 3 - 4 *1.52 0.272476 --------------------------------------------------------------------------------* indica una diferencia significativa.

ANNEXES
217
L value by Week Untreated sample
--------------------------------------------------------------------------------Método: 95.0 porcentaje HSD de TukeyWeek Frec. Media Grupos homogéneos--------------------------------------------------------------------------------2 3 56.1167 X 0 3 56.3033 XX 4 3 56.4267 X 1 3 56.7833 X 3 3 58.08 X--------------------------------------------------------------------------------Contraste Diferencias +/- Límites--------------------------------------------------------------------------------0 - 1 *-0.48 0.199061 0 - 2 0.186667 0.199061 0 - 3 *-1.77667 0.199061 0 - 4 -0.123333 0.199061 1 - 2 *0.666667 0.199061 1 - 3 *-1.29667 0.199061 1 - 4 *0.356667 0.199061 2 - 3 *-1.96333 0.199061 2 - 4 *-0.31 0.199061 3 - 4 *1.65333 0.199061 --------------------------------------------------------------------------------* indica una diferencia significativa.
Table 8.2.32: a* value after PEF and thermal treatment.
a value by Treatment
--------------------------------------------------------------------------------Método: 95.0 porcentaje HSD de TukeyTreatment Frec. Media Grupos homogéneos--------------------------------------------------------------------------------Thermal 3 -0.37 X PEF 3 0.806667 X Blank 3 1.85 X--------------------------------------------------------------------------------Contraste Diferencias +/- Límites--------------------------------------------------------------------------------Blank - PEF *1.04333 0.10952 Blank - Thermal *2.22 0.10952 PEF - Thermal *1.17667 0.10952 --------------------------------------------------------------------------------* indica una diferencia significativa.
Table 8.2.33: a* value during the storage of PEF, thermal and untreated
sample.
a value by Week PEF sample--------------------------------------------------------------------------------Método: 95.0 porcentaje HSD de TukeyWeek Frec. Media Grupos homogéneos--------------------------------------------------------------------------------2 3 0.43 X 1 3 0.47 XX 0 3 0.586667 XX3 3 0.62 X4 3 0.696667 X--------------------------------------------------------------------------------Contraste Diferencias +/- Límites--------------------------------------------------------------------------------0 - 1 0.116667 0.127001 0 - 2 *0.156667 0.127001 0 - 3 -0.0333333 0.127001 0 - 4 -0.11 0.127001 1 - 2 0.04 0.127001 1 - 3 *-0.15 0.127001 1 - 4 *-0.226667 0.127001 2 - 3 *-0.19 0.127001 2 - 4 *-0.266667 0.127001 3 - 4 -0.0766667 0.127001 --------------------------------------------------------------------------------* indica una diferencia significativa.

ANNEXES
218
a value by Week Thermal sample--------------------------------------------------------------------------------Método: 95.0 porcentaje HSD de TukeyWeek Frec. Media Grupos homogéneos--------------------------------------------------------------------------------2 3 -0.333333 X4 3 -0.33 X3 3 -0.316667 X1 3 -0.306667 X0 3 -0.24 X--------------------------------------------------------------------------------Contraste Diferencias +/- Límites--------------------------------------------------------------------------------0 - 1 0.0666667 0.0991061 0 - 2 0.0933333 0.0991061 0 - 3 0.0766667 0.0991061 0 - 4 0.09 0.0991061 1 - 2 0.0266667 0.0991061 1 - 3 0.01 0.0991061 1 - 4 0.0233333 0.0991061 2 - 3 -0.0166667 0.0991061 2 - 4 -0.00333333 0.0991061 3 - 4 0.0133333 0.0991061 --------------------------------------------------------------------------------* indica una diferencia significativa.
a value by Week Untreated sample
--------------------------------------------------------------------------------Método: 95.0 porcentaje HSD de TukeyWeek Frec. Media Grupos homogéneos--------------------------------------------------------------------------------1 3 1.74333 X 3 3 1.77667 XX 2 3 1.81 XX 0 3 1.85 X 4 3 2.04333 X--------------------------------------------------------------------------------Contraste Diferencias +/- Límites--------------------------------------------------------------------------------0 - 1 *0.106667 0.0760109 0 - 2 0.04 0.0760109 0 - 3 0.0733333 0.0760109 0 - 4 *-0.193333 0.0760109 1 - 2 -0.0666667 0.0760109 1 - 3 -0.0333333 0.0760109 1 - 4 *-0.3 0.0760109 2 - 3 0.0333333 0.0760109 2 - 4 *-0.233333 0.0760109 3 - 4 *-0.266667 0.0760109 --------------------------------------------------------------------------------* indica una diferencia significativa.
Table 8.2.34: b* value after PEF and thermal treatment.
b value by Treatment
--------------------------------------------------------------------------------Método: 95.0 porcentaje HSD de TukeyTreatment Frec. Media Grupos homogéneos--------------------------------------------------------------------------------Thermal 3 23.97 X PEF 3 27.8633 X Blank 3 38.8233 X--------------------------------------------------------------------------------Contraste Diferencias +/- Límites--------------------------------------------------------------------------------Blank - PEF *10.96 0.154885 Blank - Thermal *14.8533 0.154885 PEF - Thermal *3.89333 0.154885 --------------------------------------------------------------------------------* indica una diferencia significativa.

ANNEXES
219
Table 8.2.35: b* value during the storage of PEF, thermal and untreated
sample. b value by Week PEF sample
--------------------------------------------------------------------------------Método: 95.0 porcentaje HSD de TukeyWeek Frec. Media Grupos homogéneos--------------------------------------------------------------------------------3 3 25.8067 X 1 3 26.4267 X 4 3 26.8633 X 2 3 27.4767 X 0 3 27.8633 X--------------------------------------------------------------------------------Contraste Diferencias +/- Límites--------------------------------------------------------------------------------0 - 1 *1.43667 0.246206 0 - 2 *0.386667 0.246206 0 - 3 *2.05667 0.246206 0 - 4 *1.0 0.246206 1 - 2 *-1.05 0.246206 1 - 3 *0.62 0.246206 1 - 4 *-0.436667 0.246206 2 - 3 *1.67 0.246206 2 - 4 *0.613333 0.246206 3 - 4 *-1.05667 0.246206 --------------------------------------------------------------------------------* indica una diferencia significativa.
b value by Week Thermal sample
--------------------------------------------------------------------------------Método: 95.0 porcentaje HSD de TukeyWeek Frec. Media Grupos homogéneos--------------------------------------------------------------------------------3 3 23.2367 X 0 3 23.96 X 1 3 24.2 XX 2 3 24.51 X 4 3 26.4867 X--------------------------------------------------------------------------------Contraste Diferencias +/- Límites--------------------------------------------------------------------------------0 - 1 -0.24 0.332991 0 - 2 *-0.55 0.332991 0 - 3 *0.723333 0.332991 0 - 4 *-2.52667 0.332991 1 - 2 -0.31 0.332991 1 - 3 *0.963333 0.332991 1 - 4 *-2.28667 0.332991 2 - 3 *1.27333 0.332991 2 - 4 *-1.97667 0.332991 3 - 4 *-3.25 0.332991 --------------------------------------------------------------------------------* indica una diferencia significativa.
b value by Week Untreated sample--------------------------------------------------------------------------------Método: 95.0 porcentaje HSD de TukeyWeek Frec. Media Grupos homogéneos--------------------------------------------------------------------------------3 3 35.5667 X 4 3 37.8033 X 1 3 37.9067 X 0 3 38.8233 X 2 3 39.28 X--------------------------------------------------------------------------------Contraste Diferencias +/- Límites--------------------------------------------------------------------------------0 - 1 *0.916667 0.410975 0 - 2 *-0.456667 0.410975 0 - 3 *3.25667 0.410975 0 - 4 *1.02 0.410975 1 - 2 *-1.37333 0.410975 1 - 3 *2.34 0.410975 1 - 4 0.103333 0.410975 2 - 3 *3.71333 0.410975 2 - 4 *1.47667 0.410975 3 - 4 *-2.23667 0.410975 --------------------------------------------------------------------------------* indica una diferencia significativa.
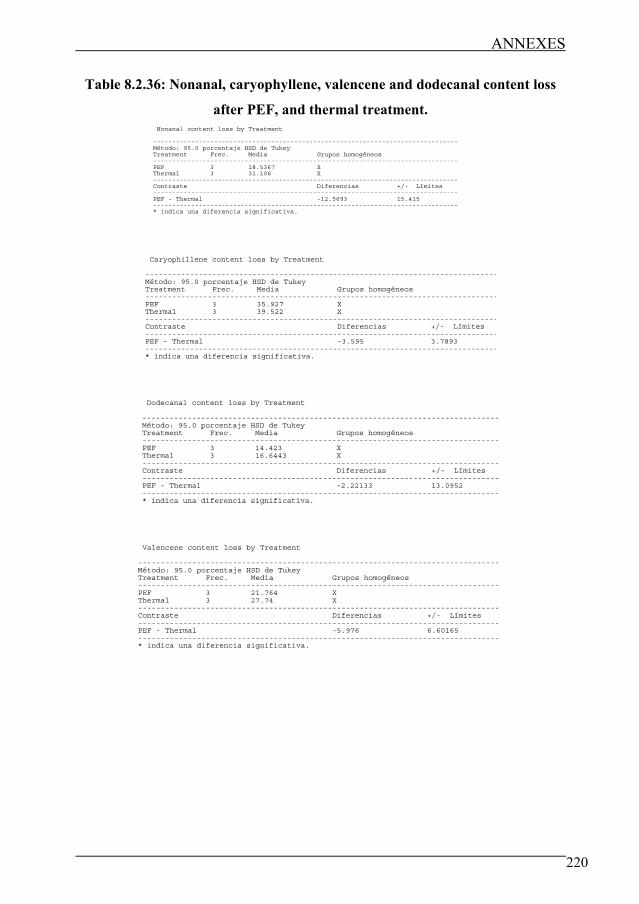
ANNEXES
220
Table 8.2.36: Nonanal, caryophyllene, valencene and dodecanal content loss
after PEF, and thermal treatment. Nonanal content loss by Treatment
--------------------------------------------------------------------------------Método: 95.0 porcentaje HSD de TukeyTreatment Frec. Media Grupos homogéneos--------------------------------------------------------------------------------PEF 3 18.5367 XThermal 3 31.106 X--------------------------------------------------------------------------------Contraste Diferencias +/- Límites--------------------------------------------------------------------------------PEF - Thermal -12.5693 15.415 --------------------------------------------------------------------------------* indica una diferencia significativa.
Caryophillene content loss by Treatment
-------------------------------------------------------------------------------Método: 95.0 porcentaje HSD de TukeyTreatment Frec. Media Grupos homogéneos-------------------------------------------------------------------------------PEF 3 35.927 XThermal 3 39.522 X-------------------------------------------------------------------------------Contraste Diferencias +/- Límites-------------------------------------------------------------------------------PEF - Thermal -3.595 3.7893 -------------------------------------------------------------------------------* indica una diferencia significativa.
Dodecanal content loss by Treatment
-------------------------------------------------------------------------------Método: 95.0 porcentaje HSD de TukeyTreatment Frec. Media Grupos homogéneos-------------------------------------------------------------------------------PEF 3 14.423 XThermal 3 16.6443 X-------------------------------------------------------------------------------Contraste Diferencias +/- Límites-------------------------------------------------------------------------------PEF - Thermal -2.22133 13.0952 -------------------------------------------------------------------------------* indica una diferencia significativa.
Valencene content loss by Treatment
--------------------------------------------------------------------------------Método: 95.0 porcentaje HSD de TukeyTreatment Frec. Media Grupos homogéneos--------------------------------------------------------------------------------PEF 3 21.764 XThermal 3 27.74 X--------------------------------------------------------------------------------Contraste Diferencias +/- Límites--------------------------------------------------------------------------------PEF - Thermal -5.976 6.60165 --------------------------------------------------------------------------------* indica una diferencia significativa.


