dmd q1 ir-presentation-2016.pdf
TRANSCRIPT
Company Overview
Q1 2016
This document and any related oral presentation does not constitute an offer or invitation to subscribe for, purchase or otherwise acquire any debt or equity securities of Demand Media, Inc. (“Demand Media” or the “Company”) and nothing contained herein or in the related oral presentation shall form the basis of any contract or commitment.
The distribution of this document and any related oral presentation in certain jurisdictions may be restricted by law and persons into whose possession this document or any related oral presentation comes should inform themselves about, and observe, any such restriction. Any failure to comply with these restrictions may constitute a violation of the laws of any such other jurisdiction.
The information contained herein does not constitute investment, legal, accounting, regulatory, taxation or other advice and the information does not take into account your investment objectives or legal, accounting, regulatory, taxation or financial situation or particular needs. You are solely responsible for forming your own opinions and conclusions on such matters and the market and for making your own independent assessment of the information. You are solely responsible for seeking independent professional advice in relation to the information and any action taken on the basis of the information.
This presentation contains certain forward-looking statements. All statements other than statements of historical facts contained in this presentation, including statements regarding the Company’s future results of operations and financial position, business strategy, plans and objectives for future operations, are forward-looking statements. You should not rely upon forward-looking statements as guarantees of future performance. The Company has based these forward-looking statements largely on its current expectations and projections about future events and financial trends that it believes may affect its financial condition, results of operations, business strategy, short-term and long-term business operations and objectives, and financial needs. These forward-looking statements are subject to a number of risks, uncertainties and assumptions that may cause actual results to differ materially from those contained in any forward-looking statements, including those described under the heading “Risk Factors” in the Company’s periodic reports filed from time to time with the Securities and Exchange Commission (the “SEC”), which are incorporated herein by reference. Moreover, the Company operates in a very competitive and rapidly changing environment and new risks emerge from time to time. In light of these risks, uncertainties and assumptions, the forward-looking statements included in this presentation may not occur and actual results could differ materially and adversely from those anticipated or implied in the forward-looking statements. Except as required by law, the Company undertakes no obligation to update any forward-looking statements for any reason after the date of this presentation to conform these statements to actual results or to changes in the Company’s expectations.
The Company is publicly traded on the New York Stock Exchange under the ticker symbol “DMD” and is a registrant under the rules and regulations promulgated by the SEC. Before evaluating whether you should consider an investment in the Company’s securities, you should read all of the disclosures set forth in the Company’s annual, quarterly and periodic reports filed with the SEC, including the disclosures under the headings “Risk Factors” and “Management’s Discussion and Analysis of Financial Condition and Results of Operations.” The Company’s SEC filings can be found at www.sec.gov and ir.demandmedia.com.
2
Disclaimers

3
We build platforms for communities of creators to reach passionate audiences in large and growing lifestyle categories
Our Mission
4
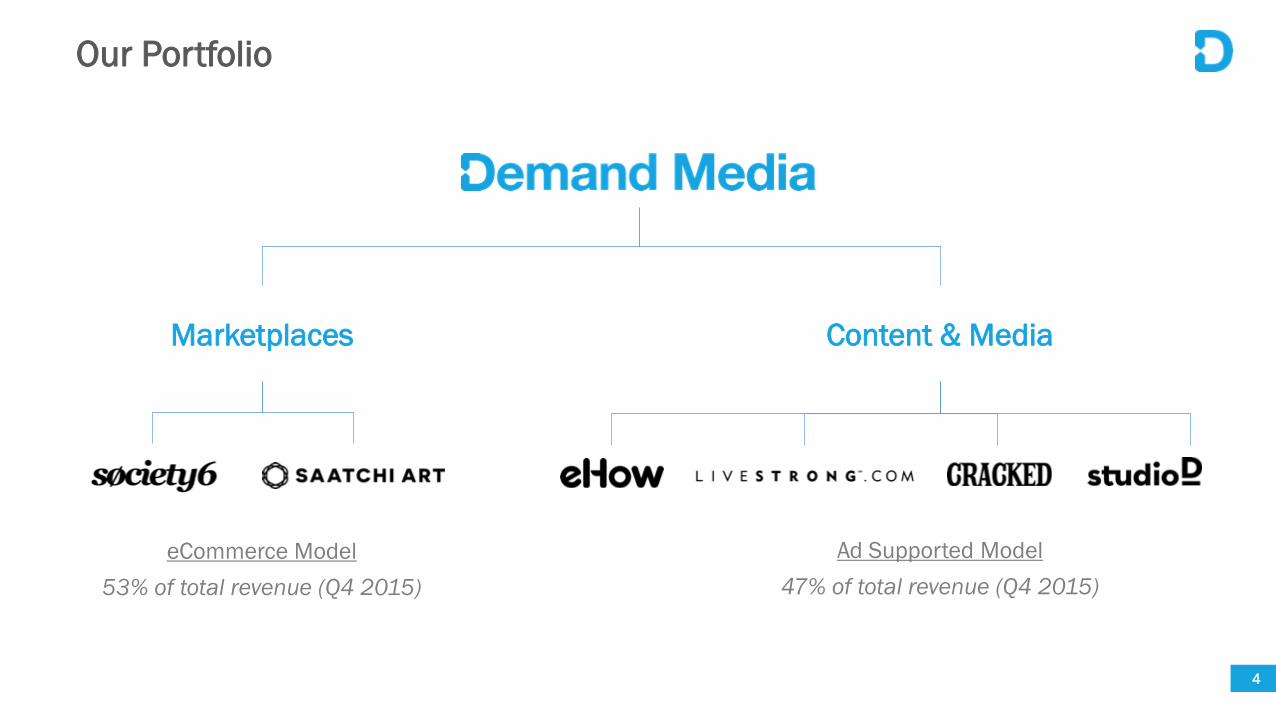
Our Portfolio
Marketplaces Content & Media
eCommerce Model 53% of total revenue (Q4 2015)
Ad Supported Model 47% of total revenue (Q4 2015)

Approximately 59M (1)
Total Unique Monthly Visitors
5
Approximately $19M (3)
Paid to Creators in 2015 Approximately 220,000 (2)
Creators Across Platforms
$126M FY2015 Diversified Revenue Mix Clean Balance Sheet
Scaling the Operation Employees
Key Statistics
(1) Total unique visitors in the U.S. reached by Demand Media properties in January 2016 (Source: Jan. 2016 U.S. comScore) (2) Total creators across platforms: current number of active creators for Society6, Saatchi Art and StudioD 2015; based on internal data (3) Total paid to creators: full year 2015 for Society6, Saatchi Art and StudioD; based on internal data
$0M
$38M
–
$10M
$20M
$30M
$40M
Debt Cash
446
347
–
100
200
300
400
500
Q1'14 Q2'14 Q3'14 Q4'14 Q1'15 Q2'15 Q3'15 Q4'15
As of 12/31/15

24% 27%
32% 35%
39%
44% 45% 46%
41% 45%
50% 53%
55%
59% 60% 60%
42% 44%
48% 50%
53% 53%
49% 49%
Q1'14 Q2'14 Q3'14 Q4'14 Q1'15 Q2'15 Q3'15 Q4'15
eHowLivestrongCracked
6
Mobile Evolution
Source: Demand Media internal data
Mobile visits as a percent of total visits

109.9 106.3 101.2 99.0 103.7 111.4 104.0 106.0
6.2 8.1 5.8 4.8
6.9 6.9
6.7 5.6
14.1 16.4 20.9 33.0
53.3 43.8 48.0 51.1
Q1'14 Q2'14 Q3'14 Q4'14 Q1'15 Q2'15 Q3'15 Q4'15
CrackedLivestrongeHow
7
Video Views (in millions)
Source: Demand Media internal data, YouTube and Facebook
+19% Y/Y

8
Marketplaces

Society6 provides artists with an online commerce platform to feature and sell their original designs on art prints, phone and tablet cases, t-shirts, throw pillows and other consumer and home décor products.
Society6 Saatchi Art is an online art gallery featuring a wide selection of original paintings, drawings, sculptures and photography that provides a global community of artists a curated environment in which to exhibit and sell their work directly to consumers around the world.
Saatchi Art
9
Marketplaces

10
Key Marketplace Metrics (1)
Revenue ($M) Revenue Per Transaction(2)
Total Transactions(3)
$18.3
–
$5.0
$10.0
$15.0
$20.0
Q1'14 Q2'14 Q3'14 Q4'14 Q1'15 Q2'15 Q3'15 Q4'15
+28% Y/Y
355K
0
50
100
150
200
250
300
350
400
Q1'14 Q2'14 Q3'14 Q4'14 Q1'15 Q2'15 Q3'15 Q4'15
$51.61
$0.00
$15.00
$30.00
$45.00
$60.00
$75.00
Q1'14 Q2'14 Q3'14 Q4'14 Q1'15 Q2'15 Q3'15 Q4'15
Marketplaces Revenue as a Percent of Total Revenue
33%
53%
10%
20%
30%
40%
50%
60%
Q1'14 Q2'14 Q3'14 Q4'14 Q1'15 Q2'15 Q3'15 Q4'15(1) Saatchi Art was acquired in August 2014 (2) Number of transactions is defined as the total number of successfully completed Marketplaces transactions during the applicable period (3) Average revenue per transaction is calculated by dividing Marketplaces revenue for a period by the number of transactions in that period

11
Society6 Marketplace platform empowering artists to make their designs available for sale on a variety of products.
Business Model
• Original designs from a global community of over 180k artists
• Over 2.7m original designs
• Print-On-Demand for 30+ Products
• Third-party vendors produce, pack and ship directly to customers
• Artist earns a royalty on every product sold
Key Metrics
• 570k new customers / 800k total customers in 2015
• Visits up 14% y/y; transactions up 29% y/y in 2015
• Over 700k social followers (1)
• Nearly $50m in total transaction value in FY2015, up 38% y/y
(1) Source: Facebook, Instagram, Pinterest, Twitter and Google+, Jan. 2016
12
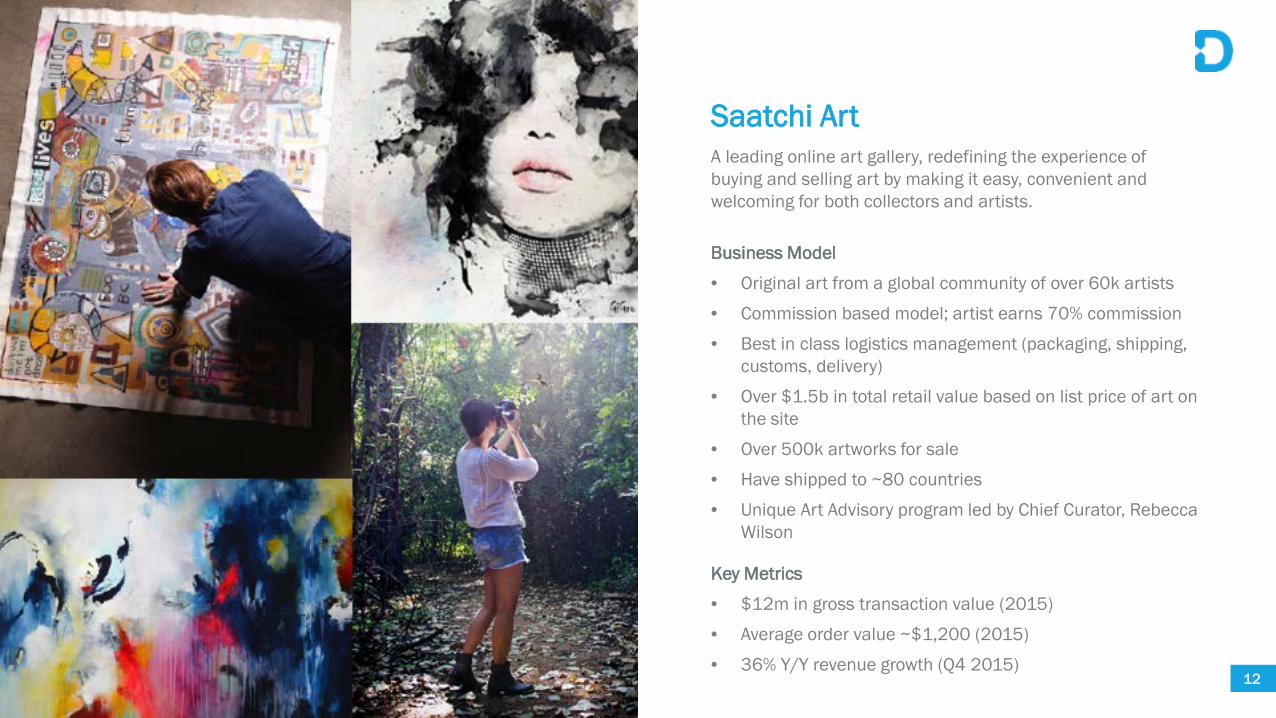
Saatchi Art A leading online art gallery, redefining the experience of buying and selling art by making it easy, convenient and welcoming for both collectors and artists.
Business Model
• Original art from a global community of over 60k artists
• Commission based model; artist earns 70% commission
• Best in class logistics management (packaging, shipping, customs, delivery)
• Over $1.5b in total retail value based on list price of art on the site
• Over 500k artworks for sale
• Have shipped to ~80 countries
• Unique Art Advisory program led by Chief Curator, Rebecca Wilson
Key Metrics
• $12m in gross transaction value (2015)
• Average order value ~$1,200 (2015)
• 36% Y/Y revenue growth (Q4 2015)

13
Content & Media

Whether it is to fix, build, create or learn, eHow gives practical and creative solutions to life’s everyday challenges. Over 700k DIY titles and ~200k videos with a focus in six core lifestyle categories: Home, Garden, Food, Crafts, Tech, Finance.
eHow
14
Content & Media
Cracked is a four-time Webby Award winning humor site filled with articles and videos providing laugh-out-loud comedy via incredible true stories and mind-expanding original ideas.
Cracked

The premier site for healthy living. Over 100k food, fitness and health articles from over 150K experts and influencers. 1 in 3 US adults search online for health related content every month (comScore, Jan 2016).
LIVEstrong.com
15
Content & Media
studioD is an innovative content marketing studio connecting brands to audiences by combining proven insights and authentic content. studioD creates custom content informed by a data-driven strategy, ensuring brands will reach and engage their audience through every stage in their journey.
studioD
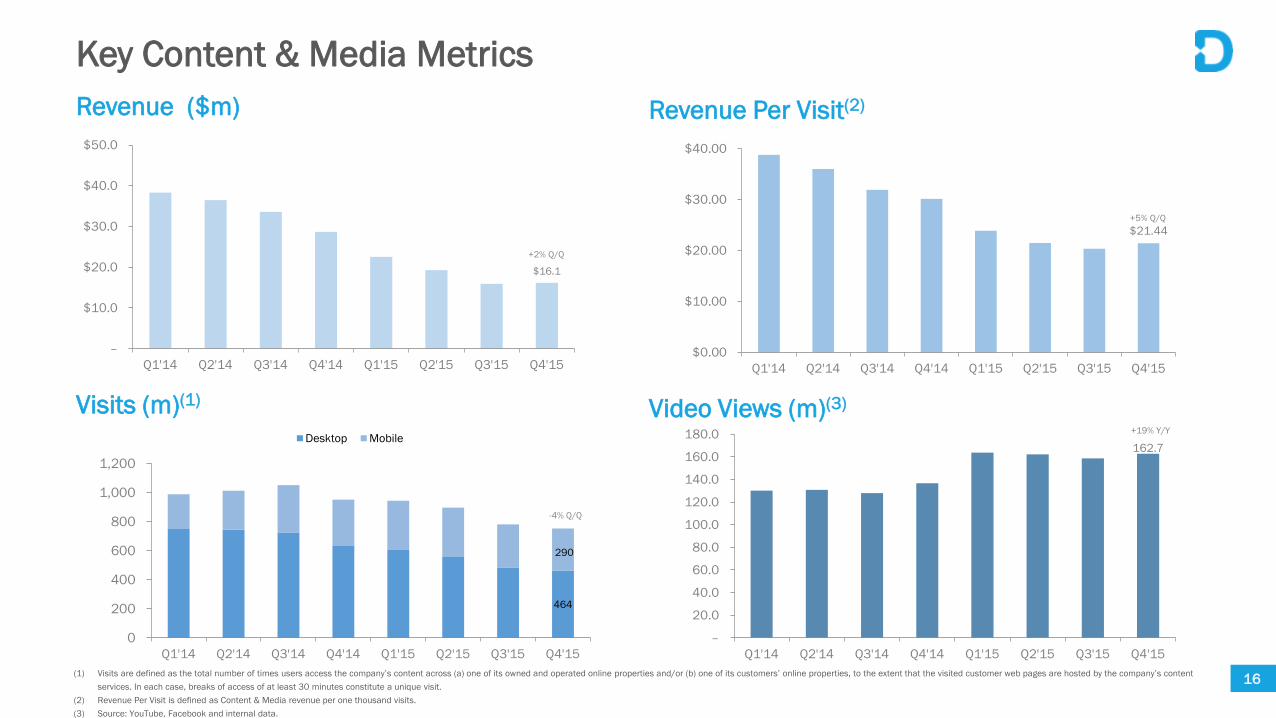
$21.44
$0.00
$10.00
$20.00
$30.00
$40.00
Q1'14 Q2'14 Q3'14 Q4'14 Q1'15 Q2'15 Q3'15 Q4'15
+5% Q/Q
162.7
–
20.0
40.0
60.0
80.0
100.0
120.0
140.0
160.0
180.0
Q1'14 Q2'14 Q3'14 Q4'14 Q1'15 Q2'15 Q3'15 Q4'15
+19% Y/Y
16
Key Content & Media Metrics Revenue Per Visit(2)
Video Views (m)(3)
Revenue ($m)
Visits (m)(1)
$16.1
–
$10.0
$20.0
$30.0
$40.0
$50.0
Q1'14 Q2'14 Q3'14 Q4'14 Q1'15 Q2'15 Q3'15 Q4'15
+2% Q/Q
464
290
0
200
400
600
800
1,000
1,200
Q1'14 Q2'14 Q3'14 Q4'14 Q1'15 Q2'15 Q3'15 Q4'15
Desktop Mobile
-4% Q/Q
(1) Visits are defined as the total number of times users access the company’s content across (a) one of its owned and operated online properties and/or (b) one of its customers’ online properties, to the extent that the visited customer web pages are hosted by the company’s content services. In each case, breaks of access of at least 30 minutes constitute a unique visit.
(2) Revenue Per Visit is defined as Content & Media revenue per one thousand visits. (3) Source: YouTube, Facebook and internal data.
17
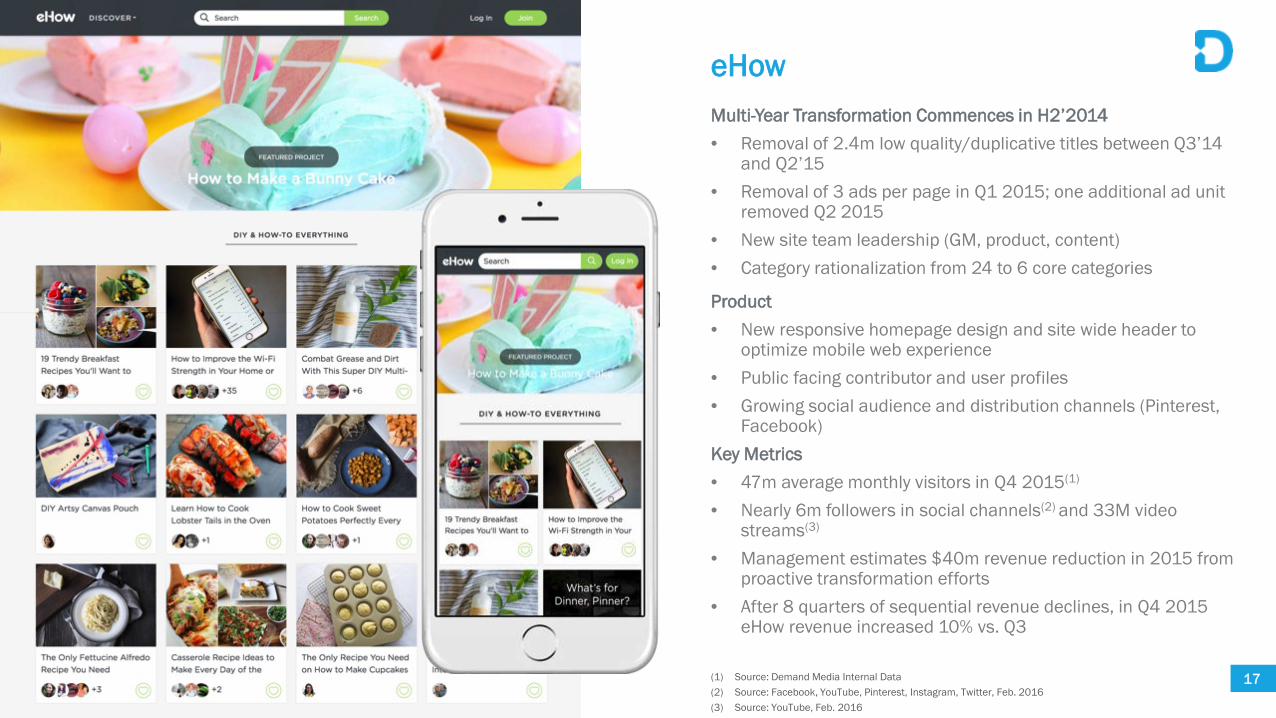
eHow Multi-Year Transformation Commences in H2’2014 • Removal of 2.4m low quality/duplicative titles between Q3’14
and Q2’15 • Removal of 3 ads per page in Q1 2015; one additional ad unit
removed Q2 2015 • New site team leadership (GM, product, content) • Category rationalization from 24 to 6 core categories
Product • New responsive homepage design and site wide header to
optimize mobile web experience • Public facing contributor and user profiles • Growing social audience and distribution channels (Pinterest,
Facebook) Key Metrics • 47m average monthly visitors in Q4 2015(1)
• Nearly 6m followers in social channels(2) and 33M video streams(3)
• Management estimates $40m revenue reduction in 2015 from proactive transformation efforts
• After 8 quarters of sequential revenue declines, in Q4 2015 eHow revenue increased 10% vs. Q3
(1) Source: Demand Media Internal Data (2) Source: Facebook, YouTube, Pinterest, Instagram, Twitter, Feb. 2016 (3) Source: YouTube, Feb. 2016
18
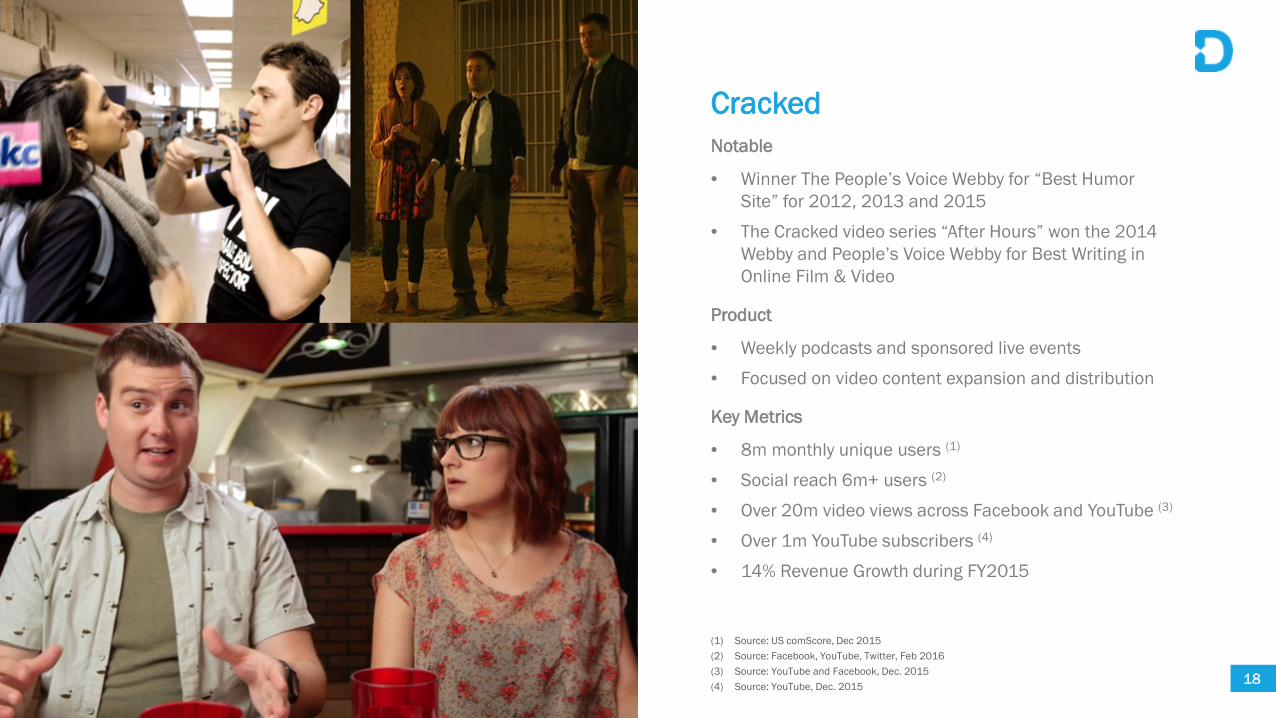
Cracked Notable
• Winner The People’s Voice Webby for “Best Humor Site” for 2012, 2013 and 2015
• The Cracked video series “After Hours” won the 2014 Webby and People’s Voice Webby for Best Writing in Online Film & Video
Product
• Weekly podcasts and sponsored live events
• Focused on video content expansion and distribution
Key Metrics
• 8m monthly unique users (1)
• Social reach 6m+ users (2)
• Over 20m video views across Facebook and YouTube (3)
• Over 1m YouTube subscribers (4)
• 14% Revenue Growth during FY2015
(1) Source: US comScore, Dec 2015 (2) Source: Facebook, YouTube, Twitter, Feb 2016 (3) Source: YouTube and Facebook, Dec. 2015 (4) Source: YouTube, Dec. 2015

19
LIVEstrong.com Transformation Facts
• 300k articles removed Q4’14
• Reduced ad density: 3 Ads removed from every page (2014)
Product
• Q4 2015 launched single page article with infinite scroll; +70% session duration and +80% unique page views
• Redesigned home page; new and improved legacy content more easily shareable
Key Metrics
• 28m monthly unique users (1)
• Significant mobile audience growth +40% FY 2015 (2)
• 5m total app downloads with 300k monthly active users (3)
• 3m average monthly video streams (4)
• Q4 2015 Revenue growth +14% vs. Q3
(1) Source: LIVEstrong / eHow Health, US comScore Jan. 2016 (2) Source: Demand Media Internal Data (3) Source: Demand Media Internal Data (4) Source: YouTube, Jan. 2016
20
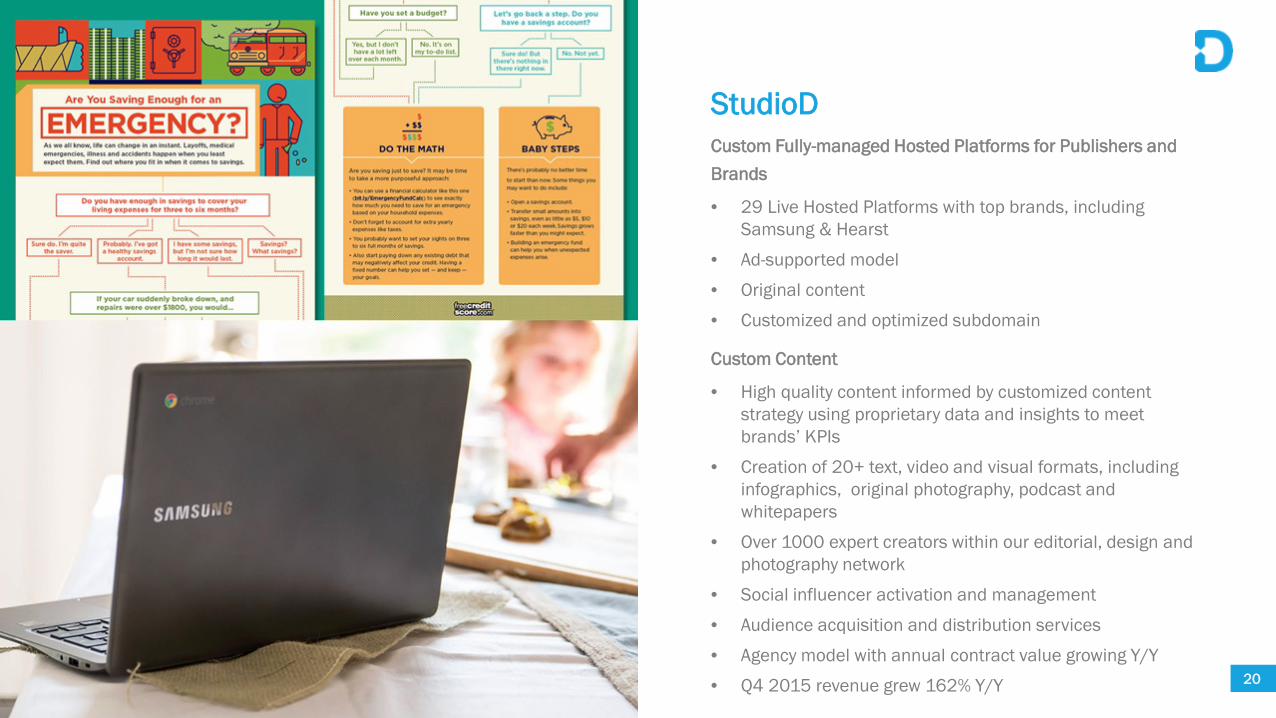
StudioD
Custom Fully-managed Hosted Platforms for Publishers and Brands
• 29 Live Hosted Platforms with top brands, including Samsung & Hearst
• Ad-supported model
• Original content
• Customized and optimized subdomain
Custom Content
• High quality content informed by customized content strategy using proprietary data and insights to meet brands’ KPIs
• Creation of 20+ text, video and visual formats, including infographics, original photography, podcast and whitepapers
• Over 1000 expert creators within our editorial, design and photography network
• Social influencer activation and management
• Audience acquisition and distribution services
• Agency model with annual contract value growing Y/Y
• Q4 2015 revenue grew 162% Y/Y

Financials
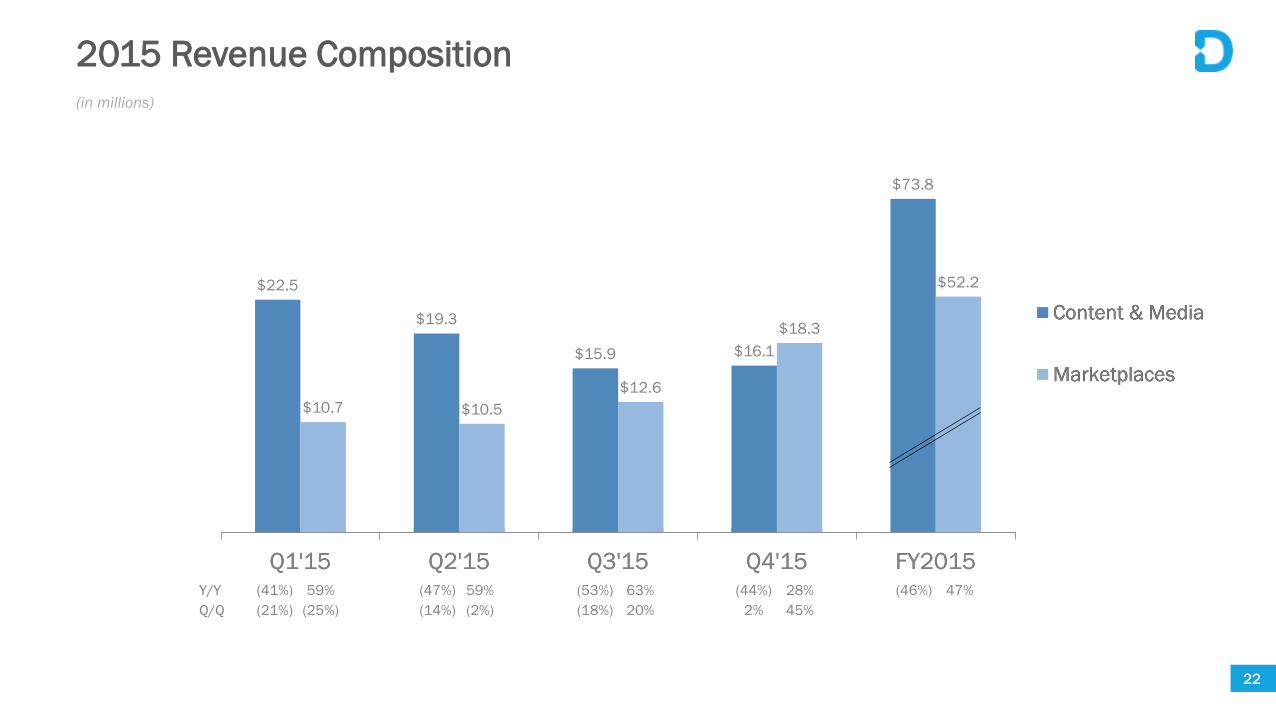
$22.5
$19.3
$15.9 $16.1
$10.7 $10.5 $12.6
$18.3
Q1'15 Q2'15 Q3'15 Q4'15 FY2015
Content & Media
Marketplaces
$73.8
$52.2
Q1'15 Q2'15 Q3'15 Q4'15 FY2015
Content & Media
Marketplaces
22
2015 Revenue Composition (in millions)
Y/Y (41%) 59% (47%) 59% (53%) 63% (44%) 28% (46%) 47% Q/Q (21%) (25%) (14%) (2%) (18%) 20% 2% 45%

Assets Liabilities
Cash & Cash Equivalents $ 38.6 Accounts Payable, Accrued Expenses, and Other Current Liabilities $ 17.1
Other Current Assets 15.5 Deferred Revenue 2.9
Property and Equipment, Net 14.6 Non-current Liabilities 2.3
Other Long Term Assets (1) 32.8 Stockholders’ Equity 79.1
Total Assets $ 101.5 Total Liabilities and Stockholders’ Equity $ 101.5
23
Balance Sheet Summary (in millions)
As of December 31, 2015
(1) Includes intangible assets, net, goodwill and other assets.

24
Selected Recent Valuation Comparables for DMD Businesses
Art and Design Marketplace
Humor
Content Publisher DIY
Content Marketing Platform
Read Article
Read Article
Read Article
Read Article
Read Article
ASX IPO - ~$300m Enterprise Value
Univision pays $27m for 40% of The Onion
Scripps Interactive invests $50m in Refinery 29
Scribble Live acquires Visually
News Cred raises $42m
25
Executive Leadership
Rachel Glaser Chief Financial Officer
Brian Pike Chief Operating Officer & Chief Technology Officer
Rachel Glaser joined Demand Media as the Chief Financial Officer. With nearly three decades of senior operations and financial experience, she most recently served as CFO at Move, Inc, parent of Realtor.com, where she helped lead the company through its successful transformation and sale to News Corporation. Prior to Move, she was Chief Operating and Financial Officer at MyLife.com. Before joining MyLife, Glaser was Senior Vice President, Finance at Yahoo! and spent many years at The Walt Disney Company in various finance, operations and technology roles.
Rachel received her undergraduate degree from University of California, Berkeley and earned her MBA at University of Southern California – Marshall School of Business.
Brian Pike joined Demand Media in 2014 and he currently serves as its Chief Operating Officer and Chief Technology Officer. Prior to Demand Media, Brian was CTO at Rubicon Project, where he led the engineering organization through rapid growth and a successful IPO. Prior to joining Rubicon, Brian was CTO at Ticketmaster where he led efforts to transform an established retailer and service company into a modern ecommerce retailer. Brian has an undergraduate degree from Stanford University and an MBA from the Anderson School at UCLA.
Sean serves as Chief Executive Officer and a member of the board of directors of Demand Media. Sean was previously the CEO of Saatchi Art, which Demand Media acquired in August 2014, and the President and CEO of Ticketmaster, where he also served on the board of directors. Sean held positions of increasing responsibility during his tenure at Ticketmaster, including EVP, Technology and Chief Operating Officer. Sean has also served as an Entrepreneur in Residence at Mayfield Fund and he began his executive experience as EVP, Technology at Citysearch.
Sean sits on several private company boards of directors, including Eventbrite and TuneIn. Sean is also actively involved in non-profit work with CoachArt and the Pat Tillman Foundation.
Sean received his bachelor’s degree from the University of South Carolina and attended graduate school at Boston University and the University of South Carolina.
Sean Moriarty Chief Executive Officer

26
Executive Leadership
Daniel Weinrot EVP, Legal & General Counsel
Daniel Weinrot is the EVP, Legal & General Counsel. He joined Demand Media in 2010 and has held several positions within Demand’s legal department before being elevated to General Counsel. Daniel was integral in managing our initial public offering in January 2011, and the tax-free spin-off of our domain name services business in August 2014. In his current role, Daniel oversees and manages Demand Media’s legal and risk management functions, which includes public company compliance, mergers & acquisitions, litigation and insurance, among others.
Prior to joining Demand Media, Daniel was most recently VP & Deputy General Counsel at Las Vegas Sands Corp., the leading owner and developer of integrated casino resort properties located in the United States and Asia. Prior to that, Daniel was a corporate associate at Latham & Watkins LLP, one of the leading international law firms based in Los Angeles. Daniel holds a JD from UCLA and a bachelor’s degree from U.C. Berkeley.
Tawn Albright is the Executive Vice President of Corporate Development for Demand Media. He joined the company in 2015. Prior to Demand Media, Albright was CEO and founding partner of the award-winning digital marketing agency, Rockhouse Partners. Following the sale of Rockhouse to Etix, Albright served as Executive Vice President for Etix, leading the integration of the two companies. Albright has more than twenty years of experience managing growth initiatives for companies that include Ticketmaster/IAC, The Coca-Cola Company and Cox Communications. He is trilingual (English, Spanish, French), enjoys backpacking, ultimate frisbee, big skies and music.
He’s a graduate from the University of Arizona with a double degree in Finance and Entrepreneurship and earned his MBA from Thunderbird School of Global Management.
Tawn Albright EVP, Corporate Development
Jill Angel EVP, People
Jill Angel joined Demand Media in 2014, bringing with her more than 15 years of leadership experience for fast-growing companies including large organizations and startups. Prior to working at Demand, Jill served as VP Operations at Saatchi Art where she headed up people management, logistics, fulfillment, and customer service. Before joining Saatchi Art, Jill built and led teams at Cocodot, Swirl by DailyCandy, and GSI Commerce.