diffuse water emissions in e-prtr - europa · diffuse water emissions in e-prtr - project report 1...
TRANSCRIPT

Diffuse water emissions in E-PRTR Project report

Diffuse water emissions in E-PRTR Project report
1205118-000 © Deltares, 2013
J. van den Roovaart (Deltares) N. van Duijnhoven (Deltares) M. Knecht (IER) J. Theloke (IER) P. Coenen (TNO) H. ten Broeke (TNO)


Title Diffuse water emissions in E-PRTR Client European Commision
Project 1205118-000
Reference 1205118-000-ZWS-0016
Pages 102
Diffuse water emissions in E-PRTR - Project report
Keywords Diffuse water emissions, emission maps, E-PRTR, emission source, Priority Substances, Water Framework Directive Summary The E-PRTR Regulation No 166/2006 established a European Pollutant Release and Transfer Register (E-PRTR). This database must include releases of pollutants from diffuse sources where available. Article 8 of the Regulation establishes that the Commission will include data on releases from diffuse sources which has already been reported by Member States, and will disaggregate the information to an adequate geographical level whilst including information on the methodology used. When no data on releases from diffuse sources is available, the Commission is required to take actions to initiate reporting on diffuse sources. Therefore the European Commission launched this project. In this project available data on diffuse emissions to water has been collected, estimation methods to quantify diffuse emissions have been developed and forty maps have been prepared, covering the EU Member States and the EFTA countries on a River Basin District sub-unit scale for a selection of key sources and substances. The maps will be integrated in the E-PRTR website (http://prtr.ec.europa.eu/) by the European Commission. This document contains the project results and the emission source fact sheets. In a separate dissemination document, the maps, map descriptions and the fact sheets are put together as a complete background document. References Roovaart, J. van den, N. van Duijnhoven, M. Knecht, J. Theloke, P. Coenen, H. ten Broeke, 2013. Diffuse water emissions in E-PRTR, Project report. Report 1205118-000-ZWS-0016, Deltares. Subcontracting: TNO Institute for Energy Economics and the
rational use of Energy, University of Stuttgart

1205118-000-ZWS-0016, 2 July 2013, final
Diffuse water emissions in E-PRTR - Project report
i
Contents
1 Background and objectives 1 1.1 Background of the project 1 1.2 Description of the objectives of the project 2 1.3 The E-PRTR regulation 2 1.4 Definition of “Diffuse sources” 3 1.5 Requirements and limitations 3
2 Selection of relevant source substance combinations 5 2.1 General scheme for diffuse sources 5 2.2 Availability of data sets on diffuse emissions to surface water 6 2.3 Overview of substances 10 2.4 Selection of sources 11 2.5 Questionnaire reactions 12 2.6 Feedback from the Member States Workshop 14 2.7 Final selection of source-substance combinations 15
3 Methodology 17 3.1 Methodology to compile consistent emission data sets 17 3.2 Compilation of proxy data sets to disaggregate diffuse emission sources 17 3.3 Products 20
3.3.1 Factsheets 20 3.3.2 Maps and metadata description 20 3.3.3 Dissemination document 21
4 Results 23 4.1 Comparing E-PRTR and non E-PRTR emissions 23 4.2 Key sources of diffuse emissions 23 4.3 Overview of Member State emissions 26 4.4 Maps per source-substance combination 29
5 Bottlenecks and recommendations for improvement 31 5.1 Major bottlenecks 31 5.2 Spatial allocation 31 5.3 Suggestions for improvement per source 34
6 Conclusions and outlook 39 6.1 Conclusions 39 6.2 Outlook 41
7 References 43
Appendices
A Questionnaire A-1
B Minutes of the workshop B-1

ii
1205118-000-ZWS-0016, 2 July 2013, final
Diffuse water emissions in E-PRTR - Project report
C Factsheets C-1 C.1 Agriculture C-1 C.2 Atmospheric deposition C-5 C.3 Inland navigation C-9 C.4 Un-connected households C-17 C.5 Road transport C-24 C.6 Urban Waste Water Treatment Plants not in E-PRTR C-32 C.7 Case study industry C-44

1205118-000-ZWS-0016, 2 July 2013, final
Diffuse water emissions in E-PRTR - Project report
1 van 102
1 Background and objectives
1.1 Background of the project The first river basin wide emission inventories for surface water originate from the 1990’s, years before the Water Framework Directive, WFD (EC, 2000) was established. It was the start of international development and harmonisation of methods to quantify emissions to surface water. A successful example is the method developed within the International Commission for the Protection of the Rhine (ICPR, 1999 and ICPR 2003). This river basin wide applicable method quantified both point and diffuse sources of a number of substances and sources or pathways. In preparation for the 5th North Sea Minister Conference, guidelines were developed for the harmonisation of the reporting procedures for hazardous substances (SFT, 2001) and nutrients (SFT, 2000) by an international study group. In the final 5th North Sea Minister Conference report (NSC, 2002), however, only a few countries succeeded in reporting on diffuse sources. Comparison of national emission inventories is hampered by differences in definitions (sources, pathways), methods, reporting timeframes, formats and thresholds. Therefore it is complicated and time consuming for Member States to submit the right information requested in an international inventory. For the Commission this often results in reports which are incomplete, inconsistent and incomparable on an EU scale. With the establishment of the WFD and the obligations in Article 5 of this Directive, the urgency to improve and extend the emission inventories was felt by Member States. The WFD urges Member States to collaborate closely on a river basin scale. Since the implementation of the WFD, the collection, exchange and harmonisation of emission data started. For successful international river basin management, comparable and consistent data on diffuse emissions are essential. Information on emissions is important for prioritising the most polluting sources and formulating adequate measures on the right scale to reduce the emissions and improve the water quality. Triggered by the Urban Waste Water Treatment Directive, UWWT (EC, 1991) and the European Pollutant and Transfer Register Regulation, E-PRTR (EC, 2006), an important step was made in reporting of emissions from point sources. Subsequently a major reduction of those emissions in the last 15 years was reported. Gradually, it became clear that for the remaining polluting substances, under which priority and priority hazardous substances, diffuse emissions are responsible for a significant part of the total load discharged to surface waters. Therefore a clear overview of all relevant sources and pathways of (potentially) hazardous substances was needed to be able to take adequate measures on the right level (local, regional, river basin, EU) to reduce or phase out the emissions. In recent years, a number of international activities were initiated, especially by the Commission and the EEA to stimulate and facilitate reporting on diffuse sources. Different joint research projects (e.g., Life+, Socopse, ScorePP) helped to collect large amounts of emission data and to exchange information on quantification methods and emission models across Europe. On a European scale, Working group E on Chemical Aspects of DG Environment recently finalised a ‘Priority Substances Emission Inventory Guidance’ (EC, 2012). In this Guidance document the knowledge on emission inventories of various Member

Diffuse water emissions in E-PRTR - Project report
1205118-000-ZWS-0016, 2 July 2013, final
2 van 102
States is used. In addition, the international river committees play an important and active role in data and information exchange. Altogether it seems a good moment to start this project and to make a step forward on an EU wide scale in the collection, comparison, quantification and harmonization of the emissions including diffuse sources to surface water. With the definition of possible measures to initiate reporting at EU level, a door will be opened to substantial improvements of the current inventories, reports and reporting obligations.
1.2 Description of the objectives of the project The objectives of this project are to: 1 Gather available data on diffuse releases to surface water with data sets available up to
2009 of the pollutants and sources for a selected set of source-substance combinations. 2 Propose alternative estimation methods where emission data are not available on the
European scale. 3 Develop a methodology to derive disaggregated spatial data to obtain geographical
information system layers. 4 Derive gridded emission map layers covering all EU27 Member States and the EFTA
countries (Switzerland, Liechtenstein, Norway and Iceland) for the selected sectors and pollutants with the highest resolution possible. For the E-PRTR site, River Basin District (RBD) maps will be used as the reporting format.
The final outcome of the project and, in particular, the GIS layers derived, will be integrated in the E-PRTR register. The task of this integration does not fall within the scope of this project.
To realize the above goals, available data and information has been gathered and analysed, methodologies have been developed for the disaggregation of reported data and for the quantification and spatial distribution of diffuse emissions. Protocols to initiate reporting of diffuse sources are proposed. For six sources methods are developed for the quantification of the emissions and for the source industry, a case study has been carried out. This results in seven factsheets, each describing one of the sources and in total forty maps for specific source-substance combinations. In this whole process, the recognition of the data and the acceptance of the quantification and regionalisation methodologies by the Member States are considered very important.
1.3 The E-PRTR regulation The E-PRTR Regulation (EC, 2006) established a European Pollutant Release and Transfer Register. This database must also include releases of pollutants from diffuse sources. Concerning these diffuse sources, Article 8 of the Regulation establishes that the Commission shall:
include in the database information on diffuse sources which has already been reported by the Member States;
disaggregate this information to an adequate geographical level and include information on the methodology used;
where no data exists, take measures to initiate reporting on diffuse sources. Because there is a legal obligation to produce data on diffuse water emissions and to inform the general public about this issue, the European Commission launched this project (call for tender ENV.C.3/SER/2011/0023).

1205118-000-ZWS-0016, 2 July 2013, final
Diffuse water emissions in E-PRTR - Project report
3 van 102
1.4 Definition of “Diffuse sources” Emissions from diffuse sources arise from various activities with no discrete source. For this project only diffuse sources are estimated. There are two exceptions:
Smaller Urban Waste Water Treatment Plants. Larger UWWTPs, above a certain capacity threshold value, have to report emissions to E-PRTR. Only a small fraction of treatment plants have therefore been incorporated in E-PRTR reports. For this project all the discharges from UWWTPs that are not covered in the E-PRTR reports, are considered as a diffuse source. In some cases, also discharges of the bigger UWWTPs (> 100.000 population equivalent) are missing in E-PRTR. These missing discharges are also considered as diffuse sources and quantified in this project.
Smaller industrial plants. Like the small UWWTPs mentioned above, the smaller industrial plants are also not reported in the E-PRTR. The smaller industries are more complex to estimate than the UWWTPs. Therefore a case study regarding a specific industrial sector is included in this project instead of a methodology to estimate industrial emissions.
1.5 Requirements and limitations For this project two requirements can be distinguished. The first requirement is to estimate diffuse emissions for the River Basin Districts in Europe. The second requirement is that the procedure to estimate emissions will become widely accepted by all Member States. A set of guiding principles formed the basis of the activities in the project:
Make optimal use of previous work The consortium has used the results of earlier emission inventories and regionalisation initiatives (e.g. ICPR method, HARP guidelines, and WFD article 5 reports). In addition the recent experiences of IER with the regionalisation of E-RPTR air emissions are used (IER, 2011).
Use clear definitions The consortium has proposed a clear set of definitions of sources, substances and pathways. As much as possible, the definitions are as proposed in the Guidance Document on Emission Inventories (EC, 2012).
Simple and transparent methods Since quantification and allocation methods have to be used by different Member States only transparent and well documented methods and models are used. In the project the TCCCA quality criteria have been used, developed under the UNFCCC process (UNFCC, 2004): Transparency, Consistency, Comparability, Completeness and Accuracy.
Data availability Data which are required by the quantification methods developed in the project have to be generally available and expected to stay available in future years. The level of detail of the data necessary as input for the models or the quantification methodology has to match with the availability of the data.
Focus on the major problems The financial and temporal conditions of the project limit the number of substances, sources and the amount of data which can be addressed. Therefore this project is focused on the most important substances: the priority (hazardous) substances and nutrients and on the sources with a major contribution to the total loads to the surface water: the key sources.

1205118-000-ZWS-0016, 2 July 2013, final
Diffuse water emissions in E-PRTR - Project report
5 van 102
2 Selection of relevant source substance combinations
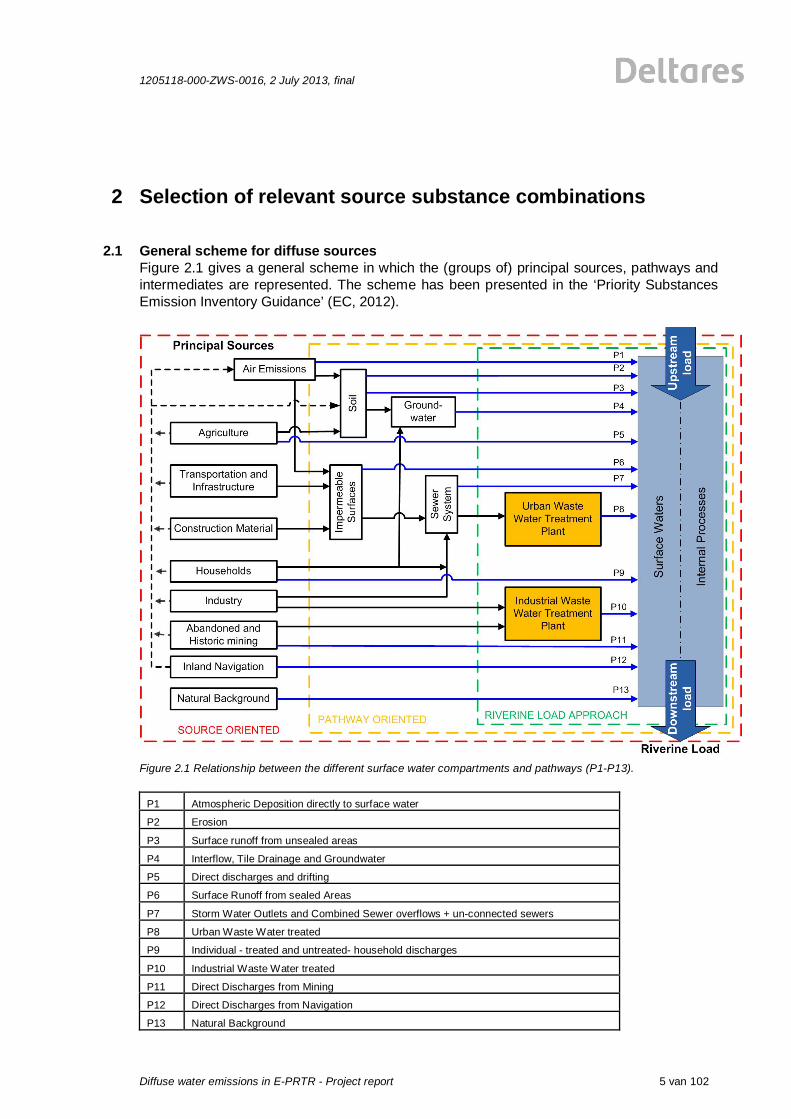
2.1 General scheme for diffuse sources Figure 2.1 gives a general scheme in which the (groups of) principal sources, pathways and intermediates are represented. The scheme has been presented in the ‘Priority Substances Emission Inventory Guidance’ (EC, 2012).
Figure 2.1 Relationship between the different surface water compartments and pathways (P1-P13).
P1 Atmospheric Deposition directly to surface water
P2 Erosion
P3 Surface runoff from unsealed areas
P4 Interflow, Tile Drainage and Groundwater
P5 Direct discharges and drifting
P6 Surface Runoff from sealed Areas
P7 Storm Water Outlets and Combined Sewer overflows + un-connected sewers
P8 Urban Waste Water treated
P9 Individual - treated and untreated- household discharges
P10 Industrial Waste Water treated
P11 Direct Discharges from Mining
P12 Direct Discharges from Navigation
P13 Natural Background

Diffuse water emissions in E-PRTR - Project report
1205118-000-ZWS-0016, 2 July 2013, final
6 van 102
This scheme is considered very useful and has been used as a common basis for the definitions of sources and pathways within this project. In the scheme, three different approaches that can be used in the field of emission inventories are shown:
Riverine load approach Source oriented approach Pathway oriented approach
With the riverine load approach, in theory the total load of diffuse emissions can be calculated by subtracting the known point source loads (mainly E-PRTR data) from the riverine load calculated on the basis of the flow and the concentrations in the river system. Because of the incompleteness of the point source data, the difficulties concerning the water quality processes that are not taken into account and the lack of a link with the specific diffuse sources (and thus potential measures for reduction), the riverine approach is regarded as less useful for this project and has not been applied. The source oriented approach seems too complex for this project and can be seen as a possible next step in the expansion of the quantification of diffuse sources. The pathway approach seems in general to best fit the activities in this project.
2.2 Availability of data sets on diffuse emissions to surface water In the project, research has been carried out to gather available data on diffuse emissions to water. The main conclusions of this research are:
the existing data regarding diffuse emissions is limited; much data is related to specific, local projects which can not easily be extrapolated
to a European scale; much research is not published and is only available in “grey literature”; in many countries studies about diffuse emissions are running, but not yet finished
and published; many studies are not transparent about the backgrounds of the quantification
methods and the reliability of the underlying data; official Member State reports on diffuse sources are limited and mainly related to
reporting articles in a few Directives or the activities of JRC and EEA. The most important datasets regarding diffuse emissions available on an EU level are briefly described below: WISE State of the Environment (SoE): Emissions The WISE-SoE dataset is categorized into 8 sources per Member State. At the time the data were needed for this project, the dataset was not yet complete. Not all Member States had reported emission data. River Basin Management Plans The data for the River Basin Management Plans were not easily available from the EIONET website. Information could only be obtained per Member State, but not all member states had authorised their data. Within the project, it appeared not possible to access this data. The pressures for the River Basis District plans are categorized in 6 sources.

1205118-000-ZWS-0016, 2 July 2013, final
Diffuse water emissions in E-PRTR - Project report
7 van 102
WFD - Article 5 Datasets delivered for the article 5 files for the WFD, pressures and substances for all River Basins are not available on the EIONET website. Like the data for the River Basin Management Plans it appeared not possible to access this data for this project. For this project the above mentioned datasets are not used to estimate the diffuse sources, because the datasets were incomplete and the definitions of the sources were rather different. Urban Waste Water Treatment Directive For monitoring under the Urban Waste Water Treatment Directive, a database is available on the EIONET site. The database contains a lot of useful information about the UWWTPs in European countries. This database is very useful to estimate emissions for the diffuse sources UWWTPs and un-connected households. The EFTA countries (Switzerland, Liechtenstein, Norway and Iceland) are not included. Available data about diffuse sources, emission factors, proxy datasets and quantification methods used in this project are described in detail in the individual factsheets enclosed in this report. For every Pathway in Figure 2.1 is checked, whether relevant emission information from the possible key sources can be determined by estimating the emissions on a EU-wide scale. Atmospheric Deposition
This source is covered by the pathway P1 in the general scheme. Figure 2.1 refers to the part of the direct atmospheric deposition to surface water.
It is a major source for N-total, heavy metals, a number of pesticides and PAH. It is a complex source and models are often used for the quantification of the loads. On the EMEP (European Monitoring and Evaluation Programme) website information is available for a number of substances.
Agriculture
This source is related to the pathways P2-P5 in the scheme. Especially P3 and P4 have a close relation with agricultural activities. P5 seems to be a less important source.
Agriculture is a known major source for nutrients, heavy metals and pesticides. Because of the complexity of this source, models are often used by Member States. For nutrients, the JRC’s “Green model” is available and also for some pesticides. JRC has carried out modelling activities.
Road transport
This source is represented by pathway P6 for the part of the loads that ends up in the surface water by the surface runoff from sealed areas. The part of the loads that goes to the sewer system (mainly in urban areas) is covered by the pathways P7 and P8 and is not mentioned here.
Road transport is a known important source for heavy metals and PAH. Emission factors from different sub-sources like brake wear, engine oil leaks, road
surface wear and tyre wear are available from international literature. A lot of data regarding the location of roads and traffic intensity is available and
used on an EU-scale.

Diffuse water emissions in E-PRTR - Project report
1205118-000-ZWS-0016, 2 July 2013, final
8 van 102
The part of the loads that goes to the surface water is dependent on the presence of surface water near the roads. Hence, a map of the surface water on EU-wide scale is used.
Retention in treatment/ flow equalisation ponds is not included although this can be a significant sink for heavy metals and PAH.
Railways
Like road transport, this source is covered by pathway P6 for the part of the load that goes to the surface water.
Railways are a known source of PAH (preserved wood used for railway sleepers) and copper (pantographs and overhead wires).
In the opinion of the consortium, the main part of the load goes to the soil and not to the surface water which makes this source a minor one.
Emission factors are available.
Storm water overflows and separate sewers These sources are sub-sources of the pathway P7 in the scheme. On a river basin scale, storm water overflows will be a minor source, but can be
important on a local scale. Separate sewers can be important for nutrients and heavy metals. In general: a lot of different substances originate from these sources.
The concentrations and loads of these sources are highly dependent on local factors like the type of sewer system, amount and location of storm water overflows, the specific primary sources contributing to the loads, regional and local rainfall, the slope of the landscape, etc.
Although a rather simple method is available in the Dutch PRTR, it appeared that the necessary information to use this method is not available on an EU scale.
UWWTPs The effluents of the treated waste water are represented by pathway P8 in the
scheme. This source comprises a wide range of relevant substances, including specific
pesticides. A first analysis of the E-PRTR data (E-PRTR, 2012) of the UWWTPs makes clear
that a lot of emissions are missing. In fact we distinguish four major gaps: - Emissions of UWWTPs above the E-PRTR capacity threshold of 100.000
person equivalent (p.e.) that are not reported in E-PRTR. - Emissions of substances above the E-PRTR substance thresholds value that
are not reported (but do exist in reality). Available emission factors are used to quantify these emissions.
- Emissions of substances of the smaller UWWTPs (under the E-PRTR UWWTP capacity threshold value of 100.000 p.e.) are not reported yet. Available emission factors can be used to quantify these emissions.
- Emissions of substances of both the large and the smaller UWWTPs which are under the substance threshold values. In principle, the same emission factors as mentioned above can be used.
Above mentioned gaps are relevant in the process of generating the “total” emissions from all European UWWTPs.
Emissions are estimated by using the dataset for the Urban Waste Water Treatment Directive monitoring (UWWTD, 2012). It consists of much useful information like coordinates, capacity, percentage of households un-connected to

1205118-000-ZWS-0016, 2 July 2013, final
Diffuse water emissions in E-PRTR - Project report
9 van 102
UWWTP etc. The overview of the incoming and discharged loads for nitrogen, phosphorus, chemical oxygen demand is available for 9 Member States in this database. It is voluntary information and not all Member States have supplied this information. The more Member States supply this information, the more accurate the estimation of the UWWTP emissions will be.
Emission factors for substances can be calculated by using the UWWTP loads in the dataset of the E-PRTR loads to surface water.
Un-connected households
This source is pathway P9 in the scheme and refers to the individual households not connected to the sewer system, both with individual treatment (like a septic tank) or without.
Like the UWWTPs, this source contains a wide range of relevant substances, In certain Member States or regions, the percentage of the population that is not
connected to the sewer system can be quite large, so this source is a relevant one. Emissions are estimated by using available information about emission factors for
domestic wastewater from the Dutch Emission Register. Information about the percentage of the population un-connected at agglomeration level is available in the UWWTP database (UWWTD, 2012).
Industry not in E-PRTR
The emissions from industries are defined as pathway P10 in the scheme. Reliable estimation of diffuse emissions to surface waters of industries is an
extremely complex task due to number of reasons: - The heterogeneity of companies can be very large even if sectors produce
similar end products such as metals or foodstuffs. - Differences in emissions to water due to treatment of separate waste water
flows even within one facility of the same company. - A large uncertainty about the destination of effluents of industries i.e. sewers
(which can be seen as a transfer) or surface waters (a release, discharge or emission to the surface water).
Within the scope of the E-PRTR we can only explore the development of a methodology that could possibly be deployed on a wider scale at a later stage. This work has to be treated as a “case study” to make a first step in the quantification of diffuse emissions from the industry sector.
Mining Mining is a specific sector in the general scheme: the direct discharges to surface
water are defined as pathway P11. Besides this, a part of the load will usually go to an industrial waste water treatment plant.
Mining can be a relevant source for several heavy metals. A number of Member States report waste loads from historic mine sites due to
leaching. A first analysis shows that it is very difficult to develop a robust quantification method with the available data. The information about the exact location of the mines is limited. The loads to the surface water are generally strongly dependant of very specific, local differentiated geological, hydrological and climatological circumstances and are very time-variable.

Diffuse water emissions in E-PRTR - Project report
1205118-000-ZWS-0016, 2 July 2013, final
10 van 102
Inland navigation Inland navigation is a sub-source of pathway P12 in the scheme. This source can be relevant for nutrients (domestic wastewater), PAH and Copper
(from antifouling). Information about emission factors is available as well as EU-wide data on
navigation/shipping activity rates. Natural background
Natural background is defined as pathway P13 in the scheme. Although it can be an important contribution to the total load discharged to the
surface water, it is a very difficult pathway to quantify because of the regional and local geological and hydrological situation in combination with the different land uses.
Measures to reduce the natural background contribution are hard to define and carry out, what makes this source end up less high on the list of preferred sources to quantify.
2.3 Overview of substances A list of the EC of important Priority and Priority Hazardous substances (in the Tender Document) was the basis of the project substance list. Table 2.1 First selection of relevant sources and substances.
Atm
osph
eric
dep
ositi
on
Agric
ultu
re
Inla
nd n
avig
atio
n
Min
ing
Un-
conn
ecte
d ho
useh
olds
Roa
d tra
nspo
rt
Rai
lway
s
Stor
m w
ater
ove
rflow
s &
sepa
rate
sew
ers
UW
WTP
not
in
E-PR
TR
Indu
stry
not
in
E-PR
TR (c
ase
stud
y)
Substances TOC x x x x Nutrient-P x x x x x x Nutrient-N x x x x x x x Cadmium x x x x x x Lead x x x x x x x Mercury x x x x x x Nickel x x x x x x x Diuron x Alachlor Atrazine x other pesticides Anthracene x x x x x x x x Di(2-ethylhexyl)ftalate (DEHP) x x x x Fluoranthene x x x x x x x x Octylphenols x

1205118-000-ZWS-0016, 2 July 2013, final
Diffuse water emissions in E-PRTR - Project report
11 van 102
Atm
osph
eric
dep
ositi
on
Agric
ultu
re
Inla
nd n
avig
atio
n
Min
ing
Un-
conn
ecte
d ho
useh
olds
Roa
d tra
nspo
rt
Rai
lway
s
Stor
m w
ater
ove
rflow
s &
sepa
rate
sew
ers
UW
WTP
not
in
E-PR
TR
Indu
stry
not
in
E-PR
TR (c
ase
stud
y)
Additional substances Copper x x x x x x x x x Zinc x x x x x x x x Benzo[a]pyrene x x x x x x x Benzo[b]fluoranthene x x x x x x x Benzo[ghi]perylene x x x x x x Benzo[k]fluoranthene x x x x x x x Indeno(1,2,3-cd)pyrene x x x x x x x
-HCH x Lindane ( -HCH) x Dinitroaniline x Trifluralin x A set of possible interesting additional substances was added during the project. Based on a first inventory, a substance source matrix has been set up. Table 2.1 shows the substances which are expected to have relevant emissions from the key sources or pathways and for which data for quantification of emissions is available (indicated with an “x”). For the pesticides Alachlor and “other pesticides” no data was available.
2.4 Selection of sources Based on the information in paragraph 2.2 and 2.3, seven sources are selected, including a “case study” for industry. These key sources are selected for estimating the emissions on an EU-wide scale. The sources are:
Atmospheric Deposition Agriculture Inland navigation Un-connected households Road transport UWWTPs not in E-PRTR Industry not in E-PRTR (limited to a case study)
Based on information in paragraph 2.2 and 2.3, three potential sources are not selected for this study: Mining It is regarded impossible to develop a solid quantification method with the available data.
Railroads The main part of the railroads load will go to the soil and not to the surface water, which makes this source a minor one for the surface water.
Diffuse water emissions in E-PRTR - Project report
1205118-000-ZWS-0016, 2 July 2013, final
12 van 102
Storm water overflows The extent of this source is difficult to estimate because a lot of relevant data are required. Without a solid set of related data, a rough model calculation to estimate the load is regarded as not useful.
2.5 Questionnaire reactions During the project, Member States were informed about this project by a note which was sent with an overview of the proposed selection of sources and substances. Enclosed to this note, a questionnaire was sent with the aim of collecting information from Member States on already developed methodologies, available data sources, emission factors and proxy datasets, technical reports and documents. The questionnaire is enclosed at appendix A. In total 14 Member States returned the Questionnaire. The main reactions per question based on the reply of the Member States are listed below. Question 1a: Is there in your Member State any available GIS layers/spatially resolved information on water from diffuse sources? Reactions:
Just two Member States indicate that GIS layers are available on the internet. More Member States (7) mention spatial information could be made available for
comparison purposes. Question 1b: Do you have any methodology papers available that describe the methods used to derive spatial information for your emission maps? Reactions:
Just a few Member States indicate that they have methodology papers available, mainly concerning nutrients/agriculture.
Question 2: Do your national emission maps take point sources into account? Reactions:
Point source data is available for 9 Member States and reported in E-PRTR. Just a few Member States indicate that they have more data for point sources
available that is reported in E-PRTR. Question 3: Would you be available to review the grid maps produced under this E-PRTR project for your Member State e.g. by comparing them to your own national emission maps? Reactions:
A relevant number of Member States (9) indicate they would like to put effort into comparing the project results with national maps.
Question 4: Please indicate the availability in your Member State of the following statistical datasets which could be helpful for compiling spatially resolved maps of emission releases to water.

1205118-000-ZWS-0016, 2 July 2013, final
Diffuse water emissions in E-PRTR - Project report
13 van 102
Reactions:
A large number of Member States (which replied to the questionnaire) indicate that statistical information is available, mostly related to UWWTP (13), agriculture (12), atmospheric deposition (7), road traffic (6) and inland navigation (4).
Question 5: Regarding the sources of proxy data (see question 4) needed for the project, could you please specify under which conditions you can provide them, if available? Reactions:
Only a few Member States indicate that the data are publicly available. Other Member States indicate the possibility of charges to be paid for data delivery, the need for official data requests and restrictions on delivery of specific data related to confidentiality of data about production capacities, number of employees and budgets of industrial sectors/activities.
Although in general the information is public, in practice a lot of restrictions and limitations exist.
Question 6: Do you have any suggestions regarding other proxy data which could be useful for compiling maps of diffuse emissions to water of pollutants in Appendix 2 of this letter? Reactions: Three suggestions have been received:
1 Sweden: “report on nutrients (in English) and on heavy metals (in Swedish)”. This mainly refers to agriculture: for this source JRC model results are used.
2 Belgium/Flanders: “use purification rates in UWWTP estimations”. This item is covered in the UWWTP quantification method.
3 Germany: “take into account the hydrological situation: difference in diffuse inputs to surface waters between dry years and wet years”. This is a good point, but it seems not possible within the scope of this project to cover this problem. Including the hydrological situation on an EU-scale means the use of high level water quality models which is not possible within this project.
Question 7: For a number of specific items mentioned in the factsheets, we would like to have Member State specific information when available. This information will be used to improve the estimation methods of the different sources. Could you please provide information on:
1 Inland navigation: application of different types of coating in the current fleet (PAH-coating, bitumen coating, epoxy coating or other);
2 Inland navigation: percentage of collection of bilge water wastewater of inland navigation in harbours;
3 Un-connected households: average percentage of discharges (to surface water and to soil) of households not connected to the sewer system and without any individual treatment;
4 Un-connected households: average percentage of discharges (to surface water and to soil) of households not connected to the sewer system and with individual treatment (e.g. septic tank);
5 Un-connected households: average removal efficiency achieved by individual treatment for nutrients, heavy metals and PAHs;

Diffuse water emissions in E-PRTR - Project report
1205118-000-ZWS-0016, 2 July 2013, final
14 van 102
6 Road transport: average percentage of discharges (to surface water and to soil) from highways and rural roads;
7 Road transport: average percentage of discharges (to surface water and to soil) from highways and rural roads that is collected and treated;
8 Road transport: average removal efficiency to be expected in case of simple treatment.
Reaction:
Almost no information is reported for these questions. A few Member States reply that this information is not directly available, but would be subject to research. The reported data from the Netherlands is used in the current factsheets when appropriate.
Question 8: Suggestions and comments on items other than the above mentioned. Reactions: Three suggestions have been received:
1 Austria: “UWWTP are not a diffuse source”. Of course this is true. Estimating the missing emissions from UWWTPs in the E-PRTR don’t make the UWWTPs a diffuse source, it only means we use “diffuse source estimation methods” to calculate the emissions from UWWTPs for which measured data are absent.
2 The Netherlands: “quantification methods are available on the Dutch PRTR-site for about 40 diffuse sources”. This information was used in this project where it was appropriate.
3 Czech Republic: “for point sources make use of reported data and not from calculated data”. We only make a quantification of the part of the data which is not reported.
2.6 Feedback from the Member States Workshop On 7 June 2012, the day after the regular meeting of the E-PRTR Committee, in Brussels, a Workshop with the Member States was organised. The goal of the Workshop was to inform Member States about the project, to collect new information and to present and discuss the draft quantification methods and spatial allocation methods of the selected key sources. In total 31 representatives from 20 countries (19 EU Member States and Croatia) were present, as well as representatives of the EC DG-ENV, the EEA’s European Topic Centre for Water and the three consortium partners. Appendix B gives the minutes of the meeting and the main conclusions from the workshop meeting were:
In general, Member States agreed with the selection of sources. Not all the sources and substances can be covered in this project: we have to focus on the key sources and problem substances and we have to deal with the availability and reliability of the data necessary for the quantification methods.
Some Member States confirmed the expectation of the consortium that a lot of the point source emissions are still missing in the present E-PRTR.
There was discussion on specific topics, but no fundamental objections against the proposed quantification methods for the selected sources.
A number of suggestions and remarks have been given which are used to improve the quantification methods on several points:
UWWTP not in E-PRTR: use discharge data from the EEA UWWTP database;

1205118-000-ZWS-0016, 2 July 2013, final
Diffuse water emissions in E-PRTR - Project report
15 van 102
UWWTP not in E-PRTR: use locations of UWWTPs from the EEA UWWTP database;
UWWTPs not in E-PRTR: make distinction between different treatment classes;
Un-connected households: use UWWTP database; Un-connected households: septic tank emissions only to soil/groundwater, not
to surface water; Agriculture: please use the work done by the JRC; Inland navigation: Based on a discussion about inland navigation in the
coastal zone it was decided, in the factsheet, that only navigation in inland waters would be quantified.
A number of suggestions could not be used within the project, but are enclosed in this report as suggestions for improvement:
Atmospheric deposition: be aware of the resolution of the map with surface water: you might miss a part of the (smaller) waterways;
Road transport: a part of the run-off will be treated. A number of suggestions could not be used within the project because they didn’t fit
the requirements of the project: Take also the hydrology into account (too complex); Estimate also the sources (with emissions to air) contributing to the
atmospheric deposition (beyond the scope of the project); Use more recent data (often not possible because recent data is not
available); Be careful with measurements below the detection limit for UWWTP effluents
(detailed information about limitations of data reported by Member States to EC is often not available);
Include emissions to soil and groundwater (these pathways were not selected because no direct discharges to surface water);
Include also erosion (not selected because too complex). There was a general perception that the quantification of industrial emissions not in
the E-PRTR will not be possible without intensive research and data collection and is therefore not possible within this project. Based on this, it was decided just to report the industry case study, and not to work further on the quantification of industrial emissions within this project.
2.7 Final selection of source-substance combinations A combination of six key sources (excluding the “case study” for industry) and eleven substances was made, resulting in forty source-substance combinations (see Table 2.2). The eleven substances are nutrients (TOC, Nutrient-P, Nutrient-N), heavy metals (Cadmium, Copper, Lead, Mercury, Nickel and Zink) and PAH (Anthracene and Fluoranthene). For these selected source-substance combinations, the diffuse emissions are quantified and maps have been produced. A number of the substances of the first selection (see Table 2.1) were deselected, mainly because the lack of reliable data at an EU scale (pesticides), unreliable monitoring data (Nonylphenols and DEHP) and a large variety of emission factors (some of the PAH). In the end, the substances with the highest estimated reliability were selected. When a substance is not selected for a specific source, it doesn’t mean that no diffuse emissions of the substance may exist for that source.

Diffuse water emissions in E-PRTR - Project report
1205118-000-ZWS-0016, 2 July 2013, final
16 van 102
Table 2.2 Final selection of 40 sources-substance combinations.
Substances
Atm
osph
eric
de
posi
tion
Agric
ultu
re
Inla
nd n
avig
atio
n
Un-
conn
ecte
d ho
useh
olds
Roa
d tra
nspo
rt
UW
WTP
not
in
E-P
RTR
TOC x x x
Nutrient-P x x x x
Nutrient-N x x x x x
Cadmium x x x x
Copper x x x
Lead x x x x
Mercury x x x
Nickel x x x
Zinc x x x
Anthracene x x x x
Fluoranthene x x x x

1205118-000-ZWS-0016, 2 July 2013, final
Diffuse water emissions in E-PRTR - Project report
17 van 102
3 Methodology
3.1 Methodology to compile consistent emission data sets The method(s) used in this project are different for each of the selected sources: for some sources they are based on methods already in place in different Member States or existing methods at international level and for other sources, method(s) for the quantification of the specific source-substance combinations have been developed. In general, diffuse emissions are calculated by multiplying an “activity rate” (AR), for instance the number of inhabitants or buildings, by an emission factor (EF), expressed as an emission per unit of the AR. This method of calculation is the basis of the PRTR in the Netherlands and Belgium and is widely accepted and used in the international field of emission inventories. For emission sources which are more complicated to quantify due to connections with other media and processes (like agriculture), or which are affected by large-scale activities (like atmospheric deposition), models are used to calculate emission loads. Table 3.1 gives an overview of the quantification methods used for the selected sources. Table 3.1 Type of quantification method per source.
Source Quantification Method
Atmospheric Deposition based on EMEP model calculations combined with surface water maps
Agriculture based on JRC model calculations
Inland navigation based on emission factors and activity rates
Un-connected households based on EEA UWWTP database in relation with emission factors and activity rates, combined with surface water maps
Road transport based on emission factors and activity rates combined with surface water maps
UWWTPs not in E-PRTR based on EEA UWWTP database combined with emission factors and activity rates
Industry not in E-PRTR based on a combination of EUROSTAT production volumes and emission factors
The details of the quantification methods are described in the factsheets in Appendix C. The calculated national total loads to surface water for the selected substances per source are disaggregated to the River Basin District Subunit (RBDSU) level, as described in the next paragraph.
3.2 Compilation of proxy data sets to disaggregate diffuse emission sources The reference level for the spatial allocation in the frame of the E-PRTR Diffuse Emissions to Water is the River Basin District Subunit (RBDSU) level (WISE, 2011). The spatial domain of the resulting maps covers the EU27 Member states and the EFTA countries (Switzerland, Liechtenstein, Norway and Iceland).

Diffuse water emissions in E-PRTR - Project report
1205118-000-ZWS-0016, 2 July 2013, final
18 van 102
Relating to the spatial categorisation of anthropogenic emission sources, these can be usually distinguished into point, line or area sources. Concerning the spatial distribution methodology, in the frame of this project, all relevant emission sources were handled finally as line or area sources. Diffuse releases to surface water on River Basin District Subunit (RBDSU) level are spatially distributed to the regional NUTS3 (EUROSTAT, 2008) and 5 km x 5 km using different proxy data and were allocated to the RBDSU spatial level to be shown as map layers. Emissions have been quantified as kg per year. The basic principle of distributing emissions is presented in the formula below using a surrogate spatial dataset (EEA, 2009):
where: i: is a specific geographic feature;
here: administrative areas (NUTS 3), 5 km x 5 km grid cell, RBDSU;
x: is a sector that is characterized by the surrogate dataset (x).
emissioni, x: is the emission attributed to a specific geographical feature i (e.g. a grid, line, point or administrative boundary) within the spatial surrogate dataset x; here: emission value attributed to each administrative area (NUTS 3 region), each 5 km x 5 km grid cell or each RBDSU;
emissiont: is the total national emission for a sector to be distributed across the national area using the (x) surrogate spatial dataset; here: the emission values are distributed within each EU27 and EFTA4 member state;
valuei,x – is the surrogate data value for each geographical feature within the spatial surrogate dataset x. here: the surrogate data are e.g. traffic volume, CORINE land cover class.
The specific geographic feature in this case is the lowest level of the administrative units (e.g. NUTS3), the RBDSUs and the 5 x 5 km level. The use of surrogate data (distribution parameters) allows a determination of the share of annual emissions that have to be attributed to each spatial level. The distribution parameters are correlated with the emission source sectors and defined by means of:
geographical resolved statistical information; land cover/land use data; indexes derived from emission sources (IER, 2011).
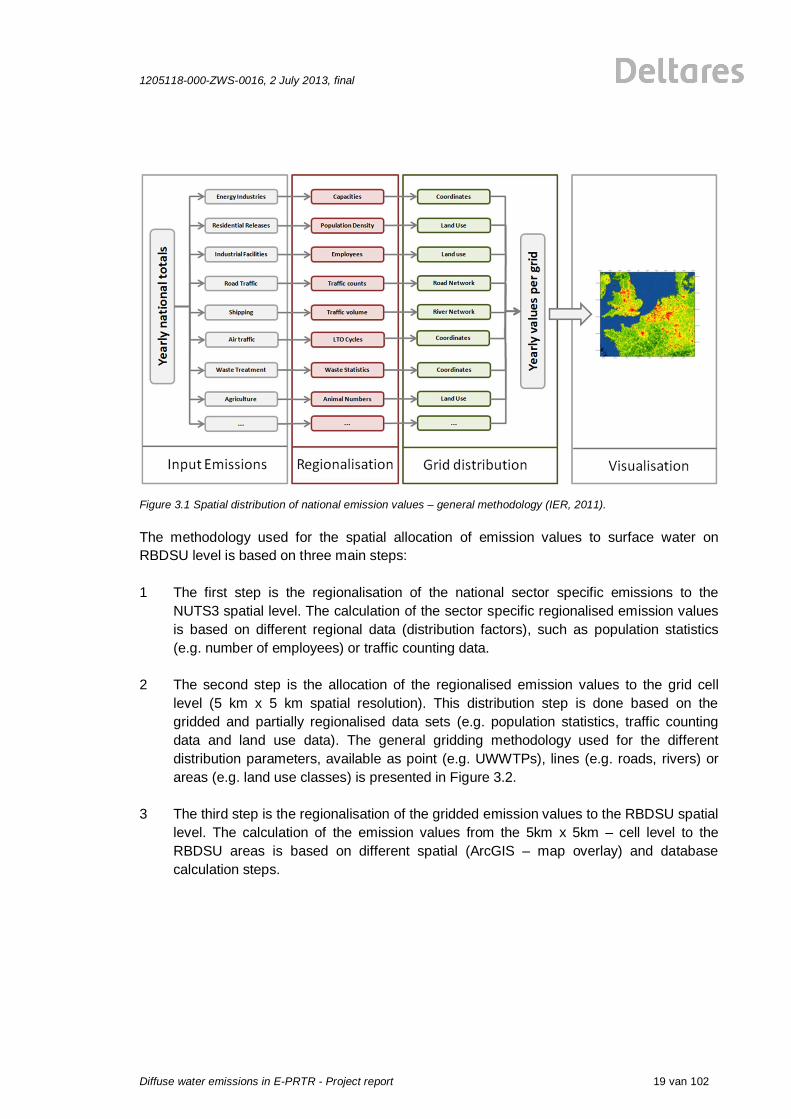
The applied gridding methodology is based on the general methodology for the spatial distribution described in IER, 2011. Figure 3.1 presents an overview of the general spatial distribution methodology for all types of emission sources including point sources.
,,
,
i xi x t
i xi
valueemission emission
value
1205118-000-ZWS-0016, 2 July 2013, final
Diffuse water emissions in E-PRTR - Project report
19 van 102
Figure 3.1 Spatial distribution of national emission values – general methodology (IER, 2011). The methodology used for the spatial allocation of emission values to surface water on RBDSU level is based on three main steps: 1 The first step is the regionalisation of the national sector specific emissions to the
NUTS3 spatial level. The calculation of the sector specific regionalised emission values is based on different regional data (distribution factors), such as population statistics (e.g. number of employees) or traffic counting data.
2 The second step is the allocation of the regionalised emission values to the grid cell
level (5 km x 5 km spatial resolution). This distribution step is done based on the gridded and partially regionalised data sets (e.g. population statistics, traffic counting data and land use data). The general gridding methodology used for the different distribution parameters, available as point (e.g. UWWTPs), lines (e.g. roads, rivers) or areas (e.g. land use classes) is presented in Figure 3.2.
3 The third step is the regionalisation of the gridded emission values to the RBDSU spatial
level. The calculation of the emission values from the 5km x 5km – cell level to the RBDSU areas is based on different spatial (ArcGIS – map overlay) and database calculation steps.

Diffuse water emissions in E-PRTR - Project report
1205118-000-ZWS-0016, 2 July 2013, final
20 van 102
Figure 3.2 Geospatial referencing of distribution parameters (Wickert, 2001).
3.3 Products The different products of the project are as follows:
3.3.1 Factsheets A factsheet describes the methodology for estimating emissions and spatial allocation for each of the selected key sources. The factsheets give a brief and transparent overview of the relevant information (see Appendix C). Each factsheet (except the case study for Industry) has the same structure and consists of the following paragraphs:
Introduction Development of a methodology Explanation of the calculation method Activity rate Emission factors Emission pathway to water Emissions Spatial allocation Literature
3.3.2 Maps and metadata description Technical information and requirements on data deliverables are based on the requirements from the EEA concerning the specification of data for E-PRTR diffuse sources. The deliverables are gridded map layers for the 40 selected source substance combinations at the resolution of River Basin District Subunit (RBDSU).

1205118-000-ZWS-0016, 2 July 2013, final
Diffuse water emissions in E-PRTR - Project report
21 van 102
In order to meet the requirements for incorporating all compiled maps in the E-PRTR website, an appropriate metadata description was generated for every map. This contains the following main points:
a list of the maps including short titles; a file geo database containing the datasets in a specific projection1; MXD (special GIS file) for each source with separate layers for each substance
(map); a list of fields/values to display and their colour coding; a list of fields from the attribute table to display on map identities.
The results of the spatial allocation methodology are represented as separate map layers for each source-substance combination. For each map (layer) a short description (textual content) was compiled. The main items of the map descriptions are:
map ID - referring to the map/layer identification number; short title - of the map; full title - of the map; diffuse sources / general information - referring to the source, substance, reference
year and spatial level; diffuse sources / methodology - referring to the Geographic Information System (GIS)
overlay and the comparability of the results; diffuse sources / source data - referring to the input data (emission data, distribution
parameters) used for the spatial allocation.
3.3.3 Dissemination document To inform the public about the gridding methodologies used for the distribution of diffuse emission to water at a RBDSU level, a separate dissemination document has been compiled. The document contains information regarding the following points:
the source specific factsheets; a list of the selected source-substance combinations; for each of the selected source-substance combinations:
the map description; the produced map.
.
1a “etrs89/wgs84” projection is used


1205118-000-ZWS-0016, 2 July 2013, final
Diffuse water emissions in E-PRTR - Project report
23 van 102
4 Results
4.1 Comparing E-PRTR and non E-PRTR emissions In Table 4.1 the loads per substance summarised for all the sources quantified in this project are compared with the loads of the point sources with direct discharges to surface water already in the E-PRTR (year 2010). The transfers (connection via sewers or trucks) from industrial activities to the UWWTPs, which are also included in the E-PRTR, are not represented in Table 4.1 because in this project, we only focus on the emissions directly to the surface water. It has to be emphasised that the “Sum of A and B” in the table refers to the total sum of the loads of the selected sources (of this project) and reported emissions to surface water (in E-PRTR) and doesn’t necessarily give a complete view of all existing sources. For all the selected substances, the total load of the diffuse sources quantified in this project means a significant increase of the loads in the E-PRTR. The loads identified by this project are about half the E-PRTR loads for TOC and up to eight times higher for Nutrient-N. Table 4.1 Loads to surface water in Europe 2010 (EU27+EFTA1) for the quantified diffuse loads in this project and
for E-PRTR point sources.
Substances Total from diffuse
sources in this project (A)
Total E-PRTR point sources (B)
Sum of A and B Unit
TOC 42% 58% 1 342 kton Nutrient-P 69% 31% 196 kton Nutrient-N 89% 11% 4 063 kton Cadmium 74% 26% 72 ton Lead 76% 24% 716 ton Mercury 72% 28% 15 ton Nickel 61% 39% 836 ton Anthracene 48% 52% 0,48 ton Fluoranthene 70% 30% 1,4 ton Copper 56% 44% 1 326 ton Zinc 51% 49% 5 082 ton 1 note: not for all the sources all EU27+EFTA counties are included due to lacking parameters necessary for the estimation of the loads. More details are given in the fact sheets.
4.2 Key sources of diffuse emissions Table 4.2 focusses on the individual sources quantified in this project. The loads of the substances in the present E-PRTR database are divided between industrial loads (direct emissions from industrial facilities) and loads from UWWTPs, both to surface water. The highest contributions of the substances in this project are found for Agriculture (Nutrient-P and Nutrient-N) and “UWWTPs not in E-PRTR” (heavy metals and PAHs). The overall contribution of the “un-connected households” seems limited, as is Road transport. Inland navigation and Atmospheric deposition are important contributors for respectively PAHs and heavy metals.

Diffuse water emissions in E-PRTR - Project report
1205118-000-ZWS-0016, 2 July 2013, final
24 van 102
It has to be mentioned that in this overview probable significant contributions of heavy metals from Agriculture (due to the heavy metals in manure and fertilisers), heavy metals (Nickel, Copper and Zinc) and PAHs from Atmospheric deposition and heavy metals in separate storm water (corrosion from e.g. building materials) are not included because these source-substance combinations were not selected in this project. Table 4.2 Relative load per key source to surface water in Europe 2010 (EU27+EFTA1). In green relative
percentage of less than 10%, yellow between 10%-50% and red above 50%.
Sub
stan
ces
Emissions quantified in this project Emissions already in E-PRTR
Tota
l pro
ject
+ E
-PR
TR
Uni
t
Atm
osph
eric
de
posi
tion
Agric
ultu
re
Inla
nd n
avig
atio
n
un-c
onne
cted
ho
useh
olds
Roa
d tra
nspo
rt
UW
WTP
s no
t in
E-PR
TR
E-PR
TR in
dust
ries
E-PR
TR U
WW
TPs
TOC 0,03% 0,1% 44% 33% 22% 1 342 kton Nutrient-P 46% 0,01% 0,02% 24,1% 11% 19% 196 kton Nutrient-N 2,8% 77% 0,004% 0,004% 9,6% 2% 8,3% 4 063 kton Cadmium 5,4% <0,1% 0,0% 69% 10% 16% 72 ton Lead 17% <0,1% 11% 47% 14% 10% 716 ton Mercury 17% <0,1% 0,0% 55% 16% 12% 15 ton Nickel <0,1% 4,5% 57% 16% 23% 836 ton Anthracene 23% <0,1% 0,7% 24% 39% 13% 0,48 ton Fluoranthene 16% 0,1% 0,6% 54% 26% 3,8% 1,4 ton Copper <0,1% 8,3% 48% 27% 16% 1 326 ton Zinc <0,1% 1,0% 50% 25% 25% 5 082 ton 1 note: not for all the sources all EU27+EFTA counties are included due to lacking parameters necessary for the estimation of the loads. More details are given in the fact sheets. Of particular note is the high contribution of the source “UWWTPs not in E-PRTR” when compared with “E-PRTR UWWTPs” (see Table 4.3), especially because the starting point of the E-PRTR Regulation was that about 90% of point source discharges would be covered by the definitions and thresholds included in the Regulation. Although the “UWWTPs not in E-PRTR” are obviously no real diffuse sources, it seems by far the most relevant key source selected in this project. In this project also the missing loads regarding the large UWWTPs (> 100.000 p.e.) have been estimated. The data in Table 4.3 indicate that even for the well known and relatively well measured substances like nutrients (TOC, Nutrient-P and Nutrient-N) E-PRTR seems to only cover less than half of the “real” total loads (the sum of the E-PRTR and the loads of the diffuse sources quantified in this project). For other substances, this percentage of coverage seems even lower, with a lowest value of 7% for Fluoranthene.

1205118-000-ZWS-0016, 2 July 2013, final
Diffuse water emissions in E-PRTR - Project report
25 van 102
Table 4.3 Loads of the UWWTPs estimated for this project and the UWWTPs already in E-PRTR.
Substances E-PRTR UWWTPs
UWWTP not in E-PRTR
Total UWWTPs Unit
Nutrient-N 40% 60% 624 kton Nutrient-P 39% 61% 71 kton TOC 28% 72% 750 kton Anthracene 35% 65% 0.177 ton Fluoranthene 7% 93% 0.791 ton Cadmium 13% 87% 61 ton Copper 25% 75% 853 ton Mercury 17% 83% 10 ton Nickel 29% 71% 666 ton Lead 17% 83% 409 ton Zinc 33% 67% 3 775 ton The figures 4.1 and 4.2 are two examples which express the same Table 4.2 data for Nutrient-N and Nutrient-P as pie charts. For both substances, we clearly see the major contribution of Agriculture and the lower contribution of the emissions to surface water already in the E-PRTR (E-PRTR industries and E-PRTR UWWTPs).
Figure 4.1 Pie Chart showing the contribution of the different sources of nutrient-N in Europe 2010 (EU+EFTA).
77%
2,8%
9,6%
2%8,3%
nutrient-N
Agriculture
Atmospheric deposition
Inland navigation
Un-connected households
UWWTP not in E-PRTR
E-PRTR point (industry)
E-PRTR point (UWWTP)

Diffuse water emissions in E-PRTR - Project report
1205118-000-ZWS-0016, 2 July 2013, final
26 van 102
Figure 4.2 Pie Chart showing the contribution of the different sources of nutrient-P in Europe 2010 (EU+EFTA).
4.3 Overview of Member State emissions In the source factsheets (see Appendix C), the emissions to surface water for individual Member States are included per substance. It is clear that large differences occur between the level of emissions in Member States as a result of differences in the size of the Member State, the level of the specific activity that causes the emissions, emission factors and the percentage of surface water in the Member State. Figures 4.3 and 4.4 give an overview of the emissions per Member State (EU27 + EFTA) for the selected key sources in this project and the emissions to surface water already in the E-PRTR (E-PRTR industries and E-PRTR UWWTPs) for two example substances: nutrient-N and nutrient-P. At has to be noted that not for all the sources all EU27+EFTA counties are included due to lacking parameters necessary for the estimation of the loads. More details are given in the individual fact sheets (see Appendix C). For Nutrient-N, in almost all Member States the highest contribution to the emissions is from Agriculture. The second biggest sources are the “UWWTPs in E-PRTR’ and the “UWWTPs not in E-PRTR” (as quantified in this project). Only in a few Member States, do industrial sources (point sources in E-PRTR) seem to have a significant contribution. Atmospheric deposition is recognizable especially in Member States with a high percentage of surface water like Finland, Sweden and the Netherlands and in Member States which also designated their coastal waters in the RBMPs (see also par. 5.2). A more diverse picture is evident for the emissions of Nutrient-P in Figure 4.4. Agriculture is an important source, although not the largest one in all Member States. Point source emissions, both already in E-PRTR (industry and UWWPTs) and UWWTPs not in E-PRTR are major sources in many Member States.
46%
24%
11%
19%
nutrient-P
Agriculture
Inland navigation
Un-connected households
UWWTP not in E-PRTR
E-PRTR point (industry)
E-PRTR point (UWWTP)

1205118-000-ZWS-0016, 2 July 2013, final
Diffuse water emissions in E-PRTR - Project report
27 van 102
Figure 4.3 Loads to surface water of Nutrient-N per key source and per Member State (EU+EFTA) in kton/year (2010).
0
100
200
300
400
500
600
700
800A
ustri
a
Bel
gium
Bul
garia
Cyp
rus
Cze
ch R
epub
lic
Ger
man
y
Den
mar
k
Est
onia
Finl
and
Fran
ce
Gre
ece
Hun
gary
Icel
and
Irela
nd
Italy
Liec
hten
stei
n
Lith
uani
a
Luxe
mbo
urg
Latv
ia
Mal
ta
Net
herla
nds
Nor
way
Pol
and
Por
tuga
l
Rom
ania
Slo
vaki
a
Slo
veni
a
Spa
in
Sw
eden
Sw
itzer
land
Uni
ted
Kin
gdom
Kto
n/ye
ar
Nutrient-N
E-PRTR point (industry)
E-PRTR point (UWWTP)
UWWTP not in E-PRTR
Un-connected households
Inland navigation
Atmospheric depostion
Agriculture

Diffuse water emissions in E-PRTR - Project report
1205118-000-ZWS-0016, 2 July 2013, final
28 van 102
Figure 4.4 Loads to surface water of Nutrient-P per key source and per Member State (EU+EFTA) in kton/year (2010).
0
5
10
15
20
25
30
35
40
45Au
stria
Belg
ium
Bulg
aria
Cyp
rus
Cze
ch R
epub
lic
Ger
man
y
Den
mar
k
Esto
nia
Finl
and
Fran
ce
Gre
ece
Hun
gary
Icel
and
Irela
nd
Italy
Liec
hten
stei
n
Lith
uani
a
Luxe
mbo
urg
Latv
ia
Mal
ta
Nor
way
Net
herla
nds
Pola
nd
Portu
gal
Rom
ania
Slov
akia
Slov
enia
Spai
n
Swed
en
Switz
erla
nd
Uni
ted
King
dom
Kto
n/ye
ar
Nutrient-P
E-PRTR point (industry)
E-PRTR point (UWWTP)
UWWTP not in E-PRTR
Un-connected households
Inland navigation
Atmospheric depostion
Agriculture
1205118-000-ZWS-0016, 2 July 2013, final
Diffuse water emissions in E-PRTR - Project report
29 van 102
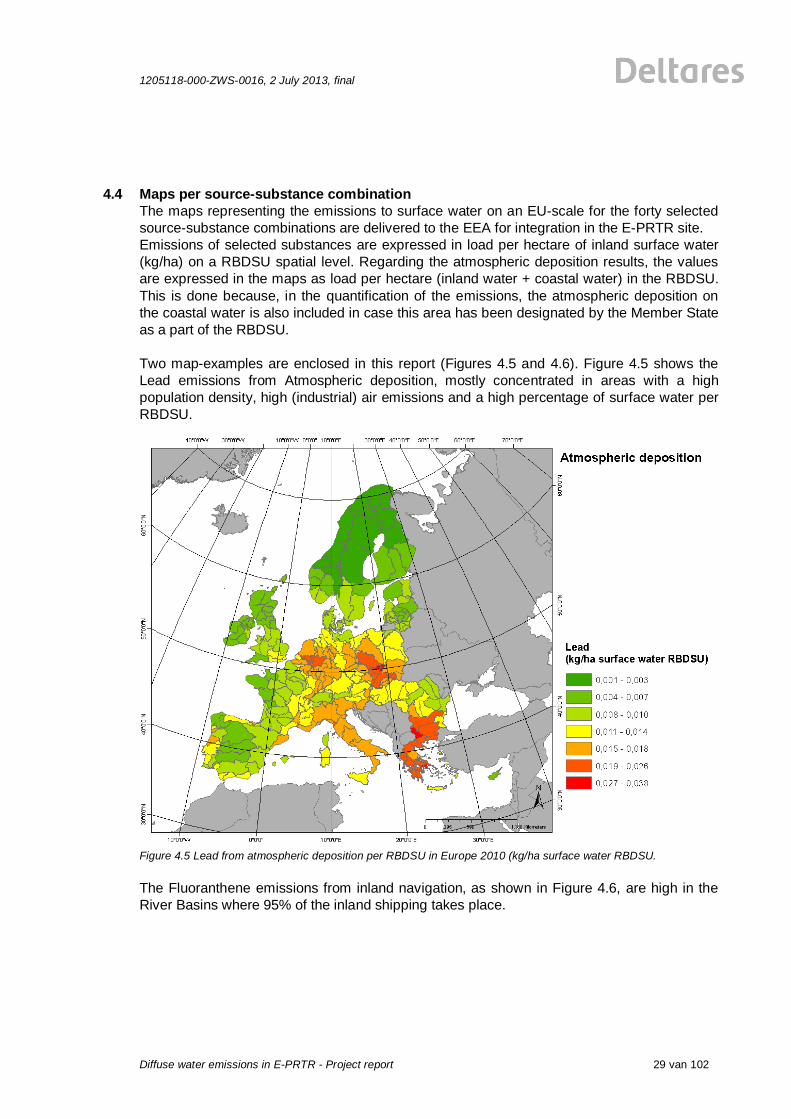
4.4 Maps per source-substance combination The maps representing the emissions to surface water on an EU-scale for the forty selected source-substance combinations are delivered to the EEA for integration in the E-PRTR site. Emissions of selected substances are expressed in load per hectare of inland surface water (kg/ha) on a RBDSU spatial level. Regarding the atmospheric deposition results, the values are expressed in the maps as load per hectare (inland water + coastal water) in the RBDSU. This is done because, in the quantification of the emissions, the atmospheric deposition on the coastal water is also included in case this area has been designated by the Member State as a part of the RBDSU. Two map-examples are enclosed in this report (Figures 4.5 and 4.6). Figure 4.5 shows the Lead emissions from Atmospheric deposition, mostly concentrated in areas with a high population density, high (industrial) air emissions and a high percentage of surface water per RBDSU.
Figure 4.5 Lead from atmospheric deposition per RBDSU in Europe 2010 (kg/ha surface water RBDSU. The Fluoranthene emissions from inland navigation, as shown in Figure 4.6, are high in the River Basins where 95% of the inland shipping takes place.

Diffuse water emissions in E-PRTR - Project report
1205118-000-ZWS-0016, 2 July 2013, final
30 van 102
Figure 4.6 Fluoranthene from inland navigation per RBDSU in Europe 2010 (kg/ha surface water RBDSU).

1205118-000-ZWS-0016, 2 July 2013, final
Diffuse water emissions in E-PRTR - Project report
31 van 102
5 Bottlenecks and recommendations for improvement
5.1 Major bottlenecks The major bottleneck encountered in this project is the overall lack of transparent, consistent, comparable and actual data concerning emissions of diffuse sources, emission factors and statistical data covering all EU27 Member States and EFTA countries. The actual emissions from most diffuse sources are strongly dependent on specific, local or regional differentiated geological, hydrological and climatological circumstances which are variable in time and therefore hard to estimate. Every method for the quantification of these diffuse sources will be a simplification of the real situation in the Member States. Nevertheless, a first rough quantification of the emissions of hazardous substances from key sources is necessary to make a link with possible emission reduction measures. The most useful data for this project has been data collected by the EC itself, often based on reporting requirements of EC legislation, agreed inventories or work done by European bodies like DG ENV, JRC, EUROSTAT, and EEA. One must be aware of the fact that these data have their limitations: not all the Member States meet all the reporting obligations, the response on mandatory inventories differs from year to year and differs between Member States while the quality of the data reported differs between Member States. Based on these limitations, relative simple, but transparent methods have been developed in this project to quantify the emissions of the selected diffuse sources, or existing model results have been used. The most important recommendations for improvement are improvements related to “spatial allocation” as described in 5.2 and improvements related to “specific emission sources” (as described in the factsheets and summarized 5.3).
5.2 Spatial allocation Definition of River Basin Districts Not all Member States designated the coastal zone of the River Basin Districts in the same way. Some Member States designated the 12 nautical mile zone, others the 1 nautical mile zone or a mix of these two. This can be made clear when we combine the official WFD RBDSU reference layer (which is the map used in this project 2) and a map showing the 12 nautical mile zone (Figure 5.1). Different overlapping situations can be observed. The light blue coastal zones in the figure show coastal areas within the 12 nautical mile zone which are also designated by the Member States as part of the RBD. The dark blue coastal zones show coastal areas within the 12 nautical mile zone which are not designated by the Member States as part of the RBD. The map shows different situations in individual Member States: areas with a complete overlap (for example in the Netherlands, indicated by the green arrow), areas with partial overlap (for example parts of the French coastal zone, indicated by the orange arrow) and areas with minimal overlap (for example parts of the coastal zone of the United Kingdom, indicated by the red arrow). This feature is especially troublesome for the quantification of emission sources related to the coastal areas, like atmospheric deposition and shipping in the coastal zone. As a result of this, the coastal shipping has not been selected for quantification in this project, only inland shipping. Despite this problem, the atmospheric deposition has been selected because it seems a major source. In this project, the loads from atmospheric deposition directly to the
2 http://www.eea. europa.eu/data-and-maps/data/wise-river-basin-districts-rbds-1, WFD_RBDSU_f1v4.zip

Diffuse water emissions in E-PRTR - Project report
1205118-000-ZWS-0016, 2 July 2013, final
32 van 102
surface water have been calculated for inland waters and for coastal zones, but only for the coastal zones designated as a part of the River Basin Districts by Member States.
Figure 5.1 Overlap situation of the RBDSU- and the 12 nautical mile zone – layer. Another problem related to the official designation of River Basin Districts is that on the official WFD map no River Basin Districts are included for Iceland. Because the project decided to only work with the official WFD map, the forty resulting maps do not cover Iceland. Future updates of the official River Basin District maps may be used to update and improve the maps produced under this project. Percentage surface water in the Member States In the factsheets for un-connected households and road transport, the percentage surface water per Member State is used to calculate the pathway of the emissions to surface water. The percentage surface water per Member State is presently calculated with the CORINE Land Cover database. However, only the bigger lakes and rivers are presented in the CORINE maps. For more accurate calculations of the emissions, it would be better to use more detailed maps. Just to indicate the effect of using the CORINE maps, Table 5.1 shows the percentage of the total area of Member States (excluding the coastal zone) that is surface

1205118-000-ZWS-0016, 2 July 2013, final
Diffuse water emissions in E-PRTR - Project report
33 van 102
water. Percentages are shown ranging from below 1 % to 17 %. These percentages have been used in the quantification methods for the sources un-connected households and road transport. The recommendation to improve the estimation of the percentage of surface water is mentioned in paragraph 5.3 for the specific sources. For the atmospheric deposition, both the inland waters and the coastal waters (as far as designated by the Member States as a part of the River Basin Districts) are used in the calculation of the loads. Table 5.1 Surface water percentage of total area of Member States.
Member State Area Inland Surface Water (km2)
Percentage of Inland Surface Water (%)
Austria 913.92 1.09 Belgium 241.91 0.79 Bulgaria 1 046.64 0.94 Cyprus 21.12 0.23 Czech Republic 668.01 0.85 Denmark 755.69 1.74 Estonia 2 190.78 4.83 Finland 53 749.09 15.95 France 3 919.63 0.61 Germany 4 990.21 1.4 Greece 1 323.92 1 Hungary 2 618.28 2.82 Iceland 8 897.63 8.67 Ireland 12 253.43 17.53 Italy 2 372.66 0.79 Latvia 2 764.13 4.28 Liechtenstein 4.03 2.5 Lithuania 1 753.40 2.7 Luxembourg 9.82 0.38 Malta 0 0.0 Netherlands 3 578.50 9.58 Norway 35 082.78 10.88 Poland 5 663.53 1.82 Portugal 739.49 0.8 Romania 7 145.30 3 Slovakia 340.90 0.7 Slovenia 102.68 0.51 Spain 3 493.75 0.69 Sweden 66 249.44 14.75 Switzerland 817.28 1.98 United Kingdom 7 521.68 3.08

Diffuse water emissions in E-PRTR - Project report
1205118-000-ZWS-0016, 2 July 2013, final
34 van 102
5.3 Suggestions for improvement per source Agriculture The emissions from agriculture are based on results of the JRC’s GREEN model. Like every model, also this model can be improved, both in a technical way and in a data input way. More details about the model, limitations and possibilities for improvement are given in the documents referred to in the factsheet (see Appendix C). A major improvement would be:
Actualisation of the information: this project uses the most recent model results for the year 2005. Relevant factors for the calculations like livestock levels, crop types and manure & fertiliser application, are likely to have changed considerably since 2005.
Atmospheric deposition Atmospheric deposition can be described as load of substances to surface water or soil via the atmosphere. For this factsheet EMEP results are used. The most relevant improvements for this source would be:
These results are available on the 50km x 50km level. A more detailed spatial resolution of the original EMEP data will improve considerably the calculations and the application of the results.
A more detailed estimation of the percentage of surface water per Member State (see paragraph 5.2). In the present CORINE maps used, the smaller waters are not taken into account. Because of this, the loads of the atmospheric deposition directly to surface water emissions are expected to be underestimated in this project. In many Member States, more detailed land coverage maps are available which will increase significantly the reliability of the quantified loads.
Especially for this source the definition of the RBD is important: atmospheric deposition on coastal waters can only be calculated and presented on the maps when the coastal zone (see paragraph 5.2) is included. Because the large surface area of the coastal zone, the loads of atmospheric deposition to these waters may contribute a lot to the total loads per RBDSU.
In the EMEP inventories information about atmospheric deposition fluxes and rainwater monitoring is available for more substances than now used in this project.
Inland navigation For this source a method to calculate diffuse emissions resulting from inland navigation is set out. It includes the sources coatings, sacrificial anodes, bilge-water and sanitary wastewater and presents emission factors for these sources combined. Items that might improve the calculations are:
The actual distribution of coating types in the individual Member States is not known. This distribution depends on regulations and directives ratified by the EU or implemented nationally. It might be conceivable that regulations on the application of PAH-based coatings differ per Member State. The spatial allocation might be improved with information about coatings.
A similar discussion point arises on the collection of bilge-water and sanitary wastewater. In some Member States regulations and enforcement about the collection of bilge-water and wastewater might be strict while absent in others. The use of more detailed and actual Member State data will directly improve the quantification of the loads.

1205118-000-ZWS-0016, 2 July 2013, final
Diffuse water emissions in E-PRTR - Project report
35 van 102
For many Member States, no data about the amount of ton-kilometres (a ton-kilometre is one ton of cargo transported one km across the water) performed by inland vessels is present in the EUROSTAT database because these Member States are expected to have no significant inland shipping. It is estimated with the available data more than 95% of the ton-kilometres on a EU-scale are covered. Adding the percentage missing ton-kilometres will improve the accuracy of the estimated loads for some Member States.
Un-connected households For this source a method is described to calculate the emissions from households that will reach the surface water directly. The following actions might improve these calculations:
Among other things the emission calculations for the un-connected households are dependent on the information that Member States have supplied to the Commission. From the database “Waterbase – UWWTD” the information reported by Member States about the generated loads without treatment is used for the calculations. This load is an important factor for the calculated loads to surface water. There is some doubt about the accuracy of the reported data in the UWWTP database. Half of the Member States report a zero percentage of untreated households in their country. At least for some Member States this percentage is too low which results in an underestimation of the quantified loads. It is recommended to validate the data supplied by Member States.
In the UWWTP database Member States supply data regarding different NUTS levels, NUTS0 to NUTS3. For the regionalisation of the emissions all NUTS0, NUTS1 and NUTS2 levels are disaggregated to NUTS3 levels. It is recommended that Member States supply information on NUTS3 levels, resulting in more accurate calculations.
For the calculations, population figures are used for 2008. For more accurate calculations, it would be better to use more recent figures.
It was not possible to calculate loads to surface water for the four EFTA countries, Norway, Switzerland, Iceland and Liechtenstein. Information about the generated load without any treatment was not available within the UWWTP database because EFTA countries do not have to report on EU Directives. To fill these gaps, this information could be requested from these four EFTA countries.
In general it is not known for the different Member States what percentage of the loads from untreated households goes to the surface water and what percentage goes to soil. In this project, as a rough approximation the percentage of inland surface water per Member State (Table 5.1) is used as the percentage of the loads going to surface water. The remaining part is assumed to go to soil, i.e ranging from 83 to 99%. The most important improvement with respect to this item would be to use a more specific percentage based on Member State data. If this option will not be feasible, it is suggested to make a more detailed estimate of the percentage of surface water per Member State (see paragraph 5.2). In the presently used CORINE maps, the smaller waters are not taken into account. Because of this the loads of the atmospheric deposition directly to surface water are expected to be underestimated in this project. In many Member States, more detailed land coverage maps are available. The use of more detailed maps will increase significantly the reliability of the quantified loads.
Diffuse water emissions in E-PRTR - Project report
1205118-000-ZWS-0016, 2 July 2013, final
36 van 102
For this source, it is rather easy to add emissions of more substances. Emission factors based on international literature and measurements of more heavy metals, individual PAHs and other priority and priority hazardous substances are available on the Dutch PRTR-internet site (www.prtr.nl). The emission factors of some of these additional substances will however have a lower reliability than the emission factors of the substances reported in this project.
Road transport A method is set out for calculating diffuse emissions originating from road traffic activity. It includes the sources tire wear, brake wear and motor oil leakage, and presents emission factors for these sources combined. There are a number of points that might increase the accuracy/reliability of the calculation results:
For urban areas it is assumed that all emissions from road traffic will go directly to the sewer system. If Member States could provide country specific information about the part of the emissions in urban areas going to the surface water system, the calculation results would become more accurate.
The distinction in type of vehicles is only made for light and heavy traffic. If the spatial allocation would provide a more detailed distinction, it would be feasible to use more detailed emissions factors.
The major part of emissions from road traffic on highways and rural roads will go to the soil, and a smaller part will go directly to surface water. In general it is not known for the different Member States which percentage of the loads from runoff goes to the surface water and which percentage goes to the soil. In this project, the percentage of inland surface water per Member State is used as a rough approximation of the percentage of the loads going to surface water. The remainder is assumed to go to soil. This calculation method may be improved based on specific Member State data. Besides this improvement, it is suggested to make a more detailed estimate of the percentage of surface water per Member State (see paragraph 5.3). In the presently used CORINE maps, smaller waters are not taken into account and so, the atmospheric deposition loads directly to surface water are expected to be underestimated in this project. In many Member States, more detailed land coverage maps are available.
In some areas, a part of the runoff water coming from highways and rural roads is collected and sometimes treated in a simple way (e.g. retention ponds). Because no data are available on a central EU level about this subject, it is assumed that no purification took place. For some Member States or RBDSU, this will cause an overestimation of the loads calculated for this source. It is expected that in some Member States there is at least some data available to improve this calculation method.
As with un-connected households, it is also easy to add more substances in the calculation procedure for this source. Emission factors based on international literature and measurements of more heavy metals, individual PAHs and other priority and priority hazardous substances are available on the Dutch PRTR-internet site (www.prtr.nl). The emission factors of some of these additional substances will however have a lower reliability than the emission factors of the substances reported in this project.

1205118-000-ZWS-0016, 2 July 2013, final
Diffuse water emissions in E-PRTR - Project report
37 van 102
Urban Waste Water Treatment Plants (UWWTPs) The factsheet UWWTPs describes a method to calculate the emissions for UWWTPs with different capacities and treatment methods. The calculated loads have to be added to point source loads that are presently stored in the E-PRTR database and maps. There are a number of issues that might improve the calculation results:
Two databases are presently used to obtain the emission factors, the E-PRTR database [2] and the UWWTP database [1]. Both databases contain codes for the UWWTPs, but the used codes are not compatible. Therefore the UWWTPs have been linked by using GIS. There is a chance that wrong UWWTPs are linked to each other or UWWTPs are not linked because there are differences in coordinates between both databases for a number of UWWTPs. It is recommended to use equal codes for the UWWTPs in both databases or to report 1:1 links for the codes.
The calculated emissions are dependent on the information supplied by the Member States. For example, the emission factor for the nutrients is based on loads to surface water as supplied by thirteen Member States. The more Member States that supply this information, the more accurate the calculations will become. Also the supplied information about the type of treatment and the loads to the UWWTPs is important. The reliability of the quantification method for this source is in that way dependent on the reliability of the reported Member State data.
The emission factors for heavy metals and PAHs might be improved when using measurement data from more Member States. Now only measurement data from the Netherlands are used, supplemented with E-PRTR data for the heavy metals. For the PAHs, there is less information available in E-PRTR, and only data from the Netherlands have been used.
It was not possible to calculate loads to surface water for the four EFTA countries, Norway, Switzerland, Iceland and Liechtenstein. Information about the number of UWWTPs, the coordinates and the capacity was not available. To fill these gaps, this information has to be provided by these four EFTA countries.
Industry The quantification for industry is an exploratory case study. It shows that non E-PRTR emissions from industrial sectors can be estimated. The case study for the paper industry indicates that the non PRTR facilities may contribute substantially to the total emissions of the paper and pulp industry. But to come to a reliable estimate, detailed information on production processes, water treatment technology and employee numbers (as indication for the production capacity) are required. The exercise showed that even for such a relatively “uniform” sector the required data are not available at EU level so no maps could be generated at this moment. Possible solutions for some of the observed obstacles to use the proposed method are:
Lower capacity- and/or emission thresholds in the E-PRTR reporting obligations. As a result of this more reported emissions can be expected. If it is realistic to change the reporting requirements, the advantages of a more complete overview of emissions for a certain sector or for the industry as a whole, has to be weighed against the efforts of extra administration due to changed reporting requirements, increased monitoring budgets and other practical barriers.
Diffuse water emissions in E-PRTR - Project report
1205118-000-ZWS-0016, 2 July 2013, final
38 van 102
Include water consumption and releases in the E-PRTR reporting obligations. This would also be very useful in itself for water accounts and will indirectly enable calculation of pollutant concentration in the releases. It will not mean a very dramatic increase of monitoring requirements because it is expected that most industries do already have monitoring data about water consumption and releases.
In case the data on water consumption and releases (as mentioned in the bullet above) can not be made available, an option would be to include pollutant concentrations in the E-PRTR reporting obligations. Although this would be very useful to improve the quantification of discharges caused by industrial activities, it seems not very realistic to expect such a radical expansion of the reporting requirements.

1205118-000-ZWS-0016, 2 July 2013, final
Diffuse water emissions in E-PRTR - Project report
39 van 102
6 Conclusions and outlook
6.1 Conclusions The main conclusions that can be drawn from the activities carried out in this project are listed below: Data concerning emissions of diffuse sources are often related to specific or even local projects which are not easily scaled-up to a European level. A large part of the performed research is not published and is only available as “grey literature”. Most studies lack transparency on the quantification methods and the reliability of the underlying data (see paragraph 2.2 and 5.1). The official Member State reports on diffuse sources are limited and mainly related to reporting articles in a few Directives (see paragraph 2.2). The most important bottleneck encountered in this project is the overall lack of transparent, consistent, comparable and actual data concerning emissions of diffuse sources, emission factors and statistical data covering all EU27 Member States and EFTA countries (see paragraph 5.1). This has also been confirmed by the results of the questionnaire (see paragraph 2.5) and the workshop (see paragraph 2.6). Conclusion 1: The data concerning emissions of E-PRTR diffuse sources are of limited use scaling up to a European level. In many Member States work on diffuse emissions is in progress. Studies are, however, not yet finished and published (see paragraph 2.2). There was a good response to the questionnaire (14 responses) and also good participation in the workshop (31 participants from 20 countries). A relevant number of Member States (9) indicate they would like to put effort in comparing the project results with their national maps (see paragraph 2.5 and 2.6). Conclusion 2: Member States show interest in the quantification of emissions of diffuse sources. The diffuse emissions data reported in those WFD River Basin Management Plans that could be checked, is very scarce. Even Member States which have carried out much research and modelling do not succeed in reporting on this item in the WFD reports (see paragraph 2.2). This is confirmed by the results of the questionnaire. It seems to be difficult for Member States to report diffuse emissions data because these data are less reliable than point source data and less easily available. Although the information is generally public, in practice many restrictions and limitations do exist. Member States indicate the possibility of charges to be paid for data delivery, the need for official data requests and restrictions on delivery of specific data related to confidentiality of information concerning production capacities, number of employees and budgets of industrial sectors/activities (see paragraph 2.5). Conclusion 3: Many Member States hesitate to report diffuse emissions data, possibly reflecting the limited reliability of their data.

Diffuse water emissions in E-PRTR - Project report
1205118-000-ZWS-0016, 2 July 2013, final
40 van 102
The scheme presented in the ‘Priority Substances Emission Inventory Guidance’ has been used as a common basis for the definitions of sources and pathways within this project (see paragraph 2.1). Valuable activities in the field of diffuse sources are carried out by the JRC on nutrients and emissions of agricultural sources and by the EEA on UWWTPs (see paragraph 5.1). Conclusion 4: Activities in the field of diffuse water emissions carried out by EC working groups and bodies like the JRC and EEA are considered very useful. This project has selected particular substances for which emissions have been quantified. The choice of substances is based on water quality problems related to these substances, the link with the selected key sources, the availability of data and the reliability of emission factors and monitoring data (see paragraph 2.3 and 2.4). A number of the substances first selected (see Table 2.1) were de-selected at a later stage mainly because the lack of reliable data at an EU-scale (pesticides), unreliable monitoring data (Nonylphenols and DEHP) and the wide variation in emission factors (some of the PAH) (see paragraph 2.7). For the definition of the emission sources and pathways, the general scheme of the ‘Priority Substances Emission Inventory Guidance’ (EC, 2012) has been used (see paragraph 2.1). The selection of the emission sources has been primary based on the importance of the source: i.e. the estimated contribution of that source to the total emissions to surface water for the selected substances (see paragraph 2.2). The final selection of sources was based on data availability, data reliability, the results of the questionnaire and the outcome of a workshop with Member States (see paragraph 2.5, 2.6 and 2.7). Despite the lack of data related to diffuse emissions, the project succeeded with a first rough quantification of the emissions of a number of hazardous substances from key sources based on relatively simple, but transparent methods and existing model results (see paragraph 5.1). Conclusion 5: In the project, eleven “problem” substances and seven emission “key sources” were selected, resulting in forty source-substance combinations, for which the diffuse emissions are quantified and maps have been produced. It is concluded that the quantification of industrial emissions that are presently not included in the E-PRTR is not possible without intensive additional research and data collection and is therefore not feasible within this project. Based on this, it was decided just to report a case study for the industry (see paragraph 2.6). Conclusion 6: In this project, a quantification of industrial emissions was not possible and a “case study” for industry has been worked out.

1205118-000-ZWS-0016, 2 July 2013, final
Diffuse water emissions in E-PRTR - Project report
41 van 102
The results of the quantification confirm the widespread perception that diffuse emissions are responsible for a significant part of the total load discharged to surface water (see paragraph 1.1 and 4.1). The quantified loads range from about half the E-PRTR load for TOC up to eight times higher for Nutrient-N. The highest contributors of those diffuse sources considered in this project are from Agriculture and from “UWWTPs not in E-PRTR” (see paragraph 4.2). Conclusion 7: The quantified loads of diffuse sources are high compared to the point source loads presently included in the E-PRTR. The project results show that diffuse sources have a significant and sometimes a major contribution in the total loads Even for the well known and relatively well measured substances like the nutrients (TOC, Nutrient-P and Nutrient-N) the E-PRTR seems only to cover about half of the “real” total loads (the sum of the present E-PRTR and the “extra” UWWTP loads quantified in this project). For other substances, coverage by the E-PRTR seems even lower with an extreme low value of 7% for Fluoranthene (see paragraph 4.2). In the fact sheet, gap-filling of the large UWWTPs (> 100.00 p.e.), which are above the E-PRTR reporting threshold, has been carried out, as well as gap-filling of the smaller UWWTPs (< 100.000 p.e.), which are below the E-PRTR reporting capacity threshold. Conclusion 8: There is a remarkably high contribution from “UWWTPs not in E-PRTR” when compared with “UWWTPs in E-PRTR”. In general, the real emissions from most of the diffuse sources are strongly dependent on specific, local or regional differentiated geological, hydrological and climatological circumstances which are variable in time. Every method for the quantification of these diffuse sources will be a simplification of the real situation in the individual Member States and may be improved with the use of Member State specific data (see paragraph 5.1). The recommendations for improvement are related to the spatial allocation (see paragraph 5.2) and related to the specific emission sources (in total 26 improvements have been described). Conclusion 9: The results of this project must be regarded as a first step in the quantification of the hazardous substance emissions from key EU sources: many steps for improving the quantification methods are suggested.
6.2 Outlook This project has to be regarded as an important step in the process to quantify diffuse sources. The project results show that E-PRTR diffuse sources have a significant and sometimes a major contribution in the total loads (the sum of E-PRTR loads and loads quantified in this project) to the surface water and therefore might be still a major barrier to meeting the water quality goals of the WFD. On the other hand, the project also shows that it is feasible to quantify the diffuse emissions of a number of key sources and problem substances. Whilst this project has been initiated by the EC to support Member States, action by Member States will be needed to improve the quantification methods and to expand the scope to other sources and substances. Finally, the Member States are responsible for the inventories of emissions.
Conclusion 10: Sharing knowledge, data and information is necessary to avoid double work and to make steps towards harmonising quantification methods for diffuse sources.

Diffuse water emissions in E-PRTR - Project report
1205118-000-ZWS-0016, 2 July 2013, final
42 van 102
In this light, it is suggested that:
The EC, to keep playing a facilitating and stimulating role in the process of the quantification of diffuse water emissions;
The EC, to take additional initiatives under the umbrella of the CIS Working Group E on Chemical aspects, like the establishment of a Working Group on the harmonisation and quantification of emissions of diffuse sources in close cooperation with the JRC and the EEA. Other recommended actions include:
Organise meetings for the quantification of diffuse water emissions and the harmonisation of definitions and methods;
Stimulate involvement of European / international water associates with specialist groups on diffuse water pollution;
Set up a database to exchange information concerning emission factors;
Create a (internet or social media) platform for sharing information, data and knowledge of the quantification of diffuse water emissions.
Member States, to actively share information about projects, activities, data and methods about the quantification of emissions of diffuse sources;
Member States, to participate in international working groups, River Basin Committees and discussions about diffuse water emissions;
Member States, to report on diffuse water emissions in official requests, even when the emissions have a limited reliability.

1205118-000-ZWS-0016, 2 July 2013, final
Diffuse water emissions in E-PRTR - Project report
43 van 102
7 References
EEA, 2009: EEA Emission Inventory Guidebook 2009 (url: http://www.eea.europa.eu/ publications/emep-eea-emission-inventory-guidebook-2009/#, 02.07.2010).
EC, 2000. Directive 2000/60/EC of the European Parliament and of the Council establishing a
framework for the Community action in the field of water policy. EC, 1991. Council Directive 91/271/EEC of 21 May 1991 concerning urban waste water
treatment as amended by Commission Directive 98/15/EC and Regulations 1882/2003/EC and 1137/2008/EC.
EC, 2006. Regulation (EC) No 166/2006 of the European parliament and of the council of 18
January 2006 concerning the establishment of a European Pollutant Release and Transfer Register and amending Council Directives 91/689/EEC and 96/61/EC.
EC, 2012. Common Implementation Strategy fort he Water Framework Directive
(2000/60/EG), Guidance document No. 28, Technical Guidance on the Preparation of an Inventory of Emissions, Discharges and Losses of Priority and Priority Hazardous Substances, Technical Report – 2012 – 58.
E-PRTR, 2012. The European Pollutant Release and Transfer Register pollutant releases
database, year 2010, 23-10-2012 (url: http://prtr.ec.europa.eu/PollutantReleases.aspx). EUROSTAT, 2008. EUROSTAT Economically active population, 2008: Economically active
population by sex and age, at NUTS levels 1, 2 and 3 (1000) from EUROSTAT for 2008 (EUROSTAT [lfst_r_lfp3pop] (url: http://appsso.EUROSTAT.ec.europa.eu/nui/ show.do?dataset=lfst_r_lfp3pop&lang=en, 10.12.2010).
ICPR, 1999. Bestandsaufnahme der Einträge prioritärer Stoffe 1996, International
Commission for the Protection of the Rhine. ICPR. 2003. Bestandsaufnahme der Emissionen prioritärer Stoffe 2000, International
Commission for the Protection of the Rhine. IER, 2011, Theloke et al. (2011): Methodology development for the spatial distribution of the
diffuse emissions in Europe (url: http://circa.europa.eu/Public/irc/env/e_prtr/ library?l=/ diffuse_releases_e-prtr/methodology_2011/_EN_1.0_&a=d).
NSC, 2002. Fifth International Conference on the Protection of the North Sea 20-21 March,
Bergen, Norway. Progress Report. SFT, 2000. Development of HARP Guidelines. Harmonised Quantification and Reporting
Procedures for Nutrients. Norwegian Pollution Control Authority (SFT). Rep. No. 1759. SFT, 2001. Harmonised Quantification and Reporting Procedures (HARP-HAZ Prototype).
Norwegian Pollution Control Authority (SFT). Rep. No. 1789. UNFCC, 2004. Guidelines for the preparation of national communications by Parties included
in Annex 1 to the Convention, 2004.

Diffuse water emissions in E-PRTR - Project report
1205118-000-ZWS-0016, 2 July 2013, final
44 van 102
UWWTD, 2012. Waterbase – UWWTD: Urban Waste Water Treatment Directive, December
06, 2012 (url: http://www.eea.europa.eu/data-and-maps/data/waterbase-uwwtd-urban-waste-water-treatment-directive).
WISE, 2011. WISE River Basin Districts (RBDs) and/or their subunits (RBDSUs), Version 1.4
(06/2011) (url: http://www.eea.europa.eu/data-and-maps/data/wise-river-basin-districts- rbds-1, 20.12.2013).
Wickert, 2001: Wickert B. (2001): Berechnung anthropogener Emissionen in Deutschland für
Ozonsimulationen: Modellentwicklung und Sensitivitätsstudien. Dissertation. IER, Universität Stuttgart, Stuttgart.

1205118-000-ZWS-0016, 2 July 2013, final
Diffuse water emissions in E-PRTR - Project report
A-1 van 102
A Questionnaire


1
Questionnaire for collecting information on Diffuse Emission to Water in the frame of the E-PRTR project
The following questionnaire has been developed in the context of the project "Diffuse Water Emissions under the E-PRTR" with the purposes of:
Engaging Member States in the development of a methodology for compiling gridded maps of diffuse water emissions under the E-PRTR.
Gathering specific information on available datasets from Member States and consulting with them on the results so far obtained.
The questionnaire addresses two main topics: 1) Member States' specific maps for diffuse emission to water, and 2) Member States' specific proxy data sets (underlying background data). Please fill in the questionnaire and send it to [email protected] by 25 May 2012. Q0. Please provide, contact details for any further enquiries. Name: E-mail: Phone number: Role / organisation: Q1. Is there in your Member State any available GIS layers/spatially resolved information on water releases from diffuse sources?
No. Yes. These are available on the Internet at: http:// Yes. These are not yet available online but could be made available for comparison
purposes. If yes, please fill in the table below
Ref. Ares(2012)566137 - 08/05/2012

2
Table 1: List available GIS layers/spatially resolved information on water releases from diffuse sources for PAHs, metals and nutrient pollutants
Pollutants* (PAHs, metals, nutrients and organic pollutants):
please tick all that apply
Most detailed resolution available (e.g. River basin (sub) district, 5x5 km)) Sectors
PAHs Metals Organic pollutants Nutrients
Road traffic, rural areas
Road traffic, highways
Inland navigation
Urban wastewater treatment plants
Residences not connect to urban sewer systems
Agriculture
Atmospheric deposition
*See Table 2 for a complete list of pollutants Table 2: Overview of all pollutants
Pollutant group Pollutant
Alachlor
Atrazine
DEHP (bis(2-ethylhexyl) phthalate)
Diuron
HCH (Hexachlorocyclohexane; alpha and gamma)
Octylphenol
Organic pollutants
Total organic carbon (TOC)
Nutrient-N Nutrients
Nutrient-P
Anthracene
Fluoranthene
Benzo(a)pyrene
Benzo(b)fluoranthene
Benzo(k)fluoranthene
Benzo(ghi)perylene
Polycyclic aromatic hydrocarbons (PAHs)
Indeno(1,2,3cd)pyrene
Antimony
Arsene
Cadmium
Chrome
Copper
Lead
Mercury
Nickel
Selenium
Metal pollutants
Zinc

3
Do you have any methodology papers available that describe the methods used to derive spatial information for your emission maps?
No Yes. These are available on the Internet at: http:// Yes. These are not yet available online but could be made available on request
Please also indicate language of the reports: Q2. Do your national emission maps take point sources into account?
No Yes.
If yes, please provide a short description of how point sources are incorporated into the spatially-resolved maps. Please specify any differences between sectors/pollutants covered by this project and by your national layers: Q3. Would you be available to review the grid maps produced under this E-PRTR project for your Member State e.g. by comparing them to your own national emission maps?
No Yes (If the contact name for this is different to the name given in question 0, please
specify who should be contacted for such a review)

4
Q4. Please, indicate the availability in your Member State of the following statistical datasets which could be helpful for compiling spatially resolved (river basin (sub)district) maps of emission releases to water.
Available at national level?
Available as a spatial dataset?
Brief description/ resolution of
available spatial datasets
etc
Statistic field Sector
Yes No Yes No Activity data (national statistics or derived from transport models), per road type and vehicle type
Population data (per administrative unit) Road network and traffic density data
Road traffic
Administrative boundaries data Activity data of inland navigation (river network traffic volume data)
Information on accessibility of inland waterways
Inland navigation
Modelled air concentrations and depositions and spatial distributed data
Atmospheric deposition
Livestock density and crop harvest statistics on regional scale (e.g. NUTS3)
Agricultural land use statistics (land use data, land cover data)
Agriculture
Facility data of UWWTPs (location, size, spatial distribution)
OECD water statistics (e.g. population connected to sewer systems)
Population data and European population density maps (statistical information on population data per administrative unit, degree of urbanization)
Data of effluent monitoring (concentrations of effluents)
Urban wastewater treatment plants and residences not connected to sewer systems
Please add any other sector you consider relevant
Please, specify an internet URL or contact person to get access to these datasets. Q5. Regarding the following sources of proxy data (in Q4) needed for the project could you please specify under which conditions you can provide them, if available? Q6. Do you have any suggestion regarding other proxy data which could be useful for compiling maps of diffuse emissions to water of pollutants in Annex 2 to this letter?

5
Q7. For a number of specific items mentioned in the factsheets, we would like to have Member State specific information when available. This information will be used to improve the estimation methods of the different sources. Could you please provide information on:
• Inland navigation: o Application of different types of coating in the current fleet (PAH-coating,
bitumen coating, epoxy coating or other); o Percentage of collection of bilge water wastewater of inland navigation in
harbours; • Un-connected households:
o Average percentage of discharges (to surface water and to soil) of households not connected to the sewer system and without any individual treatment;
o Average percentage of discharges (to surface water and to soil) of households not connected to the sewer system and with individual treatment (e.g. septic tank);
o Average removal efficiency achieved by individual treatment for nutrients, heavy metals and PAHs;
• Road transport: o Average percentage of discharges (to surface water and to soil) from
highways and rural roads; o Average percentage of discharges from highways and rural roads that is
collected and/or treated; o Average removal efficiency to be expected in case of simple treatment.
Q8. Suggestions and comments on items others than the above mentioned.


1205118-000-ZWS-0016, 2 July 2013, final
Diffuse water emissions in E-PRTR - Project report
B-1 van 102
B Minutes of the workshop


Minutes Date minutes 20 September 2011
Project 1205118-000
Made by Joost van den Roovaart
Date meeting 13 September 2011
Number of pages 6
Meeting Inception Meeting Project Diffuse Water Emissions in E-PRTR Contract no 070307/2011/601270/SER/C3 Present Steering Committee Project Diffuse Water Emissions in E-PRTR, Peter Coenen (TNO), Jochen Theloke (IER), Melinda Uzbasich (IER)
Inception Meeting Diffuse Water Emissions in E-PRTR
11.00 - 11:20 Participants’ introduction and background of the project (Dania Cristofaro)
Attending:
o Dania Cristofaro (DG ENV)
o Alex Radway (DG ENV), (interim)Manager of the project
o Helen Clayton (DG ENV Water)
o Bernd Gawlik (JRC)
o Eva Goossens (EEA)
o Rob Collins (EEA)
o Peter Coenen (TNO)
o Joost van den Roovaart (Deltares), project manager
o Jochen Theloke (IER)
o Melinda Uzbasich (IER)
Dania will leave DG Industry and the interim project officer will be Alex Radway. In November he will be succeeded by a new employee of the Commission, who is supposed to take over the management of this project..
Key messages from the Commission (Dania Cristofaro):
o There is a legal obligation to produce data on diffuse emissions and inform the general public.
o Therefore this project should produce maps and explanations on ” what you see” and how they were compiled.
o Engagement of MS is needed because they must be able to reproduce such information in the future. The MS interaction with the project will stimulate their actions to improve data on diffuse emissions to water.

Date 20 September 2011
Page 2/6
o If there is a possibility within the project the Commission suggests a comparison of the project data with MS data as was done in the Air emission project of IER. During the project the consortium will look for opportunities to do so (depending on available resources and cooperation of MS).
o The above action (if possible) may contribute to the acceptance of the results of the project by the MS which is an important precondition of the project.
o The project results can be presented in the Green Week 2013.
After this introduction by the Commission the consortium presented their proposal for the work under the different tasks by means of the attached PDF of the power point presentation. The following summarises, task by task, the discussion on the suggestions presented by the consortium and the conclusions made. 11:20 - 11:45 Introduction to the project - aims, management (Joost van den Roovaart)
The Steering Committee (SC) agrees with the presented scope and aims of the project. Some relevant remarks were added:
o Be clear on the source categories which are covered by the project. Use the language which is now developing in the WFD Working group on Chemical aspects/Drafting Group of the Guidance Document on Emission Inventories of Priority Substances.
o Use where possible EU models, to what detail must be agreed upon with the Steering Committee.
11.45 - 12:45 Presentation Task A: Methodology Development and discussion (Joost van den Roovaart)
o Subtraction of E-PRTR point sources from national datasets
For diffuse water emissions, this item is not as relevant as for air emissions, because no complete/consistent/harmonized (national) totals are reported for water by the MS.
May be relevant for smaller UWWTPs (Urban Waste Water Treatment Plants) not reporting under E-PRTR.
Where necessary the project will define a method based on the experience of the air emission project.
o Estimation of diffuse releases
The consortium will develop a general method, making use of methods already in place in different MS or at an international level.
The project will use a tiered approach (zoom-in concept).
Date 20 September 2011
Page 3/6
Where possible use already available pan European model results (N, P maps and pesticides risk assessments from JRC) and/or EEA analysis (UWWTP).
o Matrix pollutant source combination
The presented matrix for the Netherlands is very illustrative. First task in the project will be to generate such matrix for the EU MSs. This matrix will be included in the questionnaire to the MS in October/November.
o Problem substances and key sources:
Nutrients: use work of JRC, especially for agriculture;
Heavy metals: agriculture, building materials, traffic;
PCB’s: atmospheric deposition;
PAHs: atmospheric deposition, traffic, shipping;
Pesticides: agriculture
Difficult to assess. The project will investigate what guiding pollutants could be elaborated.
The use of Risk maps as prepared by the EEA seems a good fall back option to guarantee that a map for pesticides can be shown.
The consortium will consider the use of “indicator pollutants” as suggested by the Steering Committee. These substances might be selected because they speak for a wider group of substances (for example pesticides).
Key sources:
Industry: The Commission understands the problems of estimating the emissions from industry not reporting to E-PRTR, but requests to investigate if there are subsectors in industry for which relevant emissions can be expected (e.g. food industry in the Netherlands). This is only possible if national total emissions to water exist for these specific industrial sectors.
Mining: Many MS report historic mine sites, these will also be explored in the project.
Also the project will explore the possible use of OECD estimating methods.
UWWTPs: The emissions from smaller (not E-PRTR) UWWTPs and the “not reported” (incorrectly missing) emissions from specific substances of the E-PRTR UWWTPs are an interesting source that can be estimated with existing emission factors.
Un-connected households: An interesting source in a lot of MS. The potential of estimating this source will be explored.

Date 20 September 2011
Page 4/6
Stormwater overflows and separate sewer discharges: Both can be estimated in combination with the UWWTP emissions. The consortium is aware of the danger of double counting when estimating emissions from storm water overflows and UWWTPs and will deal with this appropriately.
Road transport: The project will look if enough data is available to develop an EU wide methodology.
Shipping: because emissions in coastal waters (RBD) are also covered by the Water Framework Directive, shipping is an interesting source for some pollutants.
Special attention will be given to the presentation in the maps (RBD and International RBD will have to be linked via colour codes).
Railways: This source is also mentioned as a possible source but the consortium does not think these constitute a relevant source for water emissions (emissions go to the soil)
JRC and EEA will transfer (links to) available documents and data bases to check the relevant emissions and sectors
Atmospheric depositions (directly to surface water) will be modelled at EU level and than checked with MS.
Agriculture: This is a major source for both nutrients, heavy metals and pesticides. Especially for nutrients, data on EU level seems available.
The project will not be able for a given substance to calculate/estimate the “total” diffuse emissions. The project will, where possible, establish a “plausibility” check on the estimates calculated.
In general: If there is a relevant source not taken into account in the project, then the reason why, will be documented.
13.45 - 14:30 Presentation Task B: Data Gathering and discussion (Peter Coenen)
Most discussions on this item were already covered in the discussions before lunch.
On the reporting years: the project will use most recent available data (Final reported emissions and data sets up to 2009).
Eurostat was also mentioned as a possible data source.
Area coverage EU31 (EU27+EFTA).
EEA will deliver updated RBD boundaries to the project.
A small OECD group which is dealing with diffuse sources/emissions meets in October: draft matrix pollutant/source categories should be ready for this meeting.

Date 20 September 2011
Page 5/6
Not all MS data will be complete. Gap filling will be necessary. The results shall be presented to MS for comments.
14.30 - 15:15 Presentation Task C: Data processing spatial allocation and publication of emission maps and discussion (Jochen Theloke)
The subtraction method was not presented because it will be probably not be needed in the project.
The project will establish access to all data on the server at Stuttgart University as in the earlier Air project.
Performance test is needed in the beginning of the project: EEA (Eva) will draft specifications for the exact data format.
Regarding the data layers: input raster files will be converted into vector files if necessary. All specifications shall be included in the data description and the methodology report
o e.g. JRC data have often gridded data sets available as raster or vector based data sets.
The project will make available all gridded layers and files (datasets from start to final maps).
EEA will deliver updated RBD boundaries.
Spatial allocation of emissions: the initial discussion on this point highlights the need to consider various approaches depending on the type of sources. The intention of the consortium is to generate all data sets in this project as gridded vector data sets.
The consortium will include a proposal in the Inception Report regarding the spatial resolution of the proxy data and emission values.
15.15 - 16:00 Presentation Task D: Complementary and cross-cutting actions (Joost van den Roovaart)
The Questionnaire will be distributed to COM, EEA and JRC using relevant mailing lists:
o COM – PRTR, PRTR international and Working group E on chemical aspects;
o EEA – EIONET group on water;
o JRC – to be investigated;
The COM will send official invitation for questionnaire (to be developed by the consortium), we could use surveymonkey® (online questionnaire).
In the next few weeks a draft selection of available data will be made by the consortium.
A first selection of sources and substances will be included in the Inception Report and in the questionnaire.
16:00 – 17:00 Remaining issues and wrap up

Date 20 September 2011
Page 6/6
o In this project it is very important to document the choices made and the final methodologies as these will be different from the well evolved methods for air pollution.
o Reasons why and which choices were made in the development of the methodologies should be documented including the proxies and data used.
TIME SCHEDULE
o 6 October 2011– Inception Report including draft matrix of data inputs with detailed references (both emissions data, models and proxy to be used);
o Oct/Nov 2011– Letter to be prepared by Deltares to inform member states about the project and questionnaire to gather their views (please adapt slides 14, 17 and 18 to EU level and include them in the letter);
o Draft methodology: January 2012;
o Steering committee meeting in February to discuss the methodology report and prepare the workshop with MS. Preferably at JRC to introduce the consultants to the data info structure available there;
o 15 May 2012: MS Workshop;
o 6 July 2012: Final methodology report incorporated in interim report: after the workshop;
o 6 October 2012: Maps + web texts + Steering meeting at EEA;
o 6 December 2012: Draft Final report;
o 6 February 2013: Final report, and closure of the contract.
Enclosures PDF of the powerpoint presentation of the consortium

1205118-000-ZWS-0016, 2 July 2013, final
Diffuse water emissions in E-PRTR - Project report
C-1 van 102
C Factsheets
C.1 Agriculture Introduction Agriculture is a known major source for nutrients, heavy metals and pesticides. Estimating emissions from this source is very complex, through interaction with soil and air. In addition, emissions are strongly influenced by regional and local conditions such as soil type, crop type, fertilizer, etc. Therefore, to quantify this source often models are used. Within this project use of applied modelling, available on a European scale is preferred. Existing maps and background information of JRC are used for the quantification and spatial allocation of this pathway. In Figure 1 the Nitrogen and Phosphorus flows in agricultural systems and emissions to compartments, including surface water, are shown.
Figure 1 N, P and carbon flows in agricultural systems and emissions to the atmosphere, groundwater and surface
water [1]. This factsheet describes a way to allocate the emissions to the European River Basin Districts by using model results for Nutrient-N and Nutrient-P. This source includes emission released by agricultural activities as animal husbandry and manure management, crop production and agricultural soils. The main pollution sources are animal waste digestion (grazing animals), fertilization, livestock farms and field operation.

Diffuse water emissions in E-PRTR - Project report
1205118-000-ZWS-0016, 2 July 2013, final
C-2 van 102
Explanation of the calculation method The nutrient emissions are calculated by the of the JRC’s GREEN model. The GREEN (Geospatial Regression Equation for European Nutrient losses) is based on a simplified conceptual approach distinguishing the different pathways in which nutrients reach surface waters. According to this approach, diffuse sources, including fertiliser applications (both mineral and organic forms), scattered dwelling, atmospheric deposition, are first reduced in the soil matrix and then once in the stream they undergo further reduction due to in-stream retention processes, while point sources, which include waste water treatment plants, industrial effluents and runoff from paved areas, reach directly the streams and are thus reduced only by the stream retention process. In the model, the driver behind the nutrient losses is the annual precipitation and the retention in water is linked to the river length. In this project only the Nutrient emissions of agricultural sources are used: the fertilizer applications. The application of mineral fertiliser and manure varies considerably across European regions according to the production system, crop types, climatic conditions and soil characteristics. A reasonable estimation of fertiliser application at European level should consider these spatial variations. The nutrient inputs from agriculture were estimated based on the Corine Land Cover map and the fertiliser rate by NUTS2 region and by crop type. In the first application of the model GREEN [4], the proportion of crop types per NUTS2 region, available in EUROSTAT, was considered within each arable land class of the CLC2000, respecting the total surface of arable land reported by the map, and the mineral and organic fertiliser application rate per NUTS2 region and per crop type was provided by the CAPRI project [5]. In the second application of the model GREEN, the nutrient inputs from agriculture were estimated using the CLC2000 and the FSS data on crop types and surface, respecting the total surface of arable land reported by the FSS database, and fertiliser rate calculated from International Fertiliser Association, FSS and OECD data. The second approach was developed in the context of the estimation of a spatially displayed nutrient balance for Europe. Details on the methodology are given in [4]. Activity rates Not applicable. The activity rates are already taken into account in the model calculations. Emission factors Not applicable. The emission factors are already taken into account in the model calculations. Emissions Table 1 contains emission values of Nutrient-N and Nutrient-P calculated by the JRC’s Green model. The emissions are expressed as loads to surface water.

1205118-000-ZWS-0016, 2 July 2013, final
Diffuse water emissions in E-PRTR - Project report
C-3 van 102
Table 1 Loads to surface water from agriculture per Member State for Nutrient-N and Nutrient-P (t/y) in 2005.
Member State*
Nutrient-N
Nutrient-P
ton/y Austria 57 792 4 344 Belgium 49 202 753 Bulgaria 50 094 1 611 Cyprus 726 20 Czech Republic 71 323 1 577 Denmark 103 932 2 223 Estonia 3 959 46 Finland 21 417 500 France 464 013 6 485 Germany 251 445 5 016 Greece 65 326 2 510 Hungary 40 004 1 214 Ireland 222 797 4 461 Italy 311 570 17 371 Latvia 32 983 158 Lithuania 32 983 725 Luxembourg 2 634 38 Netherlands 124 799 1 141 Norway 56 739 1 592 Poland 198 245 6 141 Portugal 7 645 34 Romania 122 524 7 452 Slovakia 18 438 671 Slovenia 21 169 1 995 Spain 110 577 4 599 Sweden 50 406 820 Switzerland 71 651 3 406 United Kingdom 555 904 12 572
*= no calculations were made for Malta, Liechtenstein and Iceland. Spatial allocation Diffuse emissions of Nutrient-P and Nutrient-N from agriculture to surface water were spatially allocated to the RBDSU level by the JRC based on the methodology described by Fayçal Bouraoui et al [2]. The diffuse emissions coming from fertilizer application were allocated to the RBDSU spatial level using GIS visualisation techniques. The main proxy data used for the spatial allocation of the nutrients to the RBDSU level [6], where the land use data, the fertilizer application rates from CAPRI [5] and population statistics [2, 3]. Emission pathways to water Not applicable. The model results are already calculated as discharges to surface water.

Diffuse water emissions in E-PRTR - Project report
1205118-000-ZWS-0016, 2 July 2013, final
C-4 van 102
Literature [1] Directive 2005/69/EC of the European Parliament and of the Council, (http://eur-
lex.europa.eu/LexUriServ/LexUriServ.do?uri=OJ:L:2005:323:0051:0054:EN:PDF). [2] Bouraoui, F., Grizzetti, B., Aloe, A., Nutrient discharge from rivers to seas for year
2000, In: JRV Scientific and Technical Reports, 2009. [3] Bouraoui, F., Grizzetti, B., Aloe, A., Spatialised European Nutrient Balance EUR
Report 22692 EN., 2007. [4] Grizzetti, B.,Bouraoui, F., Assessment of Nitrogen and Phosphorus Environmental Pressure at European Scale, EUR Report 22526 EN, 2006. [5] Britz, W., 2004. CAPRI Modelling System Documentation, Final report of the FP5
shared cost project CAP-STRAT "Common Agricultural Policy Strategy for Regions, Agriculture and Trade", QLTR-2000-00394. Universität Bonn.
[6] WISE River Basin Districts (RBDs) and/or their subunits (RBDSUs), Version 1.4
(06/2011) (http://www.eea.europa.eu/data-and-maps/data/wise-river-basin-districts-rbds-1 , 20.12.2013).

1205118-000-ZWS-0016, 2 July 2013, final
Diffuse water emissions in E-PRTR - Project report
C-5 van 102
C.2 Atmospheric deposition Introduction Atmospheric deposition can be described as the load of substances to surface water or soil via the atmosphere. Once emissions to air from sources (e.g. traffic, shipping, industries) have entered the atmosphere, the substances are distributed through the atmosphere and end up in the water and on the soil as a result of deposition in wet (precipitation) and dry form. This factsheet sets out a method for calculating the atmospheric load to surface water for Nutrient-N, Cadmium, Lead and Mercury. Explanation of calculation method The data on atmospheric deposition are derived from the Precipitation Chemistry Database of the Co-operative Programme for the Monitoring and Evaluation of the Long-Range Transmission of Air Pollutants in Europe [5]. The used datasets are based on the EMEP Unified model revision 1.7 on a 50 x 50 km grid. For the emissions per River Basin District Subunits (RBDSU), the following pollutants from EMEP model results were taken into account: Nutrient-N, cadmium, lead and mercury. The input data were available on the EMEP 50km x 50km grid cell level. The emissions per River Basin District Subunit area were calculated using following steps:
1. For this study, the EMEP 50km x 50km grids where intersected with the River Basin District Subunits (RBDSUs) using different GIS functionalities. Based on the available input data from EMEP, for each RBDSU, the total flux was calculated.
2. Calculation of the surface water area shares per RBDSU, where the surface is divided in a surface of water and not water (paved and unpaved) areas. The spatial data required for this purpose are described in section “spatial allocation”.
3. Calculation of the emission fluxes to the surface water per RBDSU based on the total EMEP fluxes per RBDSU (step 1) and the percentage of water surface (step 2) in the specific RBDSU.
Emission per RBDSU = Flux_RBDSU x Share_surface_water_RBDSU
Activity rates The percentage of surface water per RBDSU is the “activity rate” for the atmospheric deposition calculations. In Table 1 the inland surface water area per Member State and the percentage of the total area per Member State covered by surface water are shown [1, 2, 3]. For the Member States which designated also the coastal areas as a part of the River Basin Districts, also the atmospheric deposition on the coastal water is included in the calculation of the loads. Table 1 Area of inland surface water (km2) and the percentage of inland surface water per Member State.
Member State Area Inland Surface Water (km2)
Percentage of Inland Surface Water (%)
Austria 913.92 1.09 Belgium 241.91 0.79 Bulgaria 1 046.64 0.94 Cyprus 21.12 0.23 Czech Republic 668.01 0.85

Diffuse water emissions in E-PRTR - Project report
1205118-000-ZWS-0016, 2 July 2013, final
C-6 van 102
Member State Area Inland Surface Water (km2)
Percentage of Inland Surface Water (%)
Denmark 755.69 1.74 Estonia 2 190.78 4.83 Finland 53 749.09 15.95 France 3 919.63 0.61 Germany 4 990.21 1.4 Greece 1 323.92 1 Hungary 2 618.28 2.82 Iceland 8 897.63 8.67 Ireland 12 253.43 17.53 Italy 2 372.66 0.79 Latvia 2 764.13 4.28 Liechtenstein 4.03 2.5 Lithuania 1 753.40 2.7 Luxembourg 9.82 0.38 Malta 0 0.0 Netherlands 3 578.50 9.58 Norway 35 082.78 10.88 Poland 5 663.53 1.82 Portugal 739.49 0.8 Romania 7 145.30 3 Slovakia 340.90 0.7 Slovenia 102.68 0.51 Spain 3 493.75 0.69 Sweden 66 249.44 14.75 Switzerland 817.28 1.98 United Kingdom 7 521.68 3.08 Emission factors Not applicable. The emission factors are already taken into account in the model calculations. Emissions Table 2 shows the loads to the surface water on national level for the selected substances. Table 2 Loads to surface water from atmospheric deposition per Member State* in 2009 or 2010 (kg/y).
Member State
Cadmium
Lead Mercury Nutrient-N Unit
2009 2010 Austria 34 1 077 19 1 178 kg Belgium 12 384 5,1 393 kg Bulgaria 46 2 136 16 856 kg Cyprus 0,3 14 0,2 7,0 kg Czech Republic 32 907 16 841 kg Denmark 18 689 8,4 739 kg Estonia 76 2 584 37 1 935 kg Finland 559 16 723 450 17 179 kg France 98 3 954 49 4 316 kg Germany 204 7 458 77 8 169 kg Greece 62 2 972 37 1 026 kg Hungary 119 3 224 50 3 013 kg Ireland 207 7 251 168 7 712 kg

1205118-000-ZWS-0016, 2 July 2013, final
Diffuse water emissions in E-PRTR - Project report
C-7 van 102
Member State
Cadmium
Lead Mercury Nutrient-N Unit
2009 2010 Italy 86 3 621 42 3 961 kg Latvia 61 1 895 36 1 921 kg Liechtenstein 0,1 3,5 0,1 5,2 kg Lithuania 53 1 392 25 1 600 kg Luxembourg 0,4 14 0,2 13 kg Netherlands 207 7 201 69 7 711 kg Norway 422 12 955 418 8 121 kg Poland 425 7 955 123 6 555 kg Portugal 16 793 7,7 371 kg Romania 200 6 457 99 5 591 kg Slovakia 22 587 8,2 374 kg Slovenia 4,9 164 2,4 135 kg Spain 62 2 549 29 2 007 kg Sweden 679 22 836 592 20 613 kg Switzerland 23 836 15 1 170 kg United Kingdom 157 5 647 136 4 890 kg
*= no calculations were made for Malta and Iceland. Spatial allocation The spatial allocation of the gridded atmospheric deposition data from EMEP 50km x 50km level to the RBDSU level contains following steps:
1. Regionalization of gridded atmospheric deposition data from the 50km x 50km level [4, 5] to the RBDSU level. The regionalization is calculated based on the intersection (GIS functionalities) of the EMEP 50km x 50km level with the RBDSU-layer.
2. Calculation of the emission loads to the surface water based on the share of the surface water per RBDSU [6]. The surface water information is based on the CORINE land cover data [1,2,3].
Emission pathways to water Not applicable. The model results are already calculated as discharges to surface water. Literature [1] CLC90, 2010: EEA: CORINE Land Cover 1990 (CLC90)
http://www.eea.europa.eu/data-and-maps/ figures/geographic-view-of-corine-land-cover-clc90-switzerland , 02.07.2010.
[2] CLC2000, 2010: EEA: CORINE Land Cover 2000 100 m (CLC2000) -
http://www.eea.europa.eu/data-and-maps/data/corine-land-cover-2000-clc2000-seamless-vector-database. 02.07.2010.
[3] CLC2006, 2010: EEA: CORINE Land Cover 2006 Version 02/2010 (CLC2006) -
http://www.eea.europa.eu/data-and-maps/data/corine-land-cover-2006-raster , 02.07.2010.
[4] EMEP, 2005. Co-operative Programme for Monitoring and Evaluation of the Long-
Range Transmission of Air Pollutants in Europe. (URL: http://www.emep.int/ , 2012).

Diffuse water emissions in E-PRTR - Project report
1205118-000-ZWS-0016, 2 July 2013, final
C-8 van 102
[5] EMEP MSC-E: Meteorological Synthesizing Centre-East (URL: http://www.msceast.org/index.php?option=com_content&view=article&id=88&Itemid=29#bap, 2012).
[6] WISE River Basin Districts (RBDs) and/or their subunits (RBDSUs), Version 1.4
(06/2011) (URL: http://www.eea.europa.eu/data-and-maps/data/wise-river-basin-districts-rbds-1 , 20.12.2013).

1205118-000-ZWS-0016, 2 July 2013, final
Diffuse water emissions in E-PRTR - Project report
C-9 van 102
C.3 Inland navigation Introduction In this factsheet a method for the calculation of diffuse emissions resulting from inland navigation is provided. Inland navigation comprises shipping activities that are categorised in domestic as well as international navigation. Here, inland navigation is defined as all shipping (both domestic and international) activity on inland waters. Professional inland vessels cause emissions of PAHs, heavy metals and other substances resulting from the following sources:
Coatings (paint products applied to vessels): Ships’ outer hulls are fitted with coatings to protect against organisms growing on the hull. PAH-components and metals in the paint products leach out into the surrounding surface water, leading to diffuse emissions into surface waters.
Sacrificial anodes: Anodes are mounted on vessels to serve as corrosion protection for the portion of the ship under the water line. While the anodes are protecting the metal, they gradually dissolve, leading to an emission of metals (mostly Zinc, Aluminium and Magnesium) into surface waters.
Bilge water: Ships unintentionally collect bilge water (the bilge is the lowest compartment on a ship) while traveling. Bilge water is often contaminated with oil containing PAHs. Although boat owners are required to collect and deliver the bilge water, it is assumed that a certain amount still is discharged illegally, leading to diffuse emissions of PAHs into surface waters.
Sanitary wastewater: Wastewater is generated during household activities (mainly toilet use). It is assumed that all wastewater is being discharged to the surface water. This results in emissions of Nutrient-N, Nutrient-P and TOC into the surface water.
Explanation of calculation method The emissions are calculated for inland vessels. Emissions are calculated by multiplying an activity rate (AR), in the case of inland navigation the number of ton-kilometres (tkm; a ton-kilometre is one ton of cargo transported one km across the water) traversed by all professional vessels on inland waters within European Union (EU27 + EFTA countries), by an emission factor (EF), expressed in emission per AR unit. The calculation method is shown in the formula below:
Es = AR x EF Where:
Es = Emission of substance (pollutants) to surface waters
AR = Activity rate, in this case the traffic performance (distance covered on the EU surface inland surface waters in 106tkm) EF = Emission factor (kg/106tkm)
The emission calculated in this way is referred to as the total emission. Because all emissions are released directly into surface waters, the total emission equals the net emission to surface waters.

Diffuse water emissions in E-PRTR - Project report
1205118-000-ZWS-0016, 2 July 2013, final
C-10 van 102
Activity rates As activity rate is chosen the amount of ton-kilometres traversed in inland navigation because it is a well-known unit of measurement within transport, it represents activities of vessels on inland waters and because the data is available for most EU member states. There is no distinction in type of inland vessels. Emissions are calculated for the inland navigation sector as a whole, therefore the total amount of ton-kilometres per EU member state is required. Activity rates are produced per Member State. Table 1 shows the national (tkm traversed by the national fleet of the specific Member State in the Member State inland waters), international (tkm traversed by the international fleet in the specific Member State) and total amount (sum of national and international fleet) of ton-kilometres traversed by inland vessels from EUROSTAT [6]. Table 1 Amount of ton-kilometres (106tkm) per Member State [6].
Member State Amount of ton-kilometres (106 tkm) performed by all Inland navigation vessels in 2011[6]
National International Total Austria 88 2 035 2 123
Belgium 3 905 5 346 9 251
Bulgaria 42 4 268 4 310
Cyprus N.A. N.A. N.A.
Czech Republic 21 21 42
Denmark N.A. N.A. N.A.
Estonia N.A. N.A. N.A.
Finland N.A. N.A. N.A.
France 5 332 3 697 9 029
Germany 10 405 44 622 55 027
Greece N.A. N.A. N.A.
Hungary 4 1 836 1 840
Iceland N.A. N.A. N.A.
Ireland N.A. N.A. N.A.
Italy N.A. N.A. N.A.
Latvia N.A. N.A. N.A.
Liechtenstein N.A. N.A. N.A.
Lithuania N.A. N.A. N.A.
Luxembourg 0 305 305
Malta N.A. N.A. N.A.
Netherlands 12 154 34 124 46 278
Norway N.A. N.A. N.A.
Poland 106 55 161
Portugal N.A. N.A. N.A.
Romania 3 599 7 810 11 409
Slovakia 4 927 931
Slovenia N.A. N.A. N.A.
Spain N.A. N.A. N.A.
Sweden N.A. N.A. N.A.
Switzerland N.A. N.A. N.A.
United Kingdom N.A. N.A. N.A.
N.A.: not applicable

1205118-000-ZWS-0016, 2 July 2013, final
Diffuse water emissions in E-PRTR - Project report
C-11 van
The countries that have an ‘N.A’ listing are countries that are expected to have no inland shipping of significance and therefore negligible emissions from this sector. It is estimated that with the available data >95% of the emissions are covered. Emission factors In this section it is explained how the EU inland navigation emission factors are obtained. The data for the calculations were extracted from the PRTR of the Netherlands. The general applied method consists of dividing the emissions (based on international literature) by the amount of ton-kilometres traversed. Emissions and ton- kilometres used are documented in the Dutch ‘Coatings, inland navigation’, ‘Bilge water, inland navigation’, ‘Sacrificial anodes, inland shipping’ and ‘Sanitary wastewater, inland shipping’ [1, 2, 3 and 4]. These factsheets contain emissions that were calculated with data obtained from international literature sources. Therefore, it is assumed that the derived implied emission factors are suitable for the calculation of diffuse emissions in the EU. There is no distinction made between different types of inland vessels. To obtain emission factors per pollutant, emissions for all sources calculated in the mentioned factsheets were added up and divided by the amount of ton-kilometres in inland waters so that emission factors representative for all four sources summated are compiled. The results are emission factors for each pollutant in kg/106 km. Effects of policy measures In this section the effect of measures that influence the emission factors are discussed. All the effects of the measures mentioned have been incorporated into the emission factors. Coatings Under the Environmentally Hazardous Substances Act, use of PAH-based coatings has been prohibited since 1 July 1997 [5]. This means that virtually all inland vessels were protected with a PAH-based coating up until 1996. After this period, the usage of PAH-based coatings will have gradually been replaced by alternatives. It is assumed that, since 2000, the percentage of PAH coatings is constant at 12%. The rest of the coatings is either bitumen- (23%) or epoxy-based (65%) [1]. Sacrificial anodes There are no measures being taken that affect the use of sacrificial anodes; however, the technology in protecting ships from corroding continues to improve. There might be an increase in the usage of Aluminium anodes and impressed current systems, but this has not yet been incorporated into the calculations [2]. Zinc, as a pollutant, was because of a lack of reliable data not incorporated into the emission calculations. Additionally, Zinc constitutes less of a priority pollutant than PAHs. Bilge water Similar to sacrificial anodes discussed above, there is a continuing improvement in technology that reduces the amount of bilge water. This is accounted for by introducing a ‘technology-factor’ by which the emissions are reduced. This factor implies that over 50% of the bilge water production is prevented. Data about the collection of bilge water is not available for each Member State. For this project it is assumed a significant part of the bilge water is collected: 60% in 2010 [3].

Diffuse water emissions in E-PRTR - Project report
1205118-000-ZWS-0016, 2 July 2013, final
C-12 van 102
Sanitary wastewater No measures are reported for the emission of sanitary wastewater. Calculated emission factors In Table 2 and Table 3 the calculated emission factors are shown. Table 2 Implied emission factors (to surface water), inland navigation. Emission Factor
Pathway
Substance
(kg/106tkm)
Emissions to surface water
Fluoranthene 0.00154 Anthracene 0.000773 Nutrient-N 1.2 Nutrient-P 0.19 TOC 2.78
Table 3 Implied emission factors (to surface water), inland navigation, per emission source.
Emission source Substance Emission Factor (kg/106tkm)
Bilge water Anthracene 0.000036 Fluoranthene 0.000024
Coatings Anthracene 0.000737 Fluoranthene 0.00152
Sanitary wastewater Nutrient-P 0.189 Nutrient-N 1.2 TOC 2.78
Emission pathways to water Emissions from anodes and coatings result from contact of the ship with surface water, therefore these emissions are directly (for 100%) released into surface waters. Emissions of sanitary wastewater and bilge water are assumed to be partly collected and partly (illegally) released into surface waters. Collected bilge- and sanitary wastewater are treated; the pollutants therein are not released into the environment. The discharged part, however, is assumed to be directly released into surface waters. Emissions Table 4 contains emission values of the pollutants. The emissions are expressed as loads to surface water.

1205118-000-ZWS-0016, 2 July 2013, final
Diffuse water emissions in E-PRTR - Project report
C-13 van
Table 4 Loads to surface water per Member State from inland shipping (kg/y).
Member State
TOC
Nutrient-N
Nutrient-P
Anthracene
Fluoranthene
kg/year
Austria 5 902 2 548 403 1.6 3.3 Belgium 25 718 11 101 1 758 7.2 14 Bulgaria 11 982 5 172 819 3.3 6.6 Czech Republic 117 50 8 0.03 0.06 France 25 101 10 835 1 716 7.0 14 Germany 152 975 66 032 10 455 43 85 Hungary 5 115 2 208 350 1.4 2.8 Luxembourg 848 366 58 0.24 0.47 Netherlands 128 653 55 534 8 793 36 71 Poland 448 193 31 0.12 0.25 Romania 31 717 13 691 2 168 8.8 18 Slovakia 2 588 1 117 177 0.72 1.4
Spatial allocation The methodology of the spatial allocation of the emissions from inland navigation to the River Basin District Subunit level contains following main steps: 1. Regionalisation of the national emission values to NUTS3 level. 2. Gridding:
Calculation of the inland navigation emissions from navigable inland waterways (domestic shipping): First the traffic volume on the sections of the waterways in combination with the accessibility of the inland waterways is quantified. This information is available for traffic volume from TRANS-TOOLS and for accessibility of ship types to European inland waterways from the inland waterways institution of France (Voies Navigables de France [7]). Figure 1 shows the geographical course and accessibility of the inland waterways from VNF and Figure 2 the corresponding network where the traffic volume is covered by TRANS-TOOLS [8].
The traffic volume on specific waterway sections is used as an indicator for the emission quantity (proxy data).
The geo referencing of accessibility from VNF [7] is realized by using river network data from TRANS-TOOLS [8] in combination with the river geo data from e.g. EUROSTAT, GISCO [9]; Water-courses from EuroRegional Map v30: Hydrography (HYDR).
The combination of traffic volume data from TRANS-TOOLS with the accessibility of the inland waterways from VNF [7] and the geospatial inland waterways from river geo data were applied for the spatial allocation of emissions from shipping activities to the navigable rivers in Europe.
The gridding methodology used is similar to the methodology and described in IER 2011 [11].
3. Regionalisation of the gridded emission values to RBDSU level: Allocation of the gridded emission data to the RBDSU areas [12] based on different
ArcGIS and database calculation steps. The main proxy data sets are:
Traffic volume and accessibility of inland waterways [7]; Geo-referenced data for rivers [9].
Table 5 shows the applied proxy data sets used for the spatial distribution of the emissions from domestic shipping activities.

Diffuse water emissions in E-PRTR - Project report
1205118-000-ZWS-0016, 2 July 2013, final
C-14 van 102
Table 5 Proxy data sets used for the spatial distribution of domestic shipping activities.
Proxy Dataset Data Source Year Extend Traffic data on the sections of the waterways
Voies Navigables de France (VNF) [7] 2010 Selected countries
Traffic volume TRANS-TOOLS [8] 2010 Selected countries
River geo data/geospatial inland waterways GISCO (HYDR) [9] 2010 EU 27 + EFTA
Figure 1 River network from TRANS-Tool [8].

1205118-000-ZWS-0016, 2 July 2013, final
Diffuse water emissions in E-PRTR - Project report
C-15 van
Figure 2 Accessibility of the inland waterways from Voies Navigables de France [7]. Literature [1] Netherlands National Water Board – Water Unit in cooperation with Deltares and
TNO. Emission estimates for diffuse sources, Netherlands Emission Inventory, Coal tar based coating, inland navigation, 2011.
[2] Netherlands National Water Board – Water Unit in cooperation with Deltares and
TNO. Emission estimates for diffuse sources, Netherlands Emission Inventory, Discharges of bilge water by inland navigation, 2011.
[3] Netherlands National Water Board – Water Unit in cooperation with Deltares and
TNO. Emission estimates for diffuse sources, Netherlands Emission Inventory,Sacrificial anodes, inland navigation, 2011.
[4] Netherlands National Water Board – Water Unit in cooperation with Deltares and
TNO. Emission estimates for diffuse sources, Netherlands Emission Inventory, Sanitary wastewater, inland navigation, 2011.
[5] AAPA World Port Ranking 2008 - http://aapa.files.cms-
plus.com/Statistics/WORLD%20PORT%20RANKINGS%2020081.pdf (125 biggest ports).
[6] EUROSTAT 2011, Transport by type of vessel, National transport. [7] VNF, 2010: Voies Navigables de France (VNF) - http://www.vnf.fr/, 05.07.2010. [8] Trans-Tools, 2010 (URL: http://energy.jrc.ec.europa.eu/transtools/ , 2010). [9] GISCO, 2010: Geographic Information System of the European Commission
(EUROSTAT), http://epp.EUROSTAT.ec.europa.eu/portal/page/portal/gisco/geodata/reference , 2010).

Diffuse water emissions in E-PRTR - Project report
1205118-000-ZWS-0016, 2 July 2013, final
C-16 van 102
[10] Voies Navigables d'Europe (VNE) (URL: http://www.vne-waterways.eu/ , 05.07.2010). [11] IER, 2011: Theloke et al. (2011): Methodology development for the spatial distribution
of the diffuse emissions in Europe - http://circa.europa.eu/Public/irc/env/e_prtr/library?l=/diffuse_releases_e-prtr/methodology_2011/_EN_1.0_&a=d
[12] WISE River Basin Districts (RBDs) and/or their subunits (RBDSUs), Version 1.4
(06/2011) (URL: http://www.eea.europa.eu/data-and-maps/data/wise-river-basin-districts-rbds-1 , 20.12.2013).

1205118-000-ZWS-0016, 2 July 2013, final
Diffuse water emissions in E-PRTR - Project report
C-17 van
C.4 Un-connected households Introduction This factsheet covers emissions resulting from the discharge of domestic wastewater, not connected to a sewer system. This emission source is allocated to these “un-connected households”. The wastewater loads will reach the surface water directly, will infiltrate in the soil or will be collected and treated in e.g. septic tanks. Domestic wastewater originates from dwellings, offices, shops and companies. The water primarily comprises tap water, including emissions due to corrosion of the pipe system, human excretions and food remains, dishwasher detergent and diffuse emissions from products (paint, oil, etc.). Non-domestic emissions from (small-scale) industries are not included. This factsheet describes a method to estimate the emissions of nutrients, total organic carbon (TOC), heavy metals and polycyclic aromatic hydrocarbons (PAHs) from the un-connected households. Development of a methodology The sewer system and Urban Waste Water Treatment Plants collect and treat polluted water, meeting requirements prior to discharge into surface water. Not all the pollution is removed (varying according to the substance in question and the kind of treatment), meaning that discharges from the system contribute to surface water pollution. Not all the polluted water from households will reach the sewer system. A part of the households is not connected to a sewer system. This fact sheet presents a calculation method for emissions caused by un- connected households, see the left side of figure 1.
Figure 1 Emissions to and from a sewer system and the calculation thereof.

Diffuse water emissions in E-PRTR - Project report
1205118-000-ZWS-0016, 2 July 2013, final
C-18 van 102
The loads of the UWWTPs, in the middle of figure 1, are described in the factsheet Urban Waste Water Treatment Plants. On the right sight of the figure, the untreated sewer discharge water of the sewer system; storm water outlets, combined sewer overflows and collection systems without treatment are represented. These sources are not presented in this factsheet or in other factsheets of this project, because the total load per substance to the sewer system has to be known. Such information is not available in this project and calculations can not be made. Explanation of the calculation method The emissions of the un-connected households are calculated by using the next formula:
Un-connected households: Emission = AR x EF x % WT x PWw
Where: AR = Number of inhabitants in the NUTS areas in 2008 EF = Emission factor per substance per inhabitant (kg) %WT = % of the generated load per agglomeration without treatment in 2010 PWw = the pathway to surface water (in %) The calculation follows a number of steps: 1. Firstly, the percentage of the wastewater (in population equivalent: p.e.) from
agglomerations that is not treated is determined. The wastewater not treated is the wastewater not collected through collecting systems and not addressed through IAS (Individual and other Appropriate System). These loads reach the surface water without treatment or will infiltrate in the soil. This information is taken from the UWWTD database [1]. Member states have reported the rate (%) of the untreated generated load per agglomeration.
2. The next step is the calculation of the amount of un-connected households (inhabitants). Therefore the number of inhabitants in the NUTS regions is multiplied by the percentage not treated in the NUTS region.
3. The third step is the calculation of the emissions for the un-connected households. Therefore the emissions are calculated by multiplying the result of step 2 by an emission factor (EF) for each substance, expressed in emission per inhabitant. The emission calculated in this way is referred to as the total emission per NUTS region. A certain part of the emissions will end up in the compartment surface water and a part in the compartment soil.
4. And finally, the emissions per nuts are calculated by multiplying the pathway to surface water (%) with the calculated emission in step 3.
The generated loads of wastewater are reported per agglomeration by Member States. For this factsheet, they have been aggregated or disaggregated to the finest NUTS region possible, NUTS3, because Member States have reported in three different NUTS levels. The total emission per NUTS area is regionalised to the River Basin Districts and their subunits. Activity rates For the calculations, an emission factor per substance per inhabitant is used. Therefore the activity rate for this factsheet is the number of inhabitants per NUTS region [3]. For all Member States the number of inhabitants per NUTS region is available in EUROSTAT.

1205118-000-ZWS-0016, 2 July 2013, final
Diffuse water emissions in E-PRTR - Project report
C-19 van
Emission factors For the un-connected households two kinds of emission factors are used: Inhabitants per year
This emission factor is expressed in mg per inhabitant per year. Information on emission factors is taken from international studies about emissions from dwellings [2]. Emission factors for a large number of substances over a number of years based on extensive literature research on domestic wastewater are available. The emission factors for 2010 are shown in table 1. Table 1 Emission factor per inhabitant per year (g/inhabitant, year), [2].
Substance
Emission Factor (g/inhabitant, year)
Nutrient-P 791 Nutrient-N 4 285 Total Organic Carbon 39 055 Cadmium 0.05 Copper 6.54 Mercury 0.018 Lead 0.79 Nickel 0.50 Zinc 10.29 Anthracene 0.000705 Fluoranthene 0.025
% untreated wastewater per NUTS
In the database of the Urban Waste Water Directive [1] Member States report information about the percentage of the generated load per NUTS region without treatment (definition: rate of generated load of agglomerations not collected through collecting system and not addressed through IAS, in % of p.e.). In table 2, the information per Member State is aggregated to an average national percentage per Member State. In the percentages in Table 2, the loads addressed through septic tanks are not included. For the calculations the percentage of surface water per NUTS region is used. There might be some doubt about the accuracy of the figures in the UWWTP database. About half of the Member States have supplied a zero percentage of untreated wastewater in their country, which seems not very realistic. An explanation for this might be that in the UWWTP database mostly generated pollution from agglomerations > 2000 p.e. are included and not the smaller agglomerations.

Diffuse water emissions in E-PRTR - Project report
1205118-000-ZWS-0016, 2 July 2013, final
C-20 van 102
Table 2 Percentage of the generated load of domestic wastewater without treatment per Member State [1].
Member State
Untreated load (%)
Member State Untreated load (%)
Austria 0% Italy 0.9% Belgium 1.9% Lithuania 0% Bulgaria 41% Luxembourg 0% Cyprus 83% Latvia 33% Czech Republic 0% Malta 0% Germany 0% Netherlands 0% Denmark 0% Poland 11% Estonia 9.7% Portugal 0.6% Spain 1.1% Romania 87% Finland 0% Sweden 0% France 1.8% Slovenia 28% Greece 0% Slovakia 1.2% Hungary 0% United Kingdom 0% Ireland 0% Emission pathways to water The loads without treatment will go merely to the soil system, but a (small) part may go to the surface water. For this project, the ratio of surface water/soil in a NUTS region is used to calculate emissions to surface water. The percentage of surface water in a NUTS region is taken as the percentage of the loads from the untreated households that end up in the surface water. Table 3 shows the average percentage of surface water area per Member State. It is realised this is a rough approximation, but additional data are not available. Table 3 Percentage of total area of Member States* that consists of surface water [4].
Member State
Surface Water (%)
Member State Surface Water (%)
Austria 1.09 Iceland 8.67
Belgium 0.78 Italy 0.79 Bulgaria 0.96 Liechtenstein 2.5
Switzerland 1.98 Lithuania 2.7 Cyprus 0.23 Luxembourg 0.38
Czech Republic 0.84 Latvia 4.28 Germany 1.39 Netherlands 9.58
Denmark 1.75 Norway 10.88
Estonia 4.82 Poland 1.82 Spain 0.71 Portugal 0.8
Finland 15.93 Romania 3 France 0.62 Sweden 14.75
Greece 1.01 Slovenia 0.51 Hungary 2.81 Slovakia 0.7
Ireland 16.61 United Kingdom 3.08
* for Malta is calculated with 0% inland surface water

1205118-000-ZWS-0016, 2 July 2013, final
Diffuse water emissions in E-PRTR - Project report
C-21 van
Emissions The total emissions to surface water are calculated for all the River Basis Districts. In table 4 the total emissions per EU Member State are shown for nutrients and PAHs, in table 5 the total emissions for heavy metals. Please note that these are the loads to surface water and thus emissions corrected for the percentage surface water area in the NUTS region. The calculated loads seem to be very low, mainly as a result of excluding septic tanks, the assumption only a very small percentage of the untreated wastewater will be discharged to the surface water and the low percentage of untreated wastewater reported by a number of Member States. Table 4 Loads to surface water from un-connected households excluding septic tanks per Member State, nutrients
(ton/y) and PAHs (g/y) in 2008.
Member State* Nutrient-N Nutrient-P TOC Anthracene Fluoranthene
ton/y g/y Austria 0 0 0 0 0 Belgium 0.10 0.02 0.92 0.02 0.59 Bulgaria 61 11 553 10 354 Cyprus 6.4 1.2 59 1.06 38 Czech Republic 0 0 0 0 0 Germany 0 0 0 0 0 Denmark 0 0 0 0 0 Estonia 5.4 1.0 49 0.89 32 Spain 0.01 0.002 0.10 0.002 0.065 Finland 0 0 0 0 0 France 0.15 0.03 1.4 0.03 0.89 Greece 0 0 0 0 0 Hungary 0 0 0 0 0 Ireland 0 0 0 0 0 Italy 0.09 0.02 0.79 0.01 0.50 Lithuania 0 0 0 0 0 Luxembourg 0 0 0 0 0 Latvia 22 4.1 202 3.64 129 Malta 0 0 0 0 0 Netherlands 0 0 0 0 0 Poland 16 3.0 150 2.71 96 Portugal 0.01 0.002 0.10 0.002 0.062 Romania 48 8.8 435 7.85 278 Sweden 0 0 0 0 0 Slovenia 1.4 0.26 13 0.23 8.10 Slovakia 0.25 0.05 2.3 0.04 1.44 United Kingdom 0 0 0 0 0 * Only the EU Member States that have supplied information to the EU are represented In Waterbase UWWTP. For the not EU Member States, no information was available.

Diffuse water emissions in E-PRTR - Project report
1205118-000-ZWS-0016, 2 July 2013, final
C-22 van 102
Table 5 Loads to surface water from un-connected households per Member State, heavy metals (kg/y).
Member State* Cadmium Copper Lead Mercury Nickel Zinc
kg/y Austria 0 0 0 0 0 0 Belgium 0.001 0.15 0.02 0.00 0.01 0.24 Bulgaria 0.71 93 11 0.25 7.1 146 Cyprus 0.08 9.8 1.2 0.03 0.75 15 Czech Republic 0 0 0 0 0 0 Germany 0 0 0 0 0 0 Denmark 0 0 0 0 0 0 Estonia 0.06 8.3 1.00 0.02 0.63 13 Spain 0.00 0.02 0.00 0.00 0.00 0.03 Finland 0 0 0 0 0 0 France 0.00 0.23 0.03 0.00 0.02 0.37 Greece 0 0 0 0 0 0 Hungary 0 0 0 0 0 0 Ireland 0 0 0 0 0 0 Italy 0.00 0.13 0.02 0.00 0.01 0.21 Lithuania 0 0 0 0 0 0 Luxembourg 0 0 0 0 0 0 Latvia 0.26 34 4.1 0.09 2.6 53 Malta 0 0 0 0 0 0 Netherlands 0 0 0 0 0 0 Poland 0.19 25 3.0 0.07 1.9 39 Portugal 0.00 0.02 0.00 0.00 0.00 0.03 Romania 0.56 73 8.8 0.20 5.6 115 Sweden 0 0 0 0 0 0 Slovenia 0.02 2.12 0.26 0.01 0.16 3.3 Slovakia 0.00 0.38 0.05 0.00 0.03 0.59 United Kingdom 0 0 0 0 0 0 * Only the EU Member States that have supplied information to the EU are represented In Waterbase UWWTP. For the not EU Member States, not all the necessary information for the calculation of the loads was available. Spatial allocation The methodology for the spatial distribution of emissions from un-connected households contains the following main steps: 1. Regionalisation of the national totals to the NUTS3 regions.
The number of employees [3] and the population data [5] are used for the regionalisation of the diffuse releases from not connected households.
2. Gridding. The allocation of emissions regionalized on NUTS 3 level to a 5 km x 5 km grid cell resolution is based gridded population data [5] and information concerning the urbanization degree [4, 6]. The gridding methodology used is similar to the methodology and described in IER 2011 [8].
3. Regionalisation of the gridded emission values to RBDSUs. Allocation of the gridded emission data to the RBDSU areas [7] based on different ArcGIS [9-11] and database calculation steps.

1205118-000-ZWS-0016, 2 July 2013, final
Diffuse water emissions in E-PRTR - Project report
C-23 van
Literature [1] Waterbase – UWWTD: Urban Waste Water Treatment Directive, December 06, 2012.
url: http://www.eea.europa.eu/data-and-maps/data/waterbase-uwwtd-urban-waste-water-treatment-directive.
[2] Netherlands National Water Board – Water Unit in cooperation with Deltares and TNO. Emission estimates for diffuse sources, Netherlands Emission Inventory, Domestic waste water, 2011.
[3] EUROSTAT Economically active population, 2008: Economically active population by sex and age, at NUTS levels 1, 2 and 3 (1000) from EUROSTAT for 2008 (EUROSTAT [lfst_r_lfp3pop] (URL: http://appsso.EUROSTAT.ec.europa.eu/nui/show.do?dataset=lfst_r_lfp3pop&lang=en , 10.12.2010).
[4] EUROSTAT-GISCO – The Degree of Urbanization (DGUR) classifies 2001 European
census communes into three urbanization categories: densely, intermediate or thinly populated areas (URL: http://epp.EUROSTAT.ec.europa.eu/portal/page/portal/gisco/popups/references/Population%20Distribution%20-%20Demography , 07.07.2010).
[5] EEA/JRC, 2010: EEA/Joint Research Centre (2010): Population density disaggregated with CORINE Land Cover 2000 (URL: http://www.eea.europa.eu/data-and-maps/data/population-density-disaggregated-with-corine-land-cover-2000-2 , 2010).
[6] GISCO, 2010: Geographic Information System of the European Commission
(EUROSTAT), (URL: http://epp.EUROSTAT.ec.europa.eu/portal/page/portal/gisco/geodata/reference , 2010).
[7] WISE River Basin Districts (RBDs) and/or their subunits (RBDSUs), Version 1.4
(06/2011) (URL: http://www.eea.europa.eu/data-and-maps/data/wise-river-basin-districts-rbds-1 , 20.12.2013).
[8] IER, 2011: Theloke et al. (2011): Methodology development for the spatial distribution of
the diffuse emissions in Europe - http://circa.europa.eu/Public/irc/env/e_prtr/library?l=/diffuse_releases_e-prtr/methodology_2011/_EN_1.0_&a=d.
[9] CLC90, 2010: EEA: CORINE Land Cover 1990 (CLC90) (URL: http://www.eea.europa.eu/data-and-maps/ figures/geographic-view-of-corine-land-cover-clc90-switzerland , 02.07.2010).
[10] CLC2000, 2010: EEA: CORINE Land Cover 2000 100 m (CLC2000) (URL http://www.eea.europa.eu/data-and-maps/data/corine-land-cover-2000-clc2000-seamless-vector-database , 02.07.2010).
[11] CLC2006, 2010: EEA: CORINE Land Cover 2006 Version 02/2010 (CLC2006) (URL: http://www.eea.europa.eu/data-and-maps/data/corine-land-cover-2006-raster , 02.07.2010).

Diffuse water emissions in E-PRTR - Project report
1205118-000-ZWS-0016, 2 July 2013, final
C-24 van 102
C.5 Road transport Introduction This factsheet sets out a method for calculating diffuse emissions resulting from road traffic sources. These sources include tyre wear, brake wear and engine oil leaks and cause emissions of heavy metals and polycyclic aromatic hydrocarbons (PAHs). Another source of road traffic diffuse emissions is road surface wear, but this emission source is not incorporated in the emission calculation. The reason for omitting this source is that the emissions of PAHs resulting from road surface wear are low in comparison to the PAH emissions from engine leaks and tyre wear. Besides that, the top layer of roads consists mainly of asphalt, a mixture of >95% mineral constituents (stone, sand and filler) with a binding agent (<5%). This binding agent may contain tar and thus PAH, but it is assumed that most (if not all) countries within the EU27 + EFTA have replaced the PAH containing agents with substitutes that are free (or contain only traces) of PAHs. Explanation of calculation method The emissions are calculated separately for various vehicle categories (light and heavy) and road types (urban, rural and highways). Pollutants emitted on urban roads are not incorporated in the calculated emissions to surface water, see the section ‘Activity rates’ for an explanation. Emissions are calculated by multiplying an activity rate (AR), in the case of road traffic the mileages on roads in European Union (EU27) member states, by an emission factor (EF), expressed in emission per AR unit. The calculation method is shown in the formula below:
Es AR * EF * pathway Where:
Es = Emission of substance (pollutant) s to compartments (soil, surface water andsewers)
AR EF
= =
Activity Rate, in this case the traffic performance (distance covered on the EU road network in 106 km) Emission Factor (kg/106 km)
pathway = Percentage of the emission allocated to compartment x
The emission calculated in this way is referred to as the total emission. A specific proportion of this total emission ends up in surface water: This is defined as the net emission to the surface water. Activity rates Total national traffic performance is chosen as the activity rate, since it adequately represents the road traffic activity and because it is the main cause of oil leakage, tyre and brake wear. In addition, total national traffic performance numbers can be easily produced by each EU Member State. The activity rate consists of the traffic performance by light and heavy vehicles on urban roads, rural roads and highways in the year of which the emissions are calculated. Table 1 shows which vehicles belong to which vehicle class.

1205118-000-ZWS-0016, 2 July 2013, final
Diffuse water emissions in E-PRTR - Project report
C-25 van
Table 1 Distribution of vehicles in light and heavy vehicles.
Vehicle Vehicle Class Passenger cars Light Motorcycles Light Mopeds Light Vans Light Special vehicles, light Light Light duty trucks Light Lorries Heavy Heavy duty trucks Heavy Buses Heavy Special vehicles, heavy Heavy Activity rates are calculated per Member State of the European Union (EU27) (Tremove-model, data for 2005 [5, 6]. Table 2 shows the light and heavy vehicles traffic performance for each Member State. Since it is expected that all emissions from urban driving end up in the sewers or the soil, the traffic performance for this road type is not shown. A significant part of the loads will be discharged to the surface water by the stormwater overflows and the separate sewer overflows. These pathways are not regarded in this project and no estimation methods have been developed in this project. Table 2 Traffic performance (106 vehicle km) per Member State for the year 2005.
Member State Traffic, light Highways (106 vkm)
Traffic, heavy Highways (106 vkm)
Traffic, light Rural roads (106 vkm)
Traffic, heavy Rural roads (106 vkm)
Austria 14 056 3 855 24 959 3 941 Belgium 25 897 4 794 33 151 3 101 Bulgaria 2 210 659 11 195 3 037 Cyprus 165 50 2 318 1 046 Czech Republic 5 265 1 858 29 004 8 305 Denmark 3 328 1 807 28 566 2 700 Estonia 340 86 4 739 1 809 Finland 2 581 847 35 470 6 568 France 77 777 24 710 280 212 25 512 Germany 201 675 50 170 248 264 24 033 Greece 4 635 2 047 37 849 5 351 Hungary 3 553 1 142 17 998 5 222 Ireland 190 139 19 942 4 253 Italy 84 114 27 263 353 199 17 494 Latvia 613 106 8 566 2 212 Lithuania 1 358 211 18 896 4 341 Luxembourg 1 096 262 2 434 985 Netherlands 39 361 9 613 52 288 7 383 Norway 4 426 1 112 23 023 3 363 Poland 6 263 1 259 87 448 26 140 Portugal 6 913 3 344 36 881 5 862 Romania 4 512 2 206 22 985 9 546 Slovakia 178 339 13 559 9 790 Slovenia 2 239 595 8 260 1 940 Spain 13 219 11 624 178 033 40 940 Sweden 8 333 2 122 42 942 6 453 Switzerland 18 286 2 762 32 710 2 230 United Kingdom 118 174 13 759 183 623 29 328

Diffuse water emissions in E-PRTR - Project report
1205118-000-ZWS-0016, 2 July 2013, final
C-26 van 102
Emission factors It has to be mentioned that the emission factors used are based on international literature in which measurement data on run off water from roads is often the basis. In general it seems impossible to calculate the emissions on the basis of the concentrations of the runoff water, because the lack of information about volume of the water, surface of the roads and local conditions. That is why the method is preferred that is based on the emission factors of the different sub sources in combination with the traffic performance data. With this method, an EU-wide calculation is achievable. In this section it is explained how the EU road traffic emission factors are obtained. The data for the calculations were extracted from the 2008 PRTR from the Netherlands. The general applied method consists of dividing the emissions (based on international literature) by the traffic performance. In this way, an implied emission factor for road traffic is derived. This method is chosen because it is simple yet robust, it incorporates the whole domestic vehicle activities (and therefore is suited to conduct bottom-up emission calculations) and because the effects of policy measures are already accounted for. Emissions and road transport related activities were obtained from international literature [1, 2 and 3]. Therefore, it is assumed that the derived implied emission factors are suitable for the calculation of diffuse emissions in the EU. To obtain emission factors per pollutant, emissions for all sources calculated in the mentioned factsheets were added up and divided by the traffic performance (per road type) so that emission factors representative for all three sources summated are produced. The results are emission factors for each pollutant per road type, vehicle classification and compartment (see ‘Emission pathways to water’). Effects of policy measures EU Directive 2005/69/EC [4] specifies that on January 1, 2010, no new tyres are allowed to be launched on the market that are manufactured with aromatic oils containing more than 1 mg/kg Benzo(a)pyrene or more than 10 mg/kg EU-PAHs. The following compounds fall within the scope of PAH components regulated by the EU: Benzo(a)pyrene, B enzo(e)pyrene, Benzo(a)anthracene, Chrysene, Benzo(b)fluoranthene, Benzo(j)fluoranthene, Benzo(k)fluoranthene and Dibenzo(a,h)anthracene. The effect of this policy measure has been incorporated into the emission factors. The calculated emission factors Table 3 contains the emission factors for rural roads. Table 3 Calculated emission factors for rural roads (kg/106vkm).
Rural roads
Substance Emission Factor (kg/106 vkm) Heavy Light
Anthracene 1.69E-04 4.39E-05 Cadmium 4.71E-05 9.55E-06 Copper 4.19E-02 1.32E-02 Fluoranthene 4.72E-04 1.95E-04
Lead 8.40E-03 2.12E-03 Nickel 2.13E-03 4.13E-04
Zinc 7.14E-01 7.75E-02

1205118-000-ZWS-0016, 2 July 2013, final
Diffuse water emissions in E-PRTR - Project report
C-27 van
In Table 4 the emission factors for highways are presented. Table 4 Calculated emission factors for highways (kg/106vkm).
Highways
Substance Emission Factor (kg/106 vkm) Heavy Light
Anthracene 1.26E-04 3.19E-05 Cadmium 4.90E-05 1.00E-05
Copper 4.17E-02 1.33E-02 Fluoranthene 2.74E-04 9.77E-05
Lead 8.68E-03 2.21E-03 Nickel 2.15E-03 4.19E-04 Zinc 7.21E-01 7.85E-02
Emission pathways to water The major part of the emissions from road traffic on highways and rural roads, will go to the soil, assumed is that only a smaller part will go directly to the surface water. For this project, a division is made between surface water and soil on the basis of the ratio of surface water/soil in a NUTS region. In regions without surface water, the loads running off the highways and the rural roads, will end up in the soil system. In regions with a lot of surface water, it is expected at least a (small) part of the loads will end up in the surface water. As an raw assumption the percentage of surface water in a NUTS region is regarded as the percentage of the loads that end up in the surface water. This may be improved on the basis of information of the Member States. In some areas, a part of the runoff water coming from the highways and the rural roads will be collected and sometimes treated in a simple way (e.g. retention ponds). Because no data are available on a EU scale, in the calculations it was assumed that no purification took place.
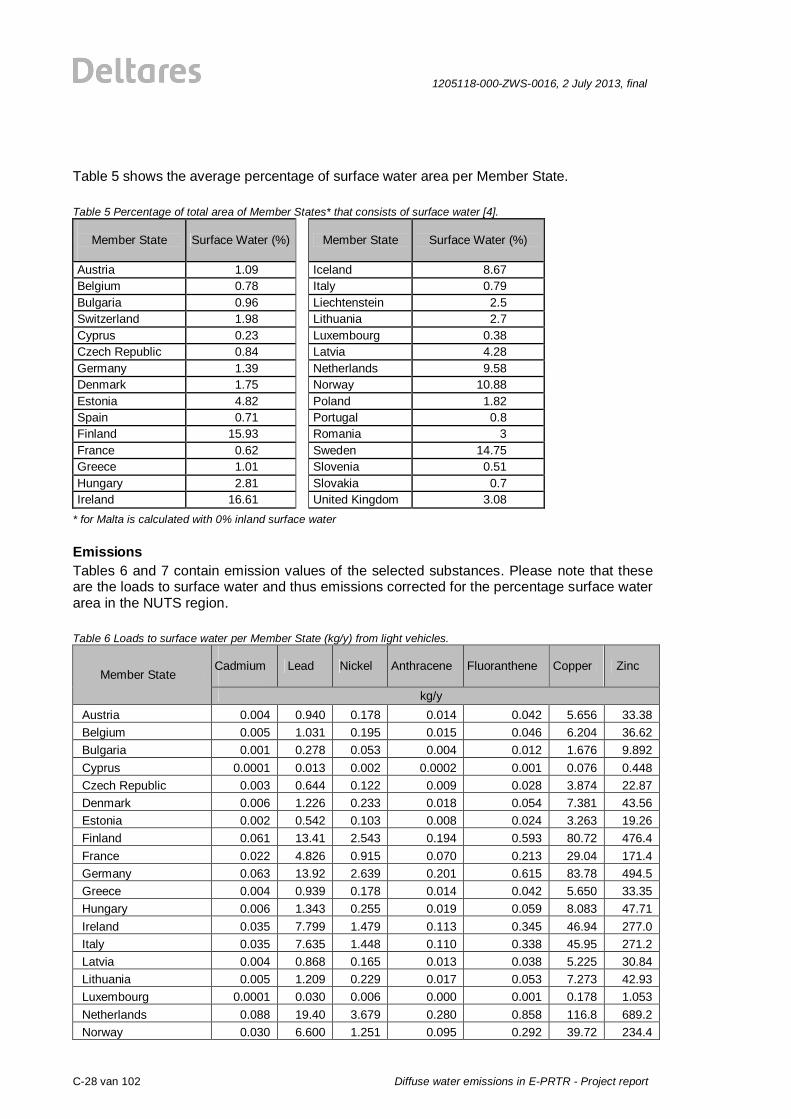
Diffuse water emissions in E-PRTR - Project report
1205118-000-ZWS-0016, 2 July 2013, final
C-28 van 102
Table 5 shows the average percentage of surface water area per Member State. Table 5 Percentage of total area of Member States* that consists of surface water [4].
Member State
Surface Water (%) Member State Surface Water (%)
Austria 1.09 Iceland 8.67 Belgium 0.78 Italy 0.79 Bulgaria 0.96 Liechtenstein 2.5 Switzerland 1.98 Lithuania 2.7 Cyprus 0.23 Luxembourg 0.38 Czech Republic 0.84 Latvia 4.28 Germany 1.39 Netherlands 9.58 Denmark 1.75 Norway 10.88 Estonia 4.82 Poland 1.82 Spain 0.71 Portugal 0.8 Finland 15.93 Romania 3 France 0.62 Sweden 14.75 Greece 1.01 Slovenia 0.51 Hungary 2.81 Slovakia 0.7 Ireland 16.61 United Kingdom 3.08
* for Malta is calculated with 0% inland surface water Emissions Tables 6 and 7 contain emission values of the selected substances. Please note that these are the loads to surface water and thus emissions corrected for the percentage surface water area in the NUTS region. Table 6 Loads to surface water per Member State (kg/y) from light vehicles.
Member State
Cadmium
Lead Nickel Anthracene Fluoranthene Copper Zinc
kg/y Austria 0.004 0.940 0.178 0.014 0.042 5.656 33.38 Belgium 0.005 1.031 0.195 0.015 0.046 6.204 36.62 Bulgaria 0.001 0.278 0.053 0.004 0.012 1.676 9.892 Cyprus 0.0001 0.013 0.002 0.0002 0.001 0.076 0.448 Czech Republic 0.003 0.644 0.122 0.009 0.028 3.874 22.87 Denmark 0.006 1.226 0.233 0.018 0.054 7.381 43.56 Estonia 0.002 0.542 0.103 0.008 0.024 3.263 19.26 Finland 0.061 13.41 2.543 0.194 0.593 80.72 476.4 France 0.022 4.826 0.915 0.070 0.213 29.04 171.4 Germany 0.063 13.92 2.639 0.201 0.615 83.78 494.5 Greece 0.004 0.939 0.178 0.014 0.042 5.650 33.35 Hungary 0.006 1.343 0.255 0.019 0.059 8.083 47.71 Ireland 0.035 7.799 1.479 0.113 0.345 46.94 277.0 Italy 0.035 7.635 1.448 0.110 0.338 45.95 271.2 Latvia 0.004 0.868 0.165 0.013 0.038 5.225 30.84 Lithuania 0.005 1.209 0.229 0.017 0.053 7.273 42.93 Luxembourg 0.0001 0.030 0.006 0.000 0.001 0.178 1.053 Netherlands 0.088 19.40 3.679 0.280 0.858 116.8 689.2 Norway 0.030 6.600 1.251 0.095 0.292 39.72 234.4

1205118-000-ZWS-0016, 2 July 2013, final
Diffuse water emissions in E-PRTR - Project report
C-29 van
Member State
Cadmium
Lead Nickel Anthracene Fluoranthene Copper Zinc
kg/y Poland 0.017 3.769 0.715 0.054 0.167 22.68 133.9 Portugal 0.004 0.774 0.147 0.011 0.034 4.660 27.50 Romania 0.008 1.823 0.346 0.026 0.081 10.97 64.76 Slovakia 0.001 0.213 0.040 0.003 0.009 1.279 7.549 Slovenia 0.001 0.118 0.022 0.002 0.005 0.712 4.203 Spain 0.013 2.916 0.553 0.042 0.129 17.55 103.6 Sweden 0.076 16.71 3.169 0.241 0.739 100.6 593.7 Switzerland 0.010 2.231 0.423 0.032 0.099 13.43 79.26 United Kingdom 0.093 20.54 3.895 0.297 0.908 123.6 729.7
Table 7 Loads to surface water per Member State (kg/y) from heavy vehicles.
Member State
Cadmium
Lead Nickel Anthracene Fluoranthene Copper Zinc
kg/y Austria 0.004 0.738 0.183 0.011 0.023 3.543 61.27 Belgium 0.003 0.541 0.134 0.008 0.017 2.601 44.97 Bulgaria 0.002 0.302 0.075 0.004 0.010 1.449 25.05 Cyprus 0.0001 0.022 0.005 0.0003 0.001 0.105 1.817 Czech Republic 0.004 0.750 0.186 0.011 0.024 3.602 62.28 Denmark 0.004 0.681 0.169 0.010 0.021 3.270 56.53 Estonia 0.004 0.795 0.197 0.012 0.025 3.817 66.00 Finland 0.058 10.27 2.543 0.149 0.324 49.32 852.7 France 0.015 2.659 0.659 0.039 0.084 12.77 220.9 Germany 0.051 9.017 2.234 0.131 0.285 43.32 749.0 Greece 0.004 0.642 0.159 0.009 0.020 3.085 53.34 Hungary 0.009 1.558 0.386 0.023 0.049 7.483 129.4 Ireland 0.038 6.682 1.655 0.097 0.211 32.10 555.1 Italy 0.017 3.069 0.760 0.045 0.097 14.74 254.9 Latvia 0.005 0.861 0.213 0.013 0.027 4.138 71.55 Lithuania 0.006 1.067 0.264 0.015 0.034 5.125 88.61 Luxembourg 0.0002 0.041 0.010 0.001 0.001 0.198 3.415 Netherlands 0.080 14.13 3.501 0.205 0.446 67.90 1174 Norway 0.024 4.225 1.047 0.061 0.133 20.30 351.0 Poland 0.024 4.328 1.072 0.063 0.137 20.79 359.5 Portugal 0.004 0.639 0.158 0.009 0.020 3.071 53.10 Romania 0.017 3.060 0.758 0.044 0.097 14.70 254.2 Slovakia 0.003 0.615 0.152 0.009 0.019 2.956 51.12 Slovenia 0.001 0.112 0.028 0.002 0.004 0.539 9.322 Spain 0.018 3.148 0.780 0.046 0.099 15.12 261.5 Sweden 0.062 10.98 2.719 0.159 0.347 52.74 911.9 Switzerland 0.005 0.858 0.212 0.012 0.027 4.121 71.26 United Kingdom 0.065 11.52 2.853 0.167 0.364 55.34 956.8
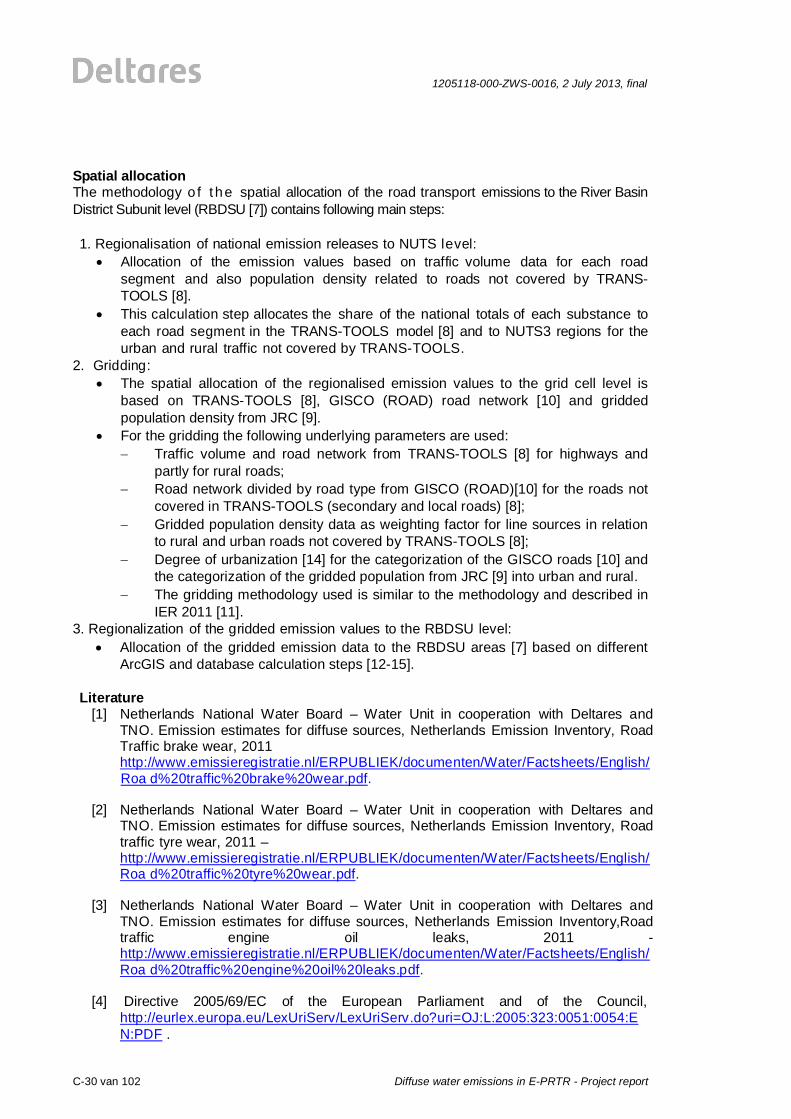
Diffuse water emissions in E-PRTR - Project report
1205118-000-ZWS-0016, 2 July 2013, final
C-30 van 102
Spatial allocation The methodology o f t he spatial allocation of the road transport emissions to the River Basin District Subunit level (RBDSU [7]) contains following main steps: 1. Regionalisation of national emission releases to NUTS level:
Allocation of the emission values based on traffic volume data for each road segment and also population density related to roads not covered by TRANS-TOOLS [8].
This calculation step allocates the share of the national totals of each substance to each road segment in the TRANS-TOOLS model [8] and to NUTS3 regions for the urban and rural traffic not covered by TRANS-TOOLS.
2. Gridding: The spatial allocation of the regionalised emission values to the grid cell level is
based on TRANS-TOOLS [8], GISCO (ROAD) road network [10] and gridded population density from JRC [9].
For the gridding the following underlying parameters are used: Traffic volume and road network from TRANS-TOOLS [8] for highways and
partly for rural roads; Road network divided by road type from GISCO (ROAD)[10] for the roads not
covered in TRANS-TOOLS (secondary and local roads) [8]; Gridded population density data as weighting factor for line sources in relation
to rural and urban roads not covered by TRANS-TOOLS [8]; Degree of urbanization [14] for the categorization of the GISCO roads [10] and
the categorization of the gridded population from JRC [9] into urban and rural. The gridding methodology used is similar to the methodology and described in
IER 2011 [11]. 3. Regionalization of the gridded emission values to the RBDSU level:
Allocation of the gridded emission data to the RBDSU areas [7] based on different ArcGIS and database calculation steps [12-15].
Literature
[1] Netherlands National Water Board – Water Unit in cooperation with Deltares and TNO. Emission estimates for diffuse sources, Netherlands Emission Inventory, Road Traffic brake wear, 2011
http://www.emissieregistratie.nl/ERPUBLIEK/documenten/Water/Factsheets/English/Roa d%20traffic%20brake%20wear.pdf.
[2] Netherlands National Water Board – Water Unit in cooperation with Deltares and
TNO. Emission estimates for diffuse sources, Netherlands Emission Inventory, Road traffic tyre wear, 2011 –
http://www.emissieregistratie.nl/ERPUBLIEK/documenten/Water/Factsheets/English/Roa d%20traffic%20tyre%20wear.pdf.
[3] Netherlands National Water Board – Water Unit in cooperation with Deltares and
TNO. Emission estimates for diffuse sources, Netherlands Emission Inventory,Road traffic engine oil leaks, 2011 - http://www.emissieregistratie.nl/ERPUBLIEK/documenten/Water/Factsheets/English/Roa d%20traffic%20engine%20oil%20leaks.pdf.
[4] Directive 2005/69/EC of the European Parliament and of the Council,
http://eurlex.europa.eu/LexUriServ/LexUriServ.do?uri=OJ:L:2005:323:0051:0054:EN:PDF .

1205118-000-ZWS-0016, 2 July 2013, final
Diffuse water emissions in E-PRTR - Project report
C-31 van
[5] TREMOVE, 2010 - http://www.tremove.org/documentation/index.htm, 07.07.2010.
[6] De Ceuster et al., 2007: De Ceuster G., van Herbruggen B., Ivanova O., Carlier K., Martino A., Fiorello D. (2007): TREMOVE: Service contract for the further
development and application of the transport and environmental TREMOVE model (Tremove, 2010) Lot 1 (Improvement of the data set and model structure) FINAL REPORT to the European Commission - http://www.tremove.org/documentation/Final_ReportTREMOVE_9July2007c.pdf,
16.07.2010. [7] WISE River Basin Districts (RBDs) and/or their subunits (RBDSUs), Version
1.4 (06/2011) (URL: http://www.eea.europa.eu/data-and-maps/data/wise-river-basin-districts-rbds-1 , 20.12.2013).
[8] TRANS-TOOLS, 2010: (URL: http://energy.jrc.ec.europa.eu/transtools/index.html ,
02.07.2010). [9] Gallego F.J. (2010): A population density grid of the European Union, Population
and Environment. 31: 460-473 (URL: http://link.springer.com/article/10.1007%2Fs11111-010-0108-y , 20.12.2013).
[10] GISCO, 2010: Geographic Information System of the European Commission (EUROSTAT)
http://epp.EUROSTAT.ec.europa.eu/portal/page/portal/gisco/geodata/reference, 2010).
[11] IER, 2011: Theloke et al. (2011): Methodology development for the spatial
distribution of the diffuse emissions in Europe - http://circa.europa.eu/Public/irc/env/e_prtr/library?l=/diffuse_releases_e-prtr/methodology_2011/_EN_1.0_&a=d .
[12] EEA/JRC, 2010: EEA/Joint Research Centre (2010): Population density
disaggregated with CORINE Land Cover 2000 (URL: http://www.eea.europa.eu/data-and-maps/data/population-density-disaggregated-with-corine-land-cover-2000-2 , 2010).
[13] CLC90, 2010: EEA: CORINE Land Cover 1990 (CLC90) (URL:
http://www.eea.europa.eu/data-and-maps/figures/geographic-view-of-corine-land-cover-clc90-switzerland , 02.07.2010).
[14] CLC2000, 2010: EEA: CORINE Land Cover 2000 100 m (CLC2000) (URL:
http://www.eea.europa.eu/data-and-maps/data/corine-land-cover-2000-clc2000-seamless-vector-database , 02.07.2010).
[15] CLC2006, 2010: EEA: CORINE Land Cover 2006 Version 02/2010 (CLC2006)
(URL: http://www.eea.europa.eu/data-and-maps/data/corine-land-cover-2006-raster, 02.07.2010).

Diffuse water emissions in E-PRTR - Project report
1205118-000-ZWS-0016, 2 July 2013, final
C-32 van 102
C.6 Urban Waste Water Treatment Plants not in E-PRTR Introduction This factsheet sets out a method for calculating substances in effluent from Urban Waste Water Treatment Plants (UWWTP) emissions not covered by the E-PRTR. The E-PRTR collects a part of UWWTP emissions. Only UWWTPs with a capacity higher than 100 000-population equivalents (p.e.) and substance loads above the threshold values have to be reported to E-PRTR. Member States can report voluntary about UWWTPs below this capacity and about loads below the substance thresholds. A considerable part of the load is expected not to be reported to E-PRTR, for example the smaller UWWTPs and loads below the threshold value. Besides the E-PRTR reports, every Member State has to report to the Urban Waste Water Directive every two years. In these reports all Member States report about the UWWTPs in their country (capacity, location, treatment way etc.). Both reports are used to estimate emissions for the not E-PRTR UWWTPs. This factsheet describes a method to estimate these emissions, which cause loads to surface water of nutrients, heavy metals and polycyclic aromatic hydrocarbons (PAHs). Development of a methodology The sewer system and Urban Waste Water Treatment Plants collect and treat polluted water, meeting requirements prior to discharge into surface water. Not all the pollution is removed (varying according to the substance in question and the kind of treatment), meaning that discharges from the system contribute to surface water pollution. This fact sheet presents a calculation method for emissions caused by effluents from UWWTPs, see figure 1.
Figure 1 Emissions to and from a sewer system and the calculation thereof. On the right sight of the figure, the untreated sewer discharge water of the sewer system; storm water outlets, combined sewer overflows and collection systems without treatment are represented. These sources are not presented in this factsheet or in other factsheets of this project, because the total load per substance to the sewer system has to be known. That information is not available in this project and calculations can not be made. The un-connected households, the left site of the figure, are not presented in this factsheet but in the factsheet “un-connected households”.

1205118-000-ZWS-0016, 2 July 2013, final
Diffuse water emissions in E-PRTR - Project report
C-33 van
Effluents of the treated wastewater are discharged to surface water. This factsheet describes a method to calculate the effluent per pollutant per UWWTP. The database of the Urban Waste Water Directive forms the base of the calculations (December, 2012 - Waterbase - UWWTD: Urban Waste Water Treatment Directive). The table T-UWWTPS shows a load entering the UWWTP (p.e.) or/and a capacity per UWWTP (p.e.). Two different loads from UWWTPs can be distinguished: A. UWWTP loads reported to E-PRTR. Mostly UWWTPs above a capacity threshold of
100 000 p.e. and with discharges above threshold values have to report their emissions. This loads are known already and will not be reported again.
B. UWWTP loads not reported to E-PRTR. A first analysis of the E-PRTR data of the UWWTPs makes clear that a lot of emissions are missing. There are two major gaps: C. Emissions of substances below the E-PRTR substance thresholds or emissions of the
the smaller UWWTPs (below the E-PRTR UWWTP capacity threshold of 100.000 p.e).
D. Emissions above the substance thresholds and above the E-PRTR capacity thresholds (>100.000 p.e.) which should be reported to E-PRTR, but are not reported by any reason. Comparing the E-PRTR reports and the UWWTD database, we can conclude a significant part of the large UWWTPs (> 100.000 p.e.) is missing in the E-PRTR reports.
Above mentioned gaps are relevant in the process of generating the “total” emissions from all UWWTPs in the EU. In this factsheet emissions are estimated for both gaps mentioned above (C and D). Explanation of the calculation method The effluents of the UWWTPs are calculated separately for the individual UWWTP. Emissions are calculated by multiplying an activity rate (AR), in this case the load entering a UWWTP (p.e.), by an emission factor (EF), expressed in the load per substance per UWWTP. The calculation method is shown in the formula below: Es = (ARa * EF) Where:
Es = Load of substance to surface water per UWWTP sum(ARa) = Activity rate, the load entering a UWWTP (p.e.) EF = Emission factor (kilogram per substance/p.e.)
Per River Basin District the effluents of the UWWTPs in the district will be summarized per substance. Loads reported to E-PRTR are not calculated again. Only the not reported loads will be calculated. Activity rates There are a few activity rates relevant for this calculation method. The most important is the load entering a UWWTP (p.e.). This load is available from table T-UWWTPS in the UWWTP database [1]. If the load is not available, the organic design capacity (p.e.) of the UWWTP can be used instead. Sometimes the load entering a UWWTP is higher than the organic design capacity, but in most situations, the load is lower than the capacity.

Diffuse water emissions in E-PRTR - Project report
1205118-000-ZWS-0016, 2 July 2013, final
C-34 van 102
Also the number of the UWWTPs is important. A few steps are taken to select the UWWTPs which are used to calculate the loads to surface water. UWWTPs who has been closed/deactivated (1080) or areas not connected to an UWWTP (3739) are not considered. In total 22084 of 27083 UWWTPs are considered for the calculations. Only the EU Member States that have supplied information to the EU are represented In Waterbase UWWTP. For the not EU Member States, no information was available for the UWWTPs. Emission factors In this section it is explained how the emission factors are obtained in four steps: 1. Linking UWWTPs from different databases Two databases are used to obtain the emission factors, the E-PRTR database [2] and the UWWTP database [1]. Both databases contain codes for the UWWTPs, but the used codes were not compatible. Therefore the UWWTPs were linked by using GIS. There might be a chance that wrong UWWTPs are linked to each other or UWWTPs are not linked because there are differences in coordinates between both databases for a number of UWWTPs. Result: per UWWTP in the UWWTP database the reported E-PRTR load per substance. 2. Calculating the emission factor per substance (kg/p.e.) Therefore, the load entering the UWWTP (p.e) divides the known E-PRTR or UWWTP load of the UWWTP for a substance. Result: an emission factor for substance X per UWWTP (kg/p.e.). 3. Calculating of emission factor For every UWWTP in the database the treatment is known. There are three possible treatments in the database: - Primary treatment (PT): Treatment of urban waste water by a physical and/or chemical
process involving settlement of suspended solids, or other process in which the BOD5 of the incoming waste water is reduced by at least 20% before discharge and the total suspended solids of the incoming waste water are reduced by at least 50%.
- Secondary treatment (ST): Treatment of urban waste water by a process generally involving biological treatment with a secondary settlement or other process.
- Other treatment (OT): Treatment of urban waste water by any process and/or disposal system which after discharge allows the receiving waters to meet the relevant quality objectives and the relevant provisions of this and other Community Directives. Other treatment is considered as more stringent treatment.
For every treatment way the weighted average is chosen, because normal averages and a median can give incorrect figures. For example figure 2. In this figure the calculated average, median and the weighted average for Nutrient-N and Nutrient-P is shown. For both substances the average seems too high for the other and secondary treatment. The median and the weighted average are less low. The decision is made to use the weighted average, because for the most situations the weighted average was in between the median and the average. The emission factor calculated for larger UWWTPs has a bigger influence on the average than the emission factor for the smaller UWWTPs when the average emission factor is calculated. Therefore the weighted average is used, where instead of each of the data points contributing equally to the final average, some data points contribute more than others. The weighted average is calculated by dividing the total loads per substance by the total load entering the UWWTP. Result: an emission factor for substance X per treatment class (kg/p.e.)

1205118-000-ZWS-0016, 2 July 2013, final
Diffuse water emissions in E-PRTR - Project report
C-35 van
+
Figure 2 The calculated average, median and the weighted average for Nutrient-N and Nutrient-P for the loads in
the Waterbase – UWWTP [1]. 4. UWWTP capacity Besides the way of treatment, there is another important difference between the UWWTPs: the capacity of the plant. For this factsheet we distinguish three classes of capacity:
1. Smaller than 15 000 p.e. 2. Between 15 000 and 100 000 p.e. 3. Bigger than 100 000 p.e.
Result: Per substance an emission factor in kg/p.e. per Treatment-class and capacity class. Emission factors for Nutrients In the latest UWWTP database, December 2012, for a lot of UWWTPs additional incoming and discharged loads are reported. These data are used to calculate emission factors for Nutrient-N, Nutrient-P and the total oxygen demand (TOC). In the UWWTP database the chemical oxygen demand (COD) is used. TOC is calculated as COD/3. Table 1 shows the reported combinations of treatment ways and the calculated emission factors of the UWWTP effluent per UWWTP class. We see that for UWWTPs with “other treatment” as highest step, the lowest emission factor is calculated for Nutrient-N with a range
0
0,0005
0,001
0,0015
0,002
0,0025
0,003
Average median weighted average
EF
Nutrient-N
OTSTPT
0
0,00005
0,0001
0,00015
0,0002
0,00025
0,0003
0,00035
Average median weighted average
EF
Nutrient-P
OTSTPT

Diffuse water emissions in E-PRTR - Project report
1205118-000-ZWS-0016, 2 July 2013, final
C-36 van 102
from 0,76 – 0,81 kg/p.e. For treatment classes with PT or ST as highest treatment step, the emission factor for Nutrient-N is higher, range 1,2 – 1,8 kg/p.e. This means that loads to surface water will be lower when a higher level of treatment is operational. This applies for Nutrient-P and TOC as well. Table 1 Emission factors of the UWWTP effluent for Nutrient-N, Nutrient-P and total organic carbon (TOC) for the
different treatment ways and different UWWTP classes in kg/p.e.
Substance
UWTTP_class (p.e.) OT ST PT
TOC <15 000 3,631 5,960 12,565 15 000 <> 100 000 3,331 5,613 12,565 > 100 000 3,341 6,306 12,565
Nutrient-N <15 000 0,814 1,557 1,839 15 000 <> 100 000 0,761 1,274 1,839 > 100 000 0,774 1,322 1,839
Nutrient-P <15 000 0,167 0,237 0,226 15 000 <> 100 000 0,075 0,160 0,226 > 100 000 0,057 0,141 0,226
In the UWWTD database only UWWTPs, less than 15 000 p.e. have a primary treatment. There are a few larger UWWTPs with a primary treatment, but most of the larger UWWTP classes have higher treatment levels. There was not enough data (less than 10 UWWTPs) to calculate an EF for the primary treatment for the larger UWWTP classes. Therefore, the EF for the primary treatment of the small UWWTPs (< 15 000 p.e.) is also used for the larger UWWTP classes (> 15 000 p.e.). Emission factors for heavy metals For the heavy metals E-PRTR loads [2] and Dutch UWWTP loads [3] are used for the calculation of the emission factors. In the Netherlands, for every UWWTP loads are calculated yearly, bases on measurements. A weighted average emission factor on both loads is calculated for the treatment class “other treatment” only, as is shown in Table 2. There were not enough data available to calculate emission factors for primary and secondary treatment UWWTPs. To extract emission factors for the secondary treatment, Dutch literature study [4] is used. In the Dutch emission calculations purification efficiency is used for the estimation of emission factors for UWWTPs with a secondary treatment for the heavy metals as shown in table 3. To calculate an Emission Factor for the secondary treatment, the purification efficiency for the other treatment class is calculated for the Dutch situation. These efficiencies are also shown in table 3. For the primary treatment class the same emissions factors are used as for the secondary treatment. To calculate an Emission Factor for the secondary treatment class, the next formula is used: EFst = PEot / PEst: * EFot
Where: EFst: Emission Factor for secondary treatment PEot: Purification Efficiency for other treatment PEst: Purification Efficiency for secondary treatment EFot: Emission Factor for other treatment

1205118-000-ZWS-0016, 2 July 2013, final
Diffuse water emissions in E-PRTR - Project report
C-37 van
Table 2 Emission factors of the UWWTP effluent for heavy metals for different treatment ways and different UWWTP classes in kg/p.e.
Substance
UWWTP class (p.e.) OT ST*
Cadmium
<15 000 0.0000909 0.0000810 15 000 <> 100 000 0.0000692 0.0000768 > 100 000 0.0001086 0.0001343
Copper <15 000 0.0007763 0.0010429 15 000 <> 100 000 0.0020081 0.0026878 > 100 000 0.0007861 0.0010564
Mercury <15 000 0.0000107 0.0000109 15 000 <> 100 000 0.0000197 0.0000201 > 100 000 0.0000159 0.0000168
Nickel <15 000 0.0009679 0.0014530 15 000 <> 100 000 0.0010530 0.0015815 > 100 000 0.0007405 0.0010974
Lead <15 000 0.0002781 0.0005729 15 000 <> 100 000 0.0006665 0.0012919 > 100 000 0.0005022 0.0008902
Zinc <15 000 0.0051614 0.0062571 15 000 <> 100 000 0.0058102 0.0067606 > 100 000 0.0055516 0.0064437
*for PT the EF for ST is used. Table 3 Purification efficiency for heavy metals for different treatment ways and different UWWTP classes in kg/p.e.
Substance
UWWTP class (p.e.)
Purification Efficiency
OT [3 ] ST [4]
Cadmium
<15 000 53.48% 60% 15 000 <> 100 000 66.56% 60% > 100 000 74.21% 60%
Copper <15 000 94.05% 70% 15 000 <> 100 000 93.69% 70% > 100 000 94.06% 70%
Mercury <15 000 71.33% 70% 15 000 <> 100 000 71.29% 70% > 100 000 73.62% 70%
Nickel <15 000 61.81% 30% 15 000 <> 100 000 58.15% 30% > 100 000 53.18% 30%
Lead <15 000 90.07% 60% 15 000 <> 100 000 90.11% 60% > 100 000 88.93% 60%
Zinc <15 000 84.86% 70% 15 000 <> 100 000 81.45% 70% >100 000 81.25% 70%

Diffuse water emissions in E-PRTR - Project report
1205118-000-ZWS-0016, 2 July 2013, final
C-38 van 102
Emissions factors for PAHs For the PAHs less data are available. Therefore only Dutch data are used [5], based on measurements in influent and estimated purification efficiencies of Dutch UWWTPs. For the UWWTPs for which influent concentrations are available, in combination with the purification efficiencies, effluent loads of the selected PAHs are calculated. The effluent loads of the individual UWWTPs are summarised and divided by the total amount of p.e. of the UWWTPs, resulting in an emission factor of the UWWTP effluent in kg/p.e. [3]. The results are shown in table 4. These Emission factors are used for all the different treatment ways and UWWTP classes, because PAHs will be especially attached to suspended matter. For the PAHs, the emission factors are less related to the way of treatment in the UWWTP than is the case for heavy metals and nutrients. Table 4 Emission factors of the UWWTP effluent for PAHs in kg/p.e.
Substance
Emission Factor (kg/p.e.)
Anthracene 2.118E-07 Fluoranthene 1.334E-06 Emission pathways to water Only the effluents of the UWWTPs are considered in this factsheet. The effluents are direct loads to surface water. Emissions With the emission factors and the loads (p.e.) per UWWTP, for all the 22084 UWWTPs the load of 11 substances are calculated. Only the loads not already reported in E-PRTR are reported in Table 5 (nutrients and PAHs) and Table 7 (heavy metals) and presented on the maps. In Table 6 and Table 8 the loads of the nutrients, PAHs and heavy metals as reported in the E-PRTR are shown. In Table 9 the total UWWTP loads of the EU Member States is shown. The percentages of this load reported in E-PRTR and the percentages calculated in this project are shown in Table 7 as well. Table 5 Total load per Member State for nutrients in ton/year and PAH in kg/year for UWWTPs not reported in E-
PRTR, 2010.
Member State*
Nutrient-N
Nutrient-P TOC Antracene Fluoranthene
ton/y kg/y Austria 6 271 796 8 927 2.8 18 Belgium 4 573 598 7 108 1.8 11 Bulgaria 2 232 259 3 557 0.8 4.8 Cyprus 424 53 608 0.1 0.7 Czech Republic 6 746 748 7 187 1.9 12 Germany 44 491 5 116 77 355 24 147 Denmark 2 740 334 5 422 1.4 8.6 Estonia 1 005 114 1 237 0.2 1.5 Spain 47 752 4 988 70 824 12 77 Finland 4 838 487 4 787 1.3 8.3 France 52 245 6 050 75 635 16 98 Greece 3 587 366 5 387 2.3 14 Hungary 6 663 795 9 838 1.9 12 Ireland 2 714 352 3 826 0.6 3.7

1205118-000-ZWS-0016, 2 July 2013, final
Diffuse water emissions in E-PRTR - Project report
C-39 van
Member State*
Nutrient-N
Nutrient-P TOC Antracene Fluoranthene
ton/y kg/y Italy 64 361 8 954 90 877 15 94 Lithuania 1 552 152 2 133 0.5 3.2 Luxembourg 662 58 802 0.1 0.9 Latvia 1 855 144 1 716 0.3 1.8 Malta 52 5 76 0.0 0.1 Netherlands 7 334 757 10 301 3.5 22 Poland 68 250 8 133 105 827 13 82 Portugal 9 172 1 112 16 014 2.2 14 Romania 10 362 1 400 21 865 1.6 10 Slovenia 1 318 188 1 890 0.4 2.5 Slovakia 4 495 529 6 598 0.8 5.0 United Kingdom 35 240 4 569 53 571 11 87
*Only EU Member States that have supplied information to the EU are represented In Waterbase UWWTP. For the not EU Member States, no information was available. UWWTPs < 2 000 pe are included, when information is supplied by MS. Table 6 Total load per Member State for nutrients in ton/year and PAH in kg/year for UWWTPs reported in E-PRTR,
2010.
Member State* Nutrient-N Nutrient-P TOC Antracene Fluoranthene
ton/y kg/y
Austria 3 975 311 4 930 Belgium 3 190 1 912 5 393 Bulgaria 4 670 1 123 6 567 Cyprus Czech Republic 4 534 262 3 691 2 Denmark 547 41 1 586 Estonia 779 53 764 Finland 5 392 67 3 077 France 28 723 2 603 31 217 1 Germany 40 727 1 672 45 172 12 Greece 3 105 983 7 151 Hungary 4 694 549 4 694 Iceland 1 045 258 Ireland 4 556 737 7 124 2 2 Italy 26 445 3 988 29 031 12 18 Latvia 1 090 44 Lithuania 905 32 394 Luxembourg 387 31 538 Netherlands 8 857 1 067 15 522 Norway 6 562 667 Poland 15 909 455 11 958 Portugal 9 843 1 012 15 789 5 4 Romania 7 625 880 12 484 Slovakia 1 764 177 1 140

Diffuse water emissions in E-PRTR - Project report
1205118-000-ZWS-0016, 2 July 2013, final
C-40 van 102
Member State* Nutrient-N Nutrient-P TOC Antracene Fluoranthene
ton/y kg/y
Slovenia 1 037 164 622 Spain 35 609 3 760 17 255 4 4 Sweden 5 749 90 6 076 6 Switzerland 7 208 252 4 035 United Kingdom 103 324 13 711 63 409 39 2
Table 7 Total load per Member State for heavy metals in kg/year for UWWTPs not reported in E-PRTR in 2010.
Member State
Cadmium
Copper Mercury Nickel Lead Zinc
kg/year Austria 1 240 12 530 217 8 406 5 105 49 950 Belgium 772 10 242 123 7 613 4 362 30 286 Bulgaria 198 4 576 62 3 021 2 640 14 023 Cyprus 53 763 7 538 362 3 204 Czech Republic 605 13 715 110 11 052 7 868 51 499 Germany 9 063 112 694 1 554 71 563 52 676 387 718 Denmark 560 8 492 105 6 016 3 359 35 876 Estonia 105 1 389 19 1 066 675 6 507 Spain 5 862 68 184 950 52 792 37 451 296 916 Finland 572 7 752 104 5 540 3 337 34 962 France 6 792 84 637 1 145 65 301 39 961 372 538 Greece 1 063 10 829 174 8 648 5 542 59 305 Hungary 853 11 331 149 8 611 5 123 51 944 Ireland 243 4 348 42 3 119 2 086 15 371 Italy 5 975 86 717 1 068 65 381 40 917 366 144 Lithuania 226 2 758 39 2 083 1 305 13 389 Luxembourg 55 1 219 13 767 486 4 120 Latvia 124 1 585 21 1 236 745 7 546 Malta 5 137 1 72 45 396 Netherlands 1 481 16 766 251 9 924 6 752 53 209 Poland 6 617 86 002 998 69 807 57 046 333 679 Portugal 1 056 14 354 159 11 244 8 573 56 303 Romania 805 10 749 132 8 678 6 610 42 677 Slovenia 192 2 767 33 2 114 1 486 11 014 Slovakia 364 6 365 66 4 730 3 407 23 885 United Kingdom 5 154 57 029 886 43 599 40 497 196 959
*Only the EU Member States that have supplied information to the EU are represented In Waterbase UWWTP. For the not EU Member States, no information was available.

1205118-000-ZWS-0016, 2 July 2013, final
Diffuse water emissions in E-PRTR - Project report
C-41 van
Table 8 Total load per Member State for heavy metals in kg/year for UWWTPs reported in E-PRTR in 2010.
Member State Cadmium Copper Mercury Nickel Lead Zinc
kg/year
Austria 16 2 818 915 3 091 87 564 Belgium 3 172 1 157 5 10 794 24 777 Bulgaria 2 001 6 771 5 038 2 15 484 234 424 Cyprus 2 Czech Republic 298 4 384 2 577 94 2 827 14 572 Denmark Estonia 555 214 1 602 Finland 55 1 997 256 8 2 429 12 125 France 1 611 22 295 9 502 158 9 016 136 457 Germany 375 31 533 5 336 207 22 034 157 504 Greece Hungary 841 315 105 946 219 Iceland 13 331 133 20 98 531 Ireland 9 355 199 14 1 822 8 344 Italy 3 915 21 571 19 025 404 45 423 127 673 Latvia 7 566 145 9 271 3 660 Lithuania 7 1 086 45 8 910 6 131 Luxembourg Netherlands 4 117 1 750 16 4 340 48 145 Norway 5 2 499 140 871 5 596 Poland 570 5 176 4 351 375 5 914 61 900 Portugal 1 391 8 020 8 597 202 8 802 25 358 Romania 551 6 053 2 469 6 533 34 156 Slovakia 7 5 Slovenia 3 47 1 322 Spain 63 8 617 1 185 33 23 816 96 231 Sweden 3 879 205 6 2 455 10 679 Switzerland 46 1 838 509 4 413 3 888 United Kingdom 296 76 613 6 602 87 24 269 152 917

Diffuse water emissions in E-PRTR - Project report
1205118-000-ZWS-0016, 2 July 2013, final
C-42 van 102
Table 9 Total load per substance for UWWTPs in all EU Member States and the part which is reported in E-PRTR or calculated in this project in % in 2010.
Substance
UWWTP loads
E-PRTR This Project Total Unit
Anthracene 35% 65% 177 kg Fluoranthene 7% 93% 791 kg Cadmium 13% 87% 61 ton Copper 25% 75% 853 ton Mercury 17% 83% 10 ton Nickel 29% 71% 666 ton Lead 17% 83% 409 ton Zinc 33% 67% 3 775 ton Nutrient-N 46% 54% 729 kton Nutrient-P 44% 56% 84 kton TOC 34% 66% 893 kton Spatial allocation The methodology of the spatial allocation of the UWWTP loads to the River Basin District Subunit level (RBDSU) level contains following main step: 1. Regionalization of the gridded emission values to the RBDSU level: Allocation of the emission loads available on UWWTP (point source) level to the RBDSU areas [5] based on different ArcGIS and database calculation steps [6 – 9]. Literature [1] Waterbase – UWWTD: Urban Waste Water Treatment Directive, December 06, 2012 url:http://www.eea.europa.eu/data-and-maps/data/waterbase-uwwtd-urban-waste-
water-treatment-directive. On the database has been a filtering with QA/QC flags of the Cenia.cz, oktober 2012. Besides that loads from Denmark are divided by 1000 to get tons instead of kilograms.
[2] E-PRTR, pollutant releases database, year 2010. url: http://prtr.ec.europa.eu/Pollutant
Releases.aspx .
[3] RWZI-base. Database with loads to surface water for nutrients and heavy metals for 370 Dutch UWWTPs. CBS, 2011.
[4] Diffuse bronnen van waterverontreiniging, CUWVO werkgroep VI, Den Haag. 1986 Pieters B.J., et all, Verbetering schatting effluentvrachten RWZI’s, Grontmij, oktober 2011: Duijnhoven, N. van , Oplegnotitie 2: herberekening PAK effluenten EmissieRegistratie, 2012, 1204148-003-ZWS-0014.
[5] WISE River Basin Districts (RBDs) and/or their subunits (RBDSUs), Version 1.4 (06/2011) (URL: http://www.eea.europa.eu/data-and-maps/data/wise-river-basin-districts-rbds-1 , 20.12.2013).
[6] EUROSTAT Economically active population, 2008: Economically active population by
sex and age, at NUTS levels 1, 2 and 3 (1000) from EUROSTAT for 2008 (EUROSTAT [lfst_r_lfp3pop] (URL:

1205118-000-ZWS-0016, 2 July 2013, final
Diffuse water emissions in E-PRTR - Project report
C-43 van
http://appsso.EUROSTAT.ec.europa.eu/nui/show.do?dataset=lfst_r_lfp3pop&lang=en , 10.12.2010).
[7] CLC90, 2010: EEA: CORINE Land Cover 1990 (CLC90) (URL: http://www.eea.europa.eu/data-and-maps/ figures/geographic-view-of-corine-land-cover-clc90-switzerland , 02.07.2010).
[8] CLC2000, 2010: EEA: CORINE Land Cover 2000 100 m (CLC2000) (URL: http://www.eea.europa.eu/data-and-maps/data/corine-land-cover-2000-clc2000-seamless-vector-database , 02.07.2010).
[9] CLC2006, 2010: EEA: CORINE Land Cover 2006 Version 02/2010 (CLC2006) (URL:
http://www.eea.europa.eu/data-and-maps/data/corine-land-cover-2006-raster , 02.07.2010).

Diffuse water emissions in E-PRTR - Project report
1205118-000-ZWS-0016, 2 July 2013, final
C-44 van 102
C.7 Case study industry Introduction Reliable estimation of diffuse emissions from industries to surface waters is an extremely complex task. This is caused by a number of reasons. First of all, the heterogeneity of companies can be very large even in sectors that produce similar end products. The second reason is that large differences in level of emissions can be caused by differences in follow-up treatment of separate waste water flows, even within one facility of the same company. Lastly, there are large uncertainties about the destination of effluents of industries in the different Member States: to the sewer system or to surface waters. Within the scope of the E-PRTR related diffuse releases (including emissions from point sources not covered in E-PRTR) only a rough indication for a potential method can be shown. This method could be applied on a wider scale in a later stage. The requirements of a methodology are; it should be simple, transparent, dependent on production or activity data that is freely and regularly – preferably yearly – accessible, covers the EU27 (and EFTA4) and individual Member States and not at the least gives good estimates. The paper industry was chosen as a case study because this is a well defined sector and high data availability. Results from the proposed method can be checked easily using the E-PRTR reported emissions. It is recognized that the paper sector is for a large extend covered by the E-PRTR, but the relative homogeneity of the sector makes it very useful for the exploration of possibility’s to estimate emissions from industry not covered by E-PRTR. If the explored methodology will not work in such a homogenous sector, it will certainly not work in other, more differentiated sectors. Development of a methodology The development of a methodology starts with the exploration of EU-wide (EU27+EFTA) available data. The calculation scheme is given in formula: Ei,s,y = Pi x EFi,s x (1- CFi) (formula 1) Wherein: Ei,s,y = emission of substance (s) per industrial sector (i) for year (y); kg Pi = production volume per sector (s); in mass unit paper produced per country per year
EFi,s = emission factor of substance (s) per production volume; kg/mass unit paper produced
CFi = connection rate to collective sewer systems. The disadvantage of formula 1 is that it is not possible to check which specific emission factors are to be used. No data on pollutant concentrations of effluents are available. The possible immediate effect of effluents on surface waters also will stay unclear by application of this method. Activity data, in this case the production of paper and paperboard, was selected as the sole focus, were obtained from EUROSTAT [2]. The online database on the EUROSTAT website contains detailed information about the (yearly) production of paper and pulp per Member State. The production in 2009 was chosen as basis for the calculations, since the E-PRTR database did not yet contain the 2010 emissions (at the moment this part of the project was executed) and as such, no comparison for the year 2010 could be made.

1205118-000-ZWS-0016, 2 July 2013, final
Diffuse water emissions in E-PRTR - Project report
C-45 van
Typical concentration ranges of nitrogen, phosphorus and total organic carbon (TOC) within the paper industry were explored by checking the BREFs [1] (all BREF documents are available online at http://eippcb.jrc.es/reference/). The BREF on paper production reports ranges in emission factor for above-mentioned pollutants; these are displayed in Table 1. Table 1 Emission factor ranges for Pulp and Paper industry (source: BREF, 2001), COD: chemical oxygen
demand; ADt; air-dried metric tonne.
Substance
Unit
Emission Factor
lower value upper value COD* kg/ADt 2 6 Nutrient-N g/ADt 5 100 Nutrient-P g/ADt 1 30
*There is no emission factor of TOC available. To calculate emissions of TOC, the COD was divided by 3 (TOC = COD/3). The unit ADt means “Air-dried (metric) tonne”, which is equivalent to a tonne of paper that contains 10% moisture and 90% pulp or paper (in the case of one tonne the mass would, respectively, be 100 and 900 kg). It is assumed that the unit ADt is interchangeable with ‘normal’ tonnes. This assumption is strengthened by the fact that in the BREF, for all pollutants mentioned, measurements on sub-processes in the production of paper show similar concentration ranges in kg/t. The table shows a wide range in emission factors which reflect the wide range of different technologies to reduce emissions used in the paper industry. This implies that detailed information on the processes is needed to make a reliable estimate for the emissions. Results The proposed method has been used to calculate the emissions for the total paper industry (E-PRTR and non-E-PRTR) by applying an emission factor per production unit of paper by the total paper production per Member State. The EU27 paper production figures were obtained from the online EUROSTAT database. In Table 2 the production data for 2009 are shown.

Diffuse water emissions in E-PRTR - Project report
1205118-000-ZWS-0016, 2 July 2013, final
C-46 van 102
Table 2 Production of paper and paperboard in EU27 Member S tates, 2009.
Member State
Production paper and paperboard (ton/y)
Austria 4 605 540 Belgium 1 990 000 Czech Republic 804 790 Finland 10 602 000 France 8 331 500 Germany 20 870 000 Hungary 461 000 Italy 8 404 170 Netherlands 2 609 000 Poland 3 274 960 Portugal 1 633 810 Rumania 250 000 Slovakia 920 980 Slovenia 732 000 Spain 5 700 100 United Kingdom 4 293 000 Bulgaria 216 900 Denmark 418 940 Estonia 63 380 Ireland 45 000 Greece 521 730 Cyprus 0 Latvia 54 000 Lithuania 85 800 Luxembourg 11 660 Malta 0 Sweden 10 932 000 EU27 total 87 832 240
The results from the emission calculation are presented in Tables 3 (TOC), 4 (Nutrient-N) and 5 (Nutrient-P). All emissions are in tonnes. Whenever a ‘-‘ is displayed in the E-PRTR emissions column, it means that the emissions were below the reporting limit. Emissions of TOC in the EU27 (total) as reported to the E-PRTR are almost 38000 tonnes in 2009. Emissions of Nutrient-N and Nutrient-P are 2000 and 200 tonnes, respectively.

1205118-000-ZWS-0016, 2 July 2013, final
Diffuse water emissions in E-PRTR - Project report
C-47 van
Table 3 TOC emissions from E-PRTR and calculated according to production numbers.
Member State
Number of facilities
reporting to E-PRTR for
2009
Reported E-PRTR
emissions * (ton/y)
Emissions Calculated (ton/y)
Difference between E-PRTR emissions and emissions calculated
(ton/y)
Emission Factor: 2 kg/ADt
Emission Factor: 6 kg/ADt
Emission Factor: 2 kg/ADt
Emission Factor: 6 kg/ADt
Austria 12 1775 3070 9211 1296 7436 Belgium 3 1344 1327 3980 -17 2636 Czech Republic 3 981 537 1610 -444 629 Finland 16 4530 7068 21204 2538 16674 France 24 5251 5554 16663 304 11412 Germany 63 8940 13913 41740 4974 32800 Hungary 1 667 307 922 -360 255 Italy 16 1145 5603 16808 4457 15663 Netherlands 10 531 1739 5218 1208 4687 Poland 5 1630 2183 6550 553 4920 Portugal 2 2179 1089 3268 -1090 1088 Romania - - 167 500 167 500 Slovakia 3 2152 614 1842 -1538 -310 Slovenia 3 214 488 1464 274 1250 Spain 11 959 3800 11400 2841 10441 United Kingdom 8 2230 2862 8586 632 6356 Bulgaria 2 130 145 434 15 304 Denmark - - 279 838 279 838 Estonia - - 42 127 42 127 Ireland - - 30 90 30 90 Greece - - 348 1043 348 1043 Cyprus - - 0 0 0 0 Latvia - - 36 108 36 108 Lithuania - - 57 172 57 172 Luxembourg - - 8 23 8 23 Malta - - 0 0 0 0 Sweden 4 3216 7288 21864 4072 18648 EU27 Total 37874 58555 137790 17194** 99916**
* Reporting limit (threshold) for TOC: 50 tonnes/year. ** This is the difference between the calculated total and the EU27 total.

Diffuse water emissions in E-PRTR - Project report
1205118-000-ZWS-0016, 2 July 2013, final
C-48 van 102
In Figure 1 the data from the first three columns from Table 3 are presented.
Figure 1 Reported E PRTR emissions of TOC from Paper and Pulp industry compared to estimates using a high and low emission factor (ton/y). The graph shows that E-PRTR emissions of TOC for many Member States are below the estimate based on the lowest emission factor. This difference indicates the importance of the non E-PRTR emissions in the paper en pulp industry. Table 4 Nutrient-N emissions from E-PRTR and calculated according to production numbers. Member State
Number of
facilities reporting to E-PRTR for
2009
Reported E-PRTR
emissions* (ton/year)
Emissions calculated
(ton/year)
Difference between E-PRTR emissions and emissions calculated
(ton/year) Emission
factor: 5 g/ADt
Emission factor:
100 g/ADt
Emission factor: 5 g/ADt
Emission factor:
100 g/ADt Austria - - 23 461 23 461 Belgium - - 10 199 10 199 Czech Republic 1 203 4 80 -199 -123 Finland 4 693 53 1060 -640 368 France 2 293 42 833 -251 540 Germany 1 75 104 2087 29 2012 Hungary 1 50 2 46 -48 -4

1205118-000-ZWS-0016, 2 July 2013, final
Diffuse water emissions in E-PRTR - Project report
C-49 van
Member State
Number of
facilities reporting to E-PRTR for
2009
Reported E-PRTR
emissions* (ton/year)
Emissions calculated
(ton/year)
Difference between E-PRTR emissions and emissions calculated
(ton/year) Emission
factor: 5 g/ADt
Emission factor:
100 g/ADt
Emission factor: 5 g/ADt
Emission factor:
100 g/ADt Italy 1 52 42 840 -10 788 Netherlands - - 13 261 13 261 Poland 1 94 16 327 -78 233 Portugal 1 52 8 163 -44 111 Romania - - 1 25 1 25 Slovakia 1 112 5 92 -107 -20 Slovenia - - 4 73 4 73 Spain 2 52 29 570 -24 518 United Kingdom - - 21 429 21 429 Bulgaria 1 175 1 22 -174 -153 Denmark - - 2 42 2 42 Estonia - - 0 6 0 6 Ireland - - 0 5 0 5 Greece - - 3 52 3 52 Cyprus - - 0 0 0 0 Latvia - - 0 5 0 5 Lithuania - - 0 9 0 9 Luxembourg - - 0 1 0 1 Malta - - 0 0 0 0 Sweden 2 185 55 1093 -130 908 EU27 total 2036 439 8783 -1597** 6747**
* Reporting limit (threshold) for Nutrient-N: 50 tonnes/year. ** This is the difference between the calculated total and the EU27 total.

Diffuse water emissions in E-PRTR - Project report
1205118-000-ZWS-0016, 2 July 2013, final
C-50 van 102
Figure 2 shows the data from the first three columns from Table 4 graphical.
Figure 2 Reported E-PRTR emissions of Nutrient-N from Paper and Pulp industry compared to estimates using a high and low emission factor (ton/y). The graph shows that E-PRTR emissions for many Member States are higher than the estimate based on the lowest emission factor. This indicates that the lower emission factor would under estimate the Nutrient-N emissions from the paper en pulp industry. Some Member States report Nutrient-N emissions even higher as based on the highest emission factor.

1205118-000-ZWS-0016, 2 July 2013, final
Diffuse water emissions in E-PRTR - Project report
C-51 van
Table 5 Nutrient-P emissions from E-PRTR and calculated according to production numbers. Member state
Number of
facilities reporting to
E-PRTR, for
2009
Reported E-PRTR
emissions* (ton/y)
Emissions calculated
(ton/year)
Difference between E-PRTR emissions
and emissions calculated (ton/yr)
Emission factor:
1 g/ADt
Emission factor:
30 g/ADt
Emission factor: 1 g/ADt
Emission factor:
30 g/ADt
Austria 2 8 4.6 138.2 -3 130 Belgium - - 2.0 59.7 2 60 Czech Republic 1 14 0.8 24.1 -13 10 Finland 1 6 10.6 318.1 5 312 France 4 54 8.3 249.9 -46 196 Germany 2 13 20.9 626.1 8 613 Hungary 1 14 0.5 13.8 -14 -1 Italy - - 8.4 252.1 8 252 Netherlands - - 2.6 78.3 3 78 Poland 1 7 3.3 98.2 -4 91 Portugal 1 39 1.6 49.0 -37 10 Romania - - 0.3 7.5 0 8 Slovakia 2 22 0.9 27.6 -21 6 Slovenia - - 0.7 22.0 1 22 Spain - - 5.7 171.0 6 171 United Kingdom 1 6 4.3 128.8 -1 123 Bulgaria - - 0.2 6.5 0 7 Denmark - - 0.4 12.6 0 13 Estonia - - 0.1 1.9 0 2 Ireland - - 0.0 1.4 0 1 Greece - - 0.5 15.7 1 16 Cyprus - - 0.0 0.0 0 0 Latvia - - 0.1 1.6 0 2 Lithuania - - 0.1 2.6 0 3 Luxembourg - - 0.0 0.3 0 0 Malta - - 0.0 0.0 0 0 Sweden - - 10.9 328.0 11 328 EU27 total 183 88 2635 -95** 2452**
* Reporting limit (threshold) for Nutrient-P: 5 tonnes/year. ** This is the difference between the calculated total and the EU27 total.

Diffuse water emissions in E-PRTR - Project report
1205118-000-ZWS-0016, 2 July 2013, final
C-52 van 102
Figure 3 shows the data from the first three columns from Table 5 graphical.
Figure 3 Reported E-PRTR emissions of Nutrient-P from Paper and Pulp industry compared to estimates using a high and low emission factor (ton/y). The graph shows similar patterns as the former two. The tables and figures show large differences between the emission reported to E-PRTR and the calculated emissions for the total paper industry (per Member State as well as for the EU27 total). For some M ember S tates the calculated emissions are higher than what is reported in E-PRTR (so diffuse emission from non E-PRTR plants can be calculated). But for many Member States the calculated emissions are considerably lower than the reported E-PRTR emissions, so for these Member States the method is not applicable. The reason for the differences per Member State is a result of the wide range in the emission factors (see Table 1). To narrow the range of the emission factor (to be applied for a specific Member State) detailed information on technologies in wastewater treatment in the paper industry is required. Furthermore the BREF on pulp and paper industry dates from 2001. Since that time developments in technologies are likely to have occurred, leading to a more efficient process with fewer emissions. Furthermore it can be expected that larger paper mills (E-PRTR) are using more state of the art abatement technologies as the non E-PRTR plants.
1205118-000-ZWS-0016, 2 July 2013, final
Diffuse water emissions in E-PRTR - Project report
C-53 van
Reporting limits are 5 t/y for Nutrient-P and 50 t/y for Nutrient-N and TOC. These reporting limits introduce a systematic error since many of the emissions that were expected are missing. However, these emissions can in principle be estimated, for instance by calculating a ratio between N/P/TOC on facility level, so that when the TOC emissions are known, the other substances can be calculated. The first conclusion however is that the proposed method results in emissions are not consistent to the reported ones and therefore not applicable without detailed information on the waste water technology in the different Member States. This does not mean however that the proposed method is without merit, the currently available data are just not detailed enough to make more accurate calculations. On an EU-total basis, the emissions calculated for the non E-PRTR plants in principle can be allocated to the different Member States using employees as a proxy. This calculation method for the emissions of non E-PRTR plants may be possible when estimates of the number of employees of paper plants within all individual Member States are available. From this the number the employees in E-PRTR and non E- PRTR plants should be separated. This number of employees per Member State in non E - PRTR plants could then be multiplied with the implied emission factor (E-PRTR emission/employee in the E-PRTR plants). When a Member State has not reported any emissions to surface water for the sector, the average implied emission factor for all Member States could be used to calculate the non E-PRTR emissions in that specific Member State. Although there are in principle possibilities to estimate emissions for the non E-PRTR industrial companies above mentioned shows a lot extra research is needed to define such an EU wide deployable method. Spatial allocation It is clear that when there is no possibility for reliable non E-PRTR sources emission estimates in a Member State, spatial allocation makes no sense. If detailed and reliable data on waste water technology, location and number of employees of the plants in the sector are available these are the best way to spatial allocate the emissions. An alternative would be to use the number of employees in the non E-PRTR part of the sector as a proxy. The number employees working in non E-PRTR plants could conservatively be estimated by assuming that all employees in a NUTS3 area are covered when at least 1 facility of a kind is present in that NUTS3 area. So the sum of all employees in all NUTS3 areas in a Member State wherein non E-PRTR emissions of a kind are reported are to be considered as non E-PRTR plant employees within this method. The details on the spatial allocation of diffuse emissions would be identical to the method used in the framework of the E-PRTR Diffuse Emissions to Air – project [3].

Diffuse water emissions in E-PRTR - Project report
1205118-000-ZWS-0016, 2 July 2013, final
C-54 van 102
General Conclusion The case study for the paper industry shows that non E-PRTR emissions from industrial sectors can be estimated. The results for the paper industry indicate that the non E-PRTR facilities may contribute substantially to the total emissions of the paper and pulp industry. For a reliable estimation, however, detailed information on processes, water treatment technology and employee numbers are required. The exercise showed that even for a relative “uniform” sector the required data are not available at EU level, so no maps could be generated. Possible solutions for some of the observed obstacles in using the proposed method are:
Lower capacity- and or emission thresholds in the E-PRTR Include pollutant concentrations in waste water in E-PRTR or Include water consumption and wastewater emission in E-PRTR.
Literature [1] BREF, Best available techniques REFerence document, European IPPC Bureau - Pulp
and Paper industry, downloaded from http://eippcb.jrc.es/reference/pp.html; accessed at 19/01/2012.
[2] EUROSTAT website
(http://epp.EUROSTAT.ec.europa.eu/portal/page/portal/EUROSTAT/home/, Statistics Database Database by themes Agriculture, forestry and fisheries Forestry Removals, production and trade Production and trade in primary products); accessed at 19/01/2012).
[3] IER, 2011, Theloke et al. (2011): Methodology development for the spatial distribution of
the diffuse emissions in Europe (url: http://circa.europa.eu/Public/irc/env/e_prtr/ library?l=/ diffuse_releases_e-prtr/methodology_2011/_EN_1.0_&a=d).