diferencias estructurales y reolÓgicas entre almidones de … · 2012-08-04 · sus propiedades...
TRANSCRIPT
455
DIFERENCIAS ESTRUCTURALES Y REOLÓGICAS ENTRE ALMIDONES DE FRUTAS Y CEREALES
STRUCTURAL AND RHEOLOGICAL DIFFERENCES BETWEEN FRUIT AND CEREAL STARCHES
M. Guadalupe Casarrubias-Castillo, Guadalupe Méndez-Montealvo*, S. Leticia Rodríguez-Ambriz, M. María Sánchez-Rivera, L. Arturo Bello-Pérez
Centro de Desarrollo de Productos Bióticos del Instituto Politécnico Nacional. Km 8.5, Ca-rretera Yautepec-Jojutla, Colonia San Isidro, apartado postal 24. 62731, Yautepec, Morelos, México. ([email protected]).
Resumen
Los almidones se usan con varios fines en la industria según sus propiedades funcionales, las cuales son influenciadas por su organización estructural. El objetivo de este estudio fue evaluar las características morfológicas, fisicoquímicas y reo-lógicas de almidones de cereales (maíz y cebada; Zea mays L. y Hordeum vulgare L.) y frutas (plátano y mango; Musa paradisiaca y Mangifera indica). Los gránulos del almidón de maíz eran esféricos, ovales y poligonales, entre 5 y 20 mm; los de cebada eran esféricos, entre 2 y 5 mm y ovales entre 15 y 25 mm; los de mango eran esféricos o de domo y punta, entre 5 y 12 mm; los de plátano eran alargados, con longitud pro-medio de 40 a 45 mm. El patrón de difracción de rayos X de los almidones de los cereales fue tipo A- y el de los frutos tipo C-. Éstos alcanzaron perfiles de formación de pasta mayores e índices de consistencia mayores que los de cereales; todos mostraron un comportamiento no-Newtoniano. En sus geles, el nivel de reorganización de los almidones no dependió de su fuente, sino de su estructura. La temperatura de pico y entalpía de gelatinización se relacionaron directamente con el tamaño de los gránulos. Sin embargo, su porcentaje de re-trogradación fue independiente del tamaño de gránulo y del patrón de difracción de rayos X. Por tanto, la organización de los cristales dependió de la conformación de las dobles hélices de la amilopectina. Se concluye que el uso de los almidones depende de su organización estructural que le confiere carac-terísticas independientes de la fuente.
Palabras clave: almidón, formación de pastas, gel, rayos X.
* Autor responsable v Author for correspondence.Recibido: septiembre, 2011. Aprobado: julio, 2012.Publicado como ARTÍCULO en Agrociencia 46: 455-466. 2012.
AbstRAct
Starches are used for several purposes in industry depending on their functional properties, which are affected by their structural organization. The objective of this study was to evaluate the morphological, physicochemical and rheological characteristics of cereals (maize, Zea mays L., and barley, Hordeum volgare L.) and fruits (banana, Musa paradisiacal, and mango, Mangifera indica) starches. Maize starch granules were spherical, elliptical and polygonal, between 5 and 20 mm; those of barley were spherical between 2 and 5 mm and oval, between 15 and 25 mm; those of mango starch were spherical or dome-shaped and split, with sizes between 5 and 12 mm; those of banana were long, with an average length of 40 to 45 mm. The X-ray diffraction pattern of cereal starches was type A- and that of fruits was type C-. The latter had higher pasting profiles and higher indexes of consistency than cereal starches. All starches exhibited non-Newtonian behavior. In their gels, the level of reorganization of the starches was not dependent on their source, but on their structure. Peak temperature and enthalpy of gelatinization was directly related to granule size. Their percentage of retrogradation, however, was independent of granule size and of X-ray diffraction pattern. Therefore, crystal organization depended on the conformation of the double helices of amylopectin. It is concluded that the use of starches depends on their structural organization that confers certain characteristics, regardless of the source.
Key words: starch, pasting formation, gel, X-rays.
IntRoductIon
Starch modifies food texture and thus it is used in the industry as a thickener, colloidal stabilizer and adhesive. There are several methods to
AGROCIENCIA, 1 de julio - 15 de agosto, 2012
VOLUMEN 46, NÚMERO 5456
IntRoduccIón
El almidón modifica la textura de los alimen-tos por lo que industrialmente se usa como espesante, estabilizador coloidal y adhesivo.
Hay varios métodos para caracterizar el almidón y así seleccionar variedades o genotipos que pre-senten propiedades específicas. El tamaño del grá-nulo afecta la composición, propiedades reológicas y transiciones de fase producidas al calentar una dispersión de almidón (Kulp, 1973). Además, la pérdida del orden de los componentes del almi-dón, amilosa y amilopectina puede estar relacio-nada con cambios irreversibles en sus propiedades, como hinchamiento, formación de pasta y disolu-ción (Biliaderis, 1991).
El viscoamilógrafo Brabender, el analizador rápi-do de viscosidad (ARV) y los viscosímetros rotacio-nales se usan para medir la viscosidad de las pastas de almidón (Wiesenborn et al., 1994) y el reómetro para evaluar las propiedades viscoelásticas de los al-midones (Hsu et al., 2000). El estudio de la micro-estructura de las pastas-geles de almidón es necesario para entender la relación entre composición quími-ca y propiedades viscoelásticas características (Singh et al., 2003). Aunque Bello-Pérez y Paredes López (2009), Bello-Pérez et al. (2010) y Rivas-González et al. (2008) analizaron aspectos morfológicos, fisico-químicos y estructurales de diversos almidones, no se ha establecido la relación entre el origen y sus ca-racterísticas para la formación de pastas o viscosidad. Por tanto el objetivo de este estudio fue evaluar la influencia del origen del almidón en sus característi-cas morfológicas, propiedades fisicoquímicas y reoló-gicas que proviene de cereales o frutos.
mAteRIAles y métodos
Aislamiento del almidón
El almidón de frutos de plátano (Musa paradisiaca L.) y man-go (Mangifera indica Var. Tommy Atkins) inmaduros, adquiridos en el mercado de Cuautla Morelos, México, fue aislado en una planta piloto mediante el procedimiento propuesto por Flores-Gorosquera et al. (2004). El almidón de cebada (Hordeum vul-gare L.) fue extraído con el procedimiento propuesto por Adkins y Greenwood (1966), y el de maíz (Zea mays L.) fue donado por Industrializadora de Maíz S.A. de C.V. (Guadalajara, Jalisco, México).
characterize starch in order to select varieties or genotypes that have specific properties. Granule size affects composition, rheological properties and phase transitions produced when starch dispersion is heating (Kulp, 1973). Moreover, loss of component order, of starch, amylose and amylopectin, might be related to irreversible changes in their properties, such as swelling, pasting formation and dissolution (Biliaderis, 1991).
The Brabender viscoamylograph, the rapid viscosity analyzer (RVA) and rotational viscometers are used to measure viscosity in starch pastes (Wiesenborn et al., 1994), and the rheometer for assessing viscoelastic properties of starches (Hsu et al., 2000). The study of paste-gel starch microstructure is necessary to understand the relationship between their chemical composition characteristics and viscoelastic properties (Singh et al., 2003). Although Bello-Pérez and Paredes López (2009), Bello-Pérez et al. (2010) and Rivas-González et al. (2008) analyzed morphological, physicochemical and structural aspects of several starches, no relationship has been established between origin and characteristics for pasting formation or viscosity. Therefore, the objective of this study was to evaluate the influence of starch origin on their morphological characteristics and physicochemical and rheological properties of cereal and fruit starches.
mAteRIAls And methods
Starch isolation
The starch of immature banana (Musa paradisiaca L.) and mango (Mangifera indica Var. Tommy Atkins), acquired in the market of Cuautla, Morelos, México, was isolated in a pilot plant following the procedure proposed by Flores-Gorosquera et al. (2004). Starch from barley (Hordeum vulgare L.) was extracted with the procedure proposed by Adkins and Greenwood (1966), and maize starch (Zea mays L.) was donated by Industrializadora de Maíz S.A. de C.V. (Guadalajara, Jalisco, México).
Electron scanning microscopy
Starch samples were dusted over double-sided adhesive copper tape fixed on an aluminum support of the electron scanning microscope (JEOL, model JSEM 35CX; Japan Electronic Optical Limited, Japan). The samples were covered with a 30 nm layer of carbon vacuum deposited (10-5 Torr) with a
457CASARRUBIAS-CASTILLO et al.
DIFERENCIAS ESTRUCTURALES Y REOLÓGICAS ENTRE ALMIDONES DE FRUTAS Y CEREALES
Microscopía electrónica de barrido
Las muestras de almidón se espolvorearon sobre una cinta conductora de cobre de doble adhesión fijada en un soporte de aluminio del microscopio electrónico de barrido (MEB) JEOL (modelo JSEM 35CX; Japan Electronic Optical Limited, Japón). Las muestras se cubrieron con una capa de carbón de 30 nm de espesor depositada al vacío (10-5 Torr) en una evaporadora JEOL. La capa uniforme en la superficie se logró con el adapta-dor rotatorio de ángulo variable de la evaporadora. Las muestras se colocaron en el ionizador de metales, se recubrieron con una capa de oro de 60 nm, se observaron y fotografiaron en el MEB a un voltaje de 8 KV (Ottenhof, 2003).
Difracción de rayos X
Las muestras se colocaron sobre el porta muestras del di-fractómetro de rayos X (Bruker D5005); de ángulo ancho, equipado con fuente de cobre, operado a 40 kV y 30 mA, pro-duciendo una radiación de CuKa con una longitud de onda de 1.54 Å. Los datos se recolectaron en un intervalo de 4 a 38° cada 0.1°, con velocidad de barrido de 60 s/°. La línea base del difractograma se corrigió en el intervalo de barrido y el vector se normalizó con el programa OPUS 3.0 (Bruker, UK) (Ott-enhof, 2003).
Formación de pastas y curvas de flujo de los almidones
Se prepararon dispersiones al 5 % (p/v) de sólidos totales en agua destilada y se colocaron en un reómetro (TA Instruments AR 1000-N; New Castle, EE.UU.), con sistema de placas paralelas. La placa superior fue de acrílico con textura estriada, de 60 mm de diámetro, y el espesor de muestra fue 1 mm. El sistema de placas se cubrió con aceite mineral para evitar la evaporación del agua durante la prueba. La medición se realizó durante un ciclo de ca-lentamiento de 25 °C hasta 90 °C y se hizo una etapa isotérmica por 10 min; se enfrió a 25 °C y se mantuvo por 10 min. Se usó una velocidad de calentamiento-enfriamiento de 2.5 °C min-1 y una velocidad de cizallamiento de 50 s-1. Después el equipo se programó para dos ciclos: ascendente y descendente de 0.03 a 100 s-1, y un tercer barrido descendente de 100 a 0.03 s-1. En los datos obtenidos del tercer ciclo se aplicó la ecuación de la ley de la potencia de Ostwald-de Waele en función del esfuerzo de corte (t), donde g=f(t), para calcular los parámetros de índice de consistencia (K, Pa.sn) e índice de comportamiento de flujo (n, adimensional), con lo que se definió el comportamiento del fluido (Steffe, 1992; Tecante y Doublier, 1999). Las determina-ciones se hicieron por triplicado.
JEOL evaporator. The uniform layer on the surface was achieved with the rotating variable angle adaptor of the evaporator. The samples were then placed in a metal ionizer, coated with a 60 nm layer of gold and observed and photographed in the electron microscope at a voltage of 8 KV (Ottenhof, 2003).
X-ray diffraction
The samples were placed on the specimen plate of the X ray diffractometer (Bruker D5005); wide angle, equipped with a copper source and operated at 4 kV and 30 mA, producing CuKa radiation with a wavelength of 1.54 Å. Data were collected at an interval of 4 to 38° every 0.1°, with a scanning speed of 60 s/°. The baseline of the diffractogram was corrected in the scanning interval and the vector was normalized with the software OPUS 3.0 (Bruker, UK) (Ottenhof, 2003).
Pasting formation and flow curves of starches
Total solids dispersions at 5 % (w/v) were prepared in distilled water and placed in a rheometer, (TA Instruments, AR 1000-N; New Castle, USA), with a system of parallel plates. The upper plate was an acrylic crosshatched plate 60 cm in diameter; and sample thickness was 1 mm. The parallel plates were coated with mineral oil to prevent water evaporation during the test. Measurement was performed during a heating cycle from 25 °C to 90 °C, holding at 90 °C plus and isothermic phase for 10 min. The system was then cooled to 25 °C and maintained thus for 10 min. A heating-cooling rate of 2.5 °C min-1 and a 50 s-1 shear rate were utilized. Afterwards, the equipment was programmed for two cycles: ascendant and descendant of 0.03 at 100 s-1 and a third descendant sweep of 100 to 0.03 s-1. The power law equation of Ostwald-de Waele was applied to the data obtained in the third cycle in function of shear stress (t), where g=f(t) to calculate the parameters of the consistency index (K, Pa.sn) and the flow behavior index (n, adimensional), and this was used to define the flow behavior (Steffe, 1992; Tecante and Doublier, 1999). Determinations were done in triplicate.
Low amplitude oscillatory method: gelation kinetics
Viscoelastic properties of the dispersions were measured with low amplitude oscillatory tests in a rheometer (TA Instruments AR 1000-N; New Castle, USA) in a system of parallel plates 60 mm in diameter (acrylic crosshatched upper plate) and sample thickness of 1 mm; the parallel plates were coated with mineral oil. Strain amplitude sweeps were performed at an interval of 0.03 at 5 %, frequency 1 Hz, in a heating cycle of 25 to 90 °C and sweep at 90 °C (Stage 1), cooling from 90 to 25 °C and

AGROCIENCIA, 1 de julio - 15 de agosto, 2012
VOLUMEN 46, NÚMERO 5458
Método oscilatorio de baja amplitud: cinética de gelificación
Las propiedades viscoelásticas de las dispersiones se midie-ron con pruebas oscilatorias de baja amplitud en un reómetro (TA Instruments AR 1000-N; New Castle, EE.UU.) en un sis-tema de placas paralelas de 60 mm de diámetro (placa superior de acrílico y estriada) y espesor de muestra de 1 mm; las placas paralelas se cubrieron con aceite mineral. Los barridos de am-plitud de la deformación se realizaron en un intervalo de 0.03 a 5 %, frecuencia de 1Hz, en un ciclo de calentamiento de 25 a 90 °C y barridos a 90 °C (Etapa 1), enfriamiento de 90 a 25 °C y barridos a esta temperatura final (Etapa 2). Para deter-minar la región viscoelástica lineal (RVL) se usó una velocidad de calentamiento-enfriamiento de 2.5 °C min-1. Los barridos de frecuencia se realizaron en el intervalo de 0.1 a 10 Hz, con am-plitud de deformación de 0.5 %, con el mismo procedimiento de calentamiento-enfriamiento. En las dos etapas se obtuvieron los módulos de almacenamiento (G’, Pa) y pérdida (G”, Pa). Las determinaciones fueron por triplicado.
Caracterización térmica
Las propiedades térmicas de gelatinización y retrogradación se evaluaron con un calorímetro de barrido diferencial (TA Ins-truments, 2010; New Castle, EE.UU.). La gelatinización de los almidones se evaluó con el método propuesto por Paredes-López et al. (1994): 2 mg de muestra seca se colocaron en una charola de aluminio con 7 mL de agua desionizada y se deja equilibrar a temperatura ambiente 1 h antes de realizar el análisis. Como referencia se usó una charola sin muestra. La muestra equilibrada se sometió a un programa de calentamiento en el intervalo de 30 a 120 °C, con velocidad de calentamiento de 10 °C min-1. Las temperaturas de inicio (Ti, °C), pico (Tp, °C) y final (Tf, °C), y la diferencia de entalpia (∆H, J g-1) se obtuvieron directamente con el programa TA Instruments 2010 versión 2.1. Las determi-naciones fueron por triplicado.
Para estudiar la retrogradación de los almidones las muestras gelatinizadas se almacenaron 7 d a 4 °C, después se equilibraron por 1 h a temperatura ambiente y se analizaron en las mismas condiciones de barrido de gelatinización. Los parámetros de Ti, Tp, Tf (
oC) y DH (Jg-1) de retrogradación se colocaron con el programa de TA Instrument.
ResultAdos y dIscusIón
Microscopía electrónica de barrido
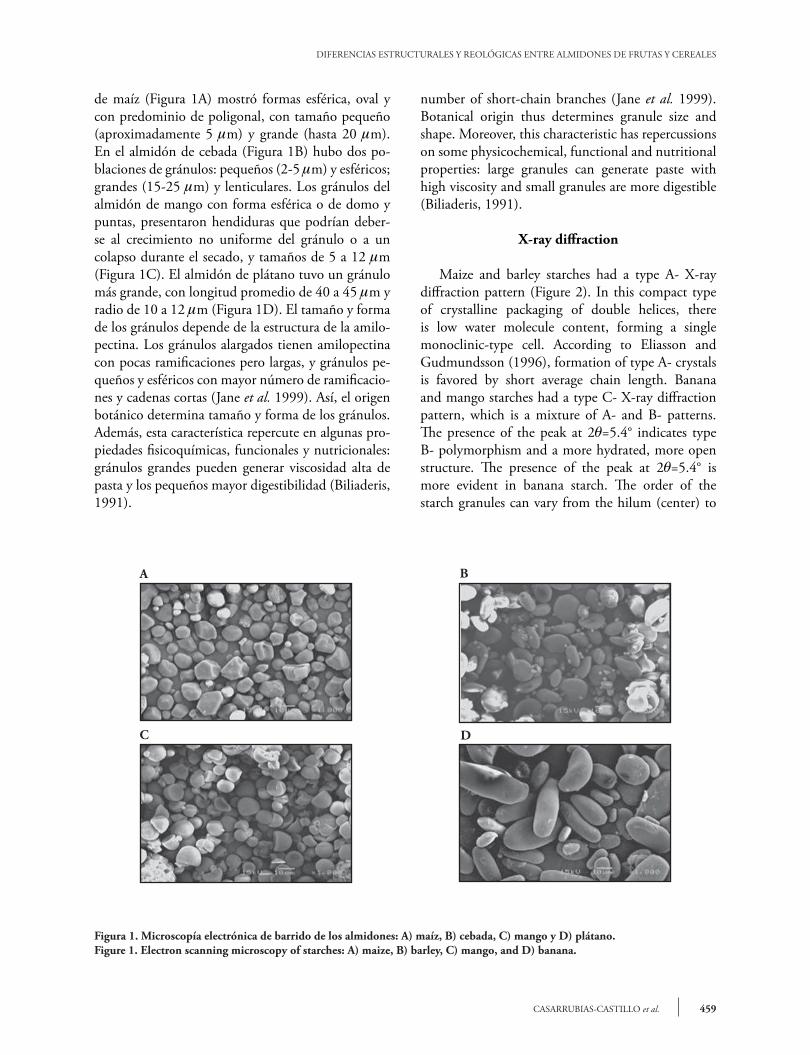
Los gránulos de los almidones de cereales y frutos difirieron en su morfología (Figura 1). El almidón
sweep at this final temperature (Stage 2). To determine the linear viscoelastic region (RVL), a heating-cooling rate of 2.5 °C min-1
was used. Frequency sweeps were in the interval of 0.1 to 10 Hz, with strain amplitude of 0.5 %, using the same heating-cooling procedure. In the two stages, storage (G’, Pa) and loss (G”, Pa) moduli were obtained. Determinations were done in triplicate.
Thermal characterization
Thermal properties of gelatinization and retrogradation were evaluated with a differential scanning calorimeter (TA Instruments 2010; New Castle, USA). Starch gelatinization was evaluated using the method proposed by Paredes-López et al. (1994); 2 mg of dry sample was placed on an aluminum pan with 7 mL de-ionized water and was left to equilibrate to room temperature for 1 h before analysis. An empty pan was used as reference. The equilibrated sample was then subjected to a program of heating in the interval of 30 to 120 °C with a heating rate of 10 °C min-1. The initial (Ti, °C), peak (Tp, °C) and final (Tf, °C) temperatures, and the enthalpy (∆H, J g-1) were obtained directly with the software TA Instruments 2010 version 2.1. Determinations were done in triplicate.
For the starch retrogradation study, the gelatinized samples were stored for 7 d at 4 °C, after which they were left to equilibrate to room temperature for 1 h. Samples were analyzed at the same conditions as those for gelatinization. The retrogradation parameters Ti, Tp, Tf (°C) and DH (J g-1) were calculated with the TA Instruments software.
Results And dIscussIon
Electron scanning microscopy
Cereal and fruit starch granules differ in morphology (Figure 1). Maize starch granules (Figure 1A) exhibited spherical, oval and polygonal shapes, polygonal predominating, and small (approximately 5 mm) and large (up to 20 mm) sizes. In barley starch (Figure 1B) there were two populations of granules: small (2-5 mm) and spherical; large (15-25 mm) and lenticular. Mango starch granules, spherical or dome-shaped and split, had fissures possibly caused by uneven growth of the granule or by a collapse during drying; sizes were from 5 to 12 mm (Figure 1C). Banana starch had larger granules with average length of 40 to 45 mm and radius of 10 to 12 mm (Figure 1D). The size and shape of the granules depend on the structure of amylopectin. Long granules have amylopectin with few, but long, branches, while small spherical granules have a larger
459CASARRUBIAS-CASTILLO et al.
DIFERENCIAS ESTRUCTURALES Y REOLÓGICAS ENTRE ALMIDONES DE FRUTAS Y CEREALES
de maíz (Figura 1A) mostró formas esférica, oval y con predominio de poligonal, con tamaño pequeño (aproximadamente 5 mm) y grande (hasta 20 mm). En el almidón de cebada (Figura 1B) hubo dos po-blaciones de gránulos: pequeños (2-5 mm) y esféricos; grandes (15-25 mm) y lenticulares. Los gránulos del almidón de mango con forma esférica o de domo y puntas, presentaron hendiduras que podrían deber-se al crecimiento no uniforme del gránulo o a un colapso durante el secado, y tamaños de 5 a 12 mm (Figura 1C). El almidón de plátano tuvo un gránulo más grande, con longitud promedio de 40 a 45 mm y radio de 10 a 12 mm (Figura 1D). El tamaño y forma de los gránulos depende de la estructura de la amilo-pectina. Los gránulos alargados tienen amilopectina con pocas ramificaciones pero largas, y gránulos pe-queños y esféricos con mayor número de ramificacio-nes y cadenas cortas (Jane et al. 1999). Así, el origen botánico determina tamaño y forma de los gránulos. Además, esta característica repercute en algunas pro-piedades fisicoquímicas, funcionales y nutricionales: gránulos grandes pueden generar viscosidad alta de pasta y los pequeños mayor digestibilidad (Biliaderis, 1991).
Figura 1. Microscopía electrónica de barrido de los almidones: A) maíz, B) cebada, C) mango y D) plátano.Figure 1. Electron scanning microscopy of starches: A) maize, B) barley, C) mango, and D) banana.
A B
C D
number of short-chain branches (Jane et al. 1999). Botanical origin thus determines granule size and shape. Moreover, this characteristic has repercussions on some physicochemical, functional and nutritional properties: large granules can generate paste with high viscosity and small granules are more digestible (Biliaderis, 1991).
X-ray diffraction
Maize and barley starches had a type A- X-ray diffraction pattern (Figure 2). In this compact type of crystalline packaging of double helices, there is low water molecule content, forming a single monoclinic-type cell. According to Eliasson and Gudmundsson (1996), formation of type A- crystals is favored by short average chain length. Banana and mango starches had a type C- X-ray diffraction pattern, which is a mixture of A- and B- patterns. The presence of the peak at 2q=5.4° indicates type B- polymorphism and a more hydrated, more open structure. The presence of the peak at 2q=5.4° is more evident in banana starch. The order of the starch granules can vary from the hilum (center) to
AGROCIENCIA, 1 de julio - 15 de agosto, 2012
VOLUMEN 46, NÚMERO 5460
Difracción de rayos X
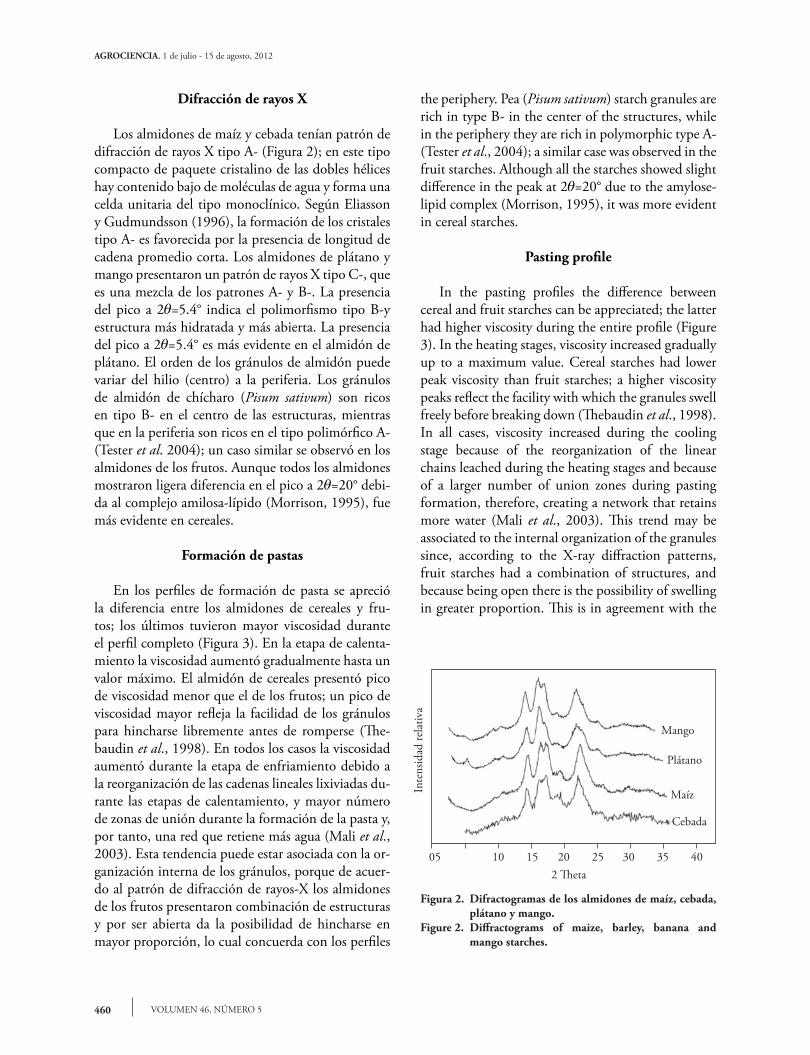
Los almidones de maíz y cebada tenían patrón de difracción de rayos X tipo A- (Figura 2); en este tipo compacto de paquete cristalino de las dobles hélices hay contenido bajo de moléculas de agua y forma una celda unitaria del tipo monoclínico. Según Eliasson y Gudmundsson (1996), la formación de los cristales tipo A- es favorecida por la presencia de longitud de cadena promedio corta. Los almidones de plátano y mango presentaron un patrón de rayos X tipo C-, que es una mezcla de los patrones A- y B-. La presencia del pico a 2q=5.4° indica el polimorfismo tipo B-y estructura más hidratada y más abierta. La presencia del pico a 2q=5.4° es más evidente en el almidón de plátano. El orden de los gránulos de almidón puede variar del hilio (centro) a la periferia. Los gránulos de almidón de chícharo (Pisum sativum) son ricos en tipo B- en el centro de las estructuras, mientras que en la periferia son ricos en el tipo polimórfico A- (Tester et al. 2004); un caso similar se observó en los almidones de los frutos. Aunque todos los almidones mostraron ligera diferencia en el pico a 2q=20° debi-da al complejo amilosa-lípido (Morrison, 1995), fue más evidente en cereales.
Formación de pastas
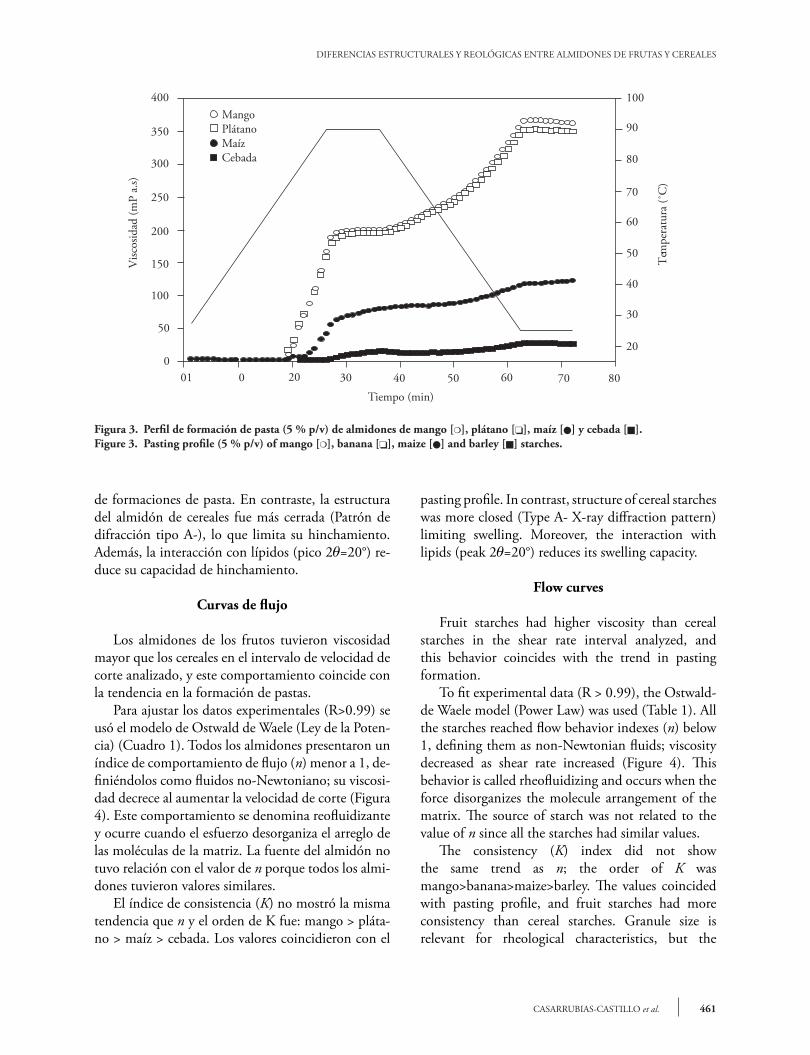
En los perfiles de formación de pasta se apreció la diferencia entre los almidones de cereales y fru-tos; los últimos tuvieron mayor viscosidad durante el perfil completo (Figura 3). En la etapa de calenta-miento la viscosidad aumentó gradualmente hasta un valor máximo. El almidón de cereales presentó pico de viscosidad menor que el de los frutos; un pico de viscosidad mayor refleja la facilidad de los gránulos para hincharse libremente antes de romperse (The-baudin et al., 1998). En todos los casos la viscosidad aumentó durante la etapa de enfriamiento debido a la reorganización de las cadenas lineales lixiviadas du-rante las etapas de calentamiento, y mayor número de zonas de unión durante la formación de la pasta y, por tanto, una red que retiene más agua (Mali et al., 2003). Esta tendencia puede estar asociada con la or-ganización interna de los gránulos, porque de acuer-do al patrón de difracción de rayos-X los almidones de los frutos presentaron combinación de estructuras y por ser abierta da la posibilidad de hincharse en mayor proporción, lo cual concuerda con los perfiles
Figura 2. Difractogramas de los almidones de maíz, cebada, plátano y mango.
Figure 2. Diffractograms of maize, barley, banana and mango starches.
05 10 15 20 25 30 35 40
Mango
Plátano
Maíz
Cebada
Inte
nsid
ad re
lativ
a
the periphery. Pea (Pisum sativum) starch granules are rich in type B- in the center of the structures, while in the periphery they are rich in polymorphic type A- (Tester et al., 2004); a similar case was observed in the fruit starches. Although all the starches showed slight difference in the peak at 2q=20° due to the amylose-lipid complex (Morrison, 1995), it was more evident in cereal starches.
Pasting profile
In the pasting profiles the difference between cereal and fruit starches can be appreciated; the latter had higher viscosity during the entire profile (Figure 3). In the heating stages, viscosity increased gradually up to a maximum value. Cereal starches had lower peak viscosity than fruit starches; a higher viscosity peaks reflect the facility with which the granules swell freely before breaking down (Thebaudin et al., 1998). In all cases, viscosity increased during the cooling stage because of the reorganization of the linear chains leached during the heating stages and because of a larger number of union zones during pasting formation, therefore, creating a network that retains more water (Mali et al., 2003). This trend may be associated to the internal organization of the granules since, according to the X-ray diffraction patterns, fruit starches had a combination of structures, and because being open there is the possibility of swelling in greater proportion. This is in agreement with the
461CASARRUBIAS-CASTILLO et al.
DIFERENCIAS ESTRUCTURALES Y REOLÓGICAS ENTRE ALMIDONES DE FRUTAS Y CEREALES
de formaciones de pasta. En contraste, la estructura del almidón de cereales fue más cerrada (Patrón de difracción tipo A-), lo que limita su hinchamiento. Además, la interacción con lípidos (pico 2q=20°) re-duce su capacidad de hinchamiento.
Curvas de flujo
Los almidones de los frutos tuvieron viscosidad mayor que los cereales en el intervalo de velocidad de corte analizado, y este comportamiento coincide con la tendencia en la formación de pastas.
Para ajustar los datos experimentales (R>0.99) se usó el modelo de Ostwald de Waele (Ley de la Poten-cia) (Cuadro 1). Todos los almidones presentaron un índice de comportamiento de flujo (n) menor a 1, de-finiéndolos como fluidos no-Newtoniano; su viscosi-dad decrece al aumentar la velocidad de corte (Figura 4). Este comportamiento se denomina reofluidizante y ocurre cuando el esfuerzo desorganiza el arreglo de las moléculas de la matriz. La fuente del almidón no tuvo relación con el valor de n porque todos los almi-dones tuvieron valores similares. El índice de consistencia (K) no mostró la misma tendencia que n y el orden de K fue: mango > pláta-no > maíz > cebada. Los valores coincidieron con el
Figura 3. Perfil de formación de pasta (5 % p/v) de almidones de mango [m], plátano [o], maíz [l] y cebada [n].Figure 3. Pasting profile (5 % p/v) of mango [m], banana [o], maize [l] and barley [n] starches.
pasting profile. In contrast, structure of cereal starches was more closed (Type A- X-ray diffraction pattern) limiting swelling. Moreover, the interaction with lipids (peak 2q=20°) reduces its swelling capacity.
Flow curves
Fruit starches had higher viscosity than cereal starches in the shear rate interval analyzed, and this behavior coincides with the trend in pasting formation.
To fit experimental data (R > 0.99), the Ostwald-de Waele model (Power Law) was used (Table 1). All the starches reached flow behavior indexes (n) below 1, defining them as non-Newtonian fluids; viscosity decreased as shear rate increased (Figure 4). This behavior is called rheofluidizing and occurs when the force disorganizes the molecule arrangement of the matrix. The source of starch was not related to the value of n since all the starches had similar values.
The consistency (K) index did not show the same trend as n; the order of K was mango>banana>maize>barley. The values coincided with pasting profile, and fruit starches had more consistency than cereal starches. Granule size is relevant for rheological characteristics, but the
400
350
300
250
200
150
100
0
50
01 0
20
80706050403020
30
40
50
100
90
80
70
60
Visc
osid
ad (m
P a.
s)
Tem
pera
tura
(˚C
)
Tiempo (min)
MangoPlátanoMaízCebada

AGROCIENCIA, 1 de julio - 15 de agosto, 2012
VOLUMEN 46, NÚMERO 5462
comportamiento de formación de pasta y los almi-dones de los frutos tuvieron más consistencia que los de los cereales. El tamaño de gránulo es relevante en las características reológicas, pero es más importante la organización interna de sus componentes. El almi-dón de plátano tuvo tamaño mayor de gránulo, pero el de mango tuvo valores mayores en la formación de pastas y curvas de flujo.
Método oscilatorio de amplitud baja: cinética de gelificación
La gelatinización se caracteriza por el incremen-to de los módulos dinámicos, como los módulos de almacenamiento (G’) y de pérdida (G’’), atribuídos al hinchamiento de los gránulos y la lixiviación de la amilosa. Posterior al calentamiento, cuando la dis-persión de almidón gelatinizado se enfría, se forma un gel. Para analizar sus características dinámicas se definió la región viscoelástica lineal con la amplitud de la deformación (gráficos no mostrados) en esta región. Las propiedades reológicas no dependen del esfuerzo ni de la deformación. Con los gráficos se es-tableció que 0.5 % de deformación es adecuado para realizar los barridos de frecuencia en la cinética de calentamiento-enfriamiento.
En los barridos de frecuencia a 90 y 25 °C, G’ fue mayor que G’’ en el intervalo de frecuencia ana-lizado; a 90 °C fue el hinchamiento mayor de los gránulos (gráfico no mostrado) donde el almidón de plátano alcanzó los valores mayores de G’ y de G’’, lo que se relaciona al tamaño mayor de sus gránulos. A 25 °C (Figura 5), todos los almidones tuvieron G’ constante en el intervalo de frecuencia analizado y
Figura 5. Barrido de frecuencia de almidones durante la segunda etapa (25 °C) al 5 % (p/v) y 0.5 % de deformación. Símbolos vacios, módulo de alma-cenamiento (G’) y símbolos rellenos, módulo de pérdida (G’’).
Figure 5. Frequency sweep of the starches during the second stage (25 °C) at 5 % (w/v) and 0.5 % strain. Empty symbols, storage module (G’) and filled in symbols, loss module (G”).
100
10
1
Frecuencia (Hz)0.1 1 10
G’ G
” (P
a)
G’ PlátanoG’ CebadaG’ MangoG’ Maíz
G” PlátanoG” CebadaG” MangoG” Maíz
Cuadro 1. Parámetros del modelo de Ostwald-de Waele (Ley de la potencia) para almidones de cebada, maíz, mango y plátano.
Table 1. Parameters of the Ostwald-de Waele (Power Law) model for barley, maize, mango and banana starches.
Almidón R n K
(Pa.sn)
Cebada 0.99 0.23 2.42Maíz 0.99 0.17 3.79Mango 0.99 0.16 14.42Plátano 0.99 0.22 6.34
n=índice de comportamiento de flujo, K=índice de consistencia v n=flow behavior index, K=consistency index.
Figura 4. Curvas de flujo de almidones (5 % p/v) de mango [m], plátano [o], maíz [l] y cebada [n].
Figura 4. Flow curves of mango [m], banana [o], maize [l] and barley [n] starches (5 % p/v).
1000
100
10
1
0.1
0.1 1 10 100
Visc
osid
ad (P
a.s)
MangoPlátanoMaízCebada
internal organization of its components is more important. Banana starch had the largest granules, but mango starch had higher values in pasting profile and flow curves.

463CASARRUBIAS-CASTILLO et al.
DIFERENCIAS ESTRUCTURALES Y REOLÓGICAS ENTRE ALMIDONES DE FRUTAS Y CEREALES
G” presentó dependencia ligera, manifestándose así el re-ordenamiento de la amilosa durante la forma-ción del gel y con ello la formación de la matriz tri-dimensional que ocluye a los gránulos de almidón ri-cos en amilopectina. El almidón de plátano también mostró los valores mayores de G’ y G”. De acuerdo con Espinosa-Solís et al. (2009) y Bello-Pérez et al. (2010), esta respuesta se debe al contenido mayor de amilosa (plátano 36.2 %, mango 31.1 %, maíz 29.7 % y cebada 28.4 %). Sin embargo, en los mó-dulos la tendencia fue almidón de plátano seguido de cebada, mango y maíz. El porcentaje de amilosa afecta la formación de la red tridimensional, pero la amilopectina en los gránulos de almidón hinchados también es importante. El almidón de cebada tiene menos amilosa y por tanto más amilopectina, por lo que su organización interna le permite mayor movi-lidad y mayor G’ respecto a los almidones de mango y maíz. El tamaño de granulo y contenido de amilosa fueron mayores en plátano; por tanto, su gel fue más resistente a la deformación y sus valores fueron de los módulos mayores.
Caracterización térmica
El almidón de cebada presentó los valores menores en la transición ocasionada por la gelatinización en la temperatura de pico (Tp, 61.8 °C) y en el cambio en entalpía (∆Hg, 10.4 J g-1) (Cuadro 2), mientras que los almidones de maíz y mango tuvieron valores similares, mayores a los de cebada y menores a los de plátano. Éste mostró temperatura pico de 77.4 °C y cambio en entalpia de 14.2 J g-1. La temperatura de gelatinización y el cambio de entalpía presentaron la misma tendencia que el tamaño de gránulos: ceba-da tuvo el tamaño menor de gránulo, maíz y mango
Low amplitude oscillatory method: kinetics of gelation
Gelatinization is characterized by an increase in dynamic moduli, such as storage (G’) and loss (G”) moduli, attributed to granule swelling and amylose leaching. After heating, when the gelatinized starch dispersion cools, a gel is formed. To analyze its dynamic characteristics the linear viscoelastic region was defined with the strain amplitude (graphs not shown) in this region. Rheological properties do not depend on stress or strain applied. With the graphs, it was established that a 0.5 % strain is suitable for the frequency scans sweeps in the kinetics of heating-cooling. The 90 and 25 °C frequency sweeps showed that G’ was higher than G” in the frequency interval analyzed; at 90 °C granules swelled more (graph not shown); banana starch reached the highest values of G’ and G”, related to the larger size of its granules. At 25 °C (Figure 5), all the starches had a constant G’ in the frequency interval analyzed and G” had slight dependence, thus manifesting re-ordering of amylose during gel formation and, with this, the formation of the tridimensional matrix that occludes the starch granules rich in amylopectin. Banana starch also had the highest G’ and G” values. According to Espinosa-Solis et al. (2009) and Bello-Pérez et al. (2010), this response is due to higher amylose content (banana 36.2 %, mango 31.1 %, maize 29.7 % and barley 28.4 %). However, in the moduli the trend was banana starch, followed by barley, mango and maize starches. The percentage of amylose affects the formation of the tri-dimensional network, but the amylopectin in swollen starch granules is also important. Barley starch has less
Cuadro 2. Temperaturas y entalpía de gelatinización de los almidones de cebada, maíz, mango y plátano.Table 2. Temperatures and gelatinization enthalpy of barley, maize, mango and banana starches.
Almidón Ti Tp Tf Ig ∆Hg
[°C] [°C] [°C] [°C] [Jg-1]
Cebada 57.6 ± 0.3 61.8 ± 0.3 73.9 ± 0.7 16.3 ± 0.4 10.4 ± 0.9Maíz 65.7 ± 0.1 71.2 ± 0.1 79.1 ± 0.8 13.5 ± 0.8 11.0 ± 0.6Mango 66.7 ± 0.1 71.9 ± 0.2 80.7 ± 1.0 14.0 ± 1.0 11.5 ± 0.7Plátano 71.3 ± 0.2 77.4 ± 0.3 88.7 ± 0.9 17.3 ± 0.8 14.2 ± 0.9
Ti=temperatura de inicio; Tp=temperatura de pico; Tf=temperatura final. Intervalo de gelatinización: Ig=Tf-Ti. ∆Hg=entalpía de gela-tinización v Ti=initial temperature; Tp=peak temperature; Tf= final temperature. Gelatinization interval: Ig=Tf-Ti. ∆Hg=gelatinization enthalpy.
AGROCIENCIA, 1 de julio - 15 de agosto, 2012
VOLUMEN 46, NÚMERO 5464
tuvieron valor similar y el de plátano fue el mayor. Tester (1997) señala que el grado de perfección de los cristales refleja temperatura de gelatinización mayor, pero la heterogeneidad de los gránulos y cristales presentes también se puede evaluar con el intervalo de gelatinización. El almidón de plátano mostró el mayor intervalo, similar al de cebada, y menor al de mango y maíz; esta tendencia es como la observada en G’y G”.
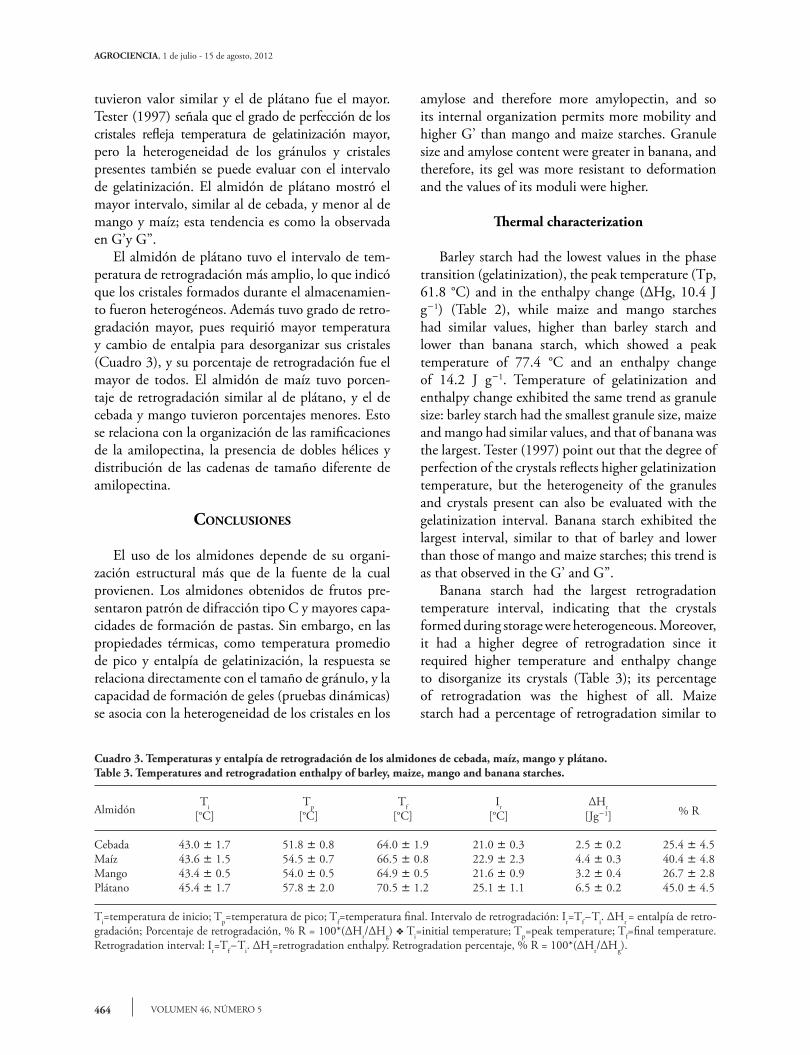
El almidón de plátano tuvo el intervalo de tem-peratura de retrogradación más amplio, lo que indicó que los cristales formados durante el almacenamien-to fueron heterogéneos. Además tuvo grado de retro-gradación mayor, pues requirió mayor temperatura y cambio de entalpia para desorganizar sus cristales (Cuadro 3), y su porcentaje de retrogradación fue el mayor de todos. El almidón de maíz tuvo porcen-taje de retrogradación similar al de plátano, y el de cebada y mango tuvieron porcentajes menores. Esto se relaciona con la organización de las ramificaciones de la amilopectina, la presencia de dobles hélices y distribución de las cadenas de tamaño diferente de amilopectina.
conclusIones
El uso de los almidones depende de su organi-zación estructural más que de la fuente de la cual provienen. Los almidones obtenidos de frutos pre-sentaron patrón de difracción tipo C y mayores capa-cidades de formación de pastas. Sin embargo, en las propiedades térmicas, como temperatura promedio de pico y entalpía de gelatinización, la respuesta se relaciona directamente con el tamaño de gránulo, y la capacidad de formación de geles (pruebas dinámicas) se asocia con la heterogeneidad de los cristales en los
Cuadro 3. Temperaturas y entalpía de retrogradación de los almidones de cebada, maíz, mango y plátano.Table 3. Temperatures and retrogradation enthalpy of barley, maize, mango and banana starches.
Almidón Ti Tp Tf Ir ∆Hr % R [°C] [°C] [°C] [°C] [Jg-1]
Cebada 43.0 ± 1.7 51.8 ± 0.8 64.0 ± 1.9 21.0 ± 0.3 2.5 ± 0.2 25.4 ± 4.5Maíz 43.6 ± 1.5 54.5 ± 0.7 66.5 ± 0.8 22.9 ± 2.3 4.4 ± 0.3 40.4 ± 4.8Mango 43.4 ± 0.5 54.0 ± 0.5 64.9 ± 0.5 21.6 ± 0.9 3.2 ± 0.4 26.7 ± 2.8Plátano 45.4 ± 1.7 57.8 ± 2.0 70.5 ± 1.2 25.1 ± 1.1 6.5 ± 0.2 45.0 ± 4.5
Ti=temperatura de inicio; Tp=temperatura de pico; Tf=temperatura final. Intervalo de retrogradación: Ir=Tf-Ti. ∆Hr = entalpía de retro-gradación; Porcentaje de retrogradación, % R = 100*(∆Hr/∆Hg) v Ti=initial temperature; Tp=peak temperature; Tf=final temperature. Retrogradation interval: Ir=Tf-Ti. ∆Hr=retrogradation enthalpy. Retrogradation percentaje, % R = 100*(∆Hr/∆Hg).
amylose and therefore more amylopectin, and so its internal organization permits more mobility and higher G’ than mango and maize starches. Granule size and amylose content were greater in banana, and therefore, its gel was more resistant to deformation and the values of its moduli were higher.
Thermal characterization
Barley starch had the lowest values in the phase transition (gelatinization), the peak temperature (Tp, 61.8 °C) and in the enthalpy change (∆Hg, 10.4 J g-1) (Table 2), while maize and mango starches had similar values, higher than barley starch and lower than banana starch, which showed a peak temperature of 77.4 °C and an enthalpy change of 14.2 J g-1. Temperature of gelatinization and enthalpy change exhibited the same trend as granule size: barley starch had the smallest granule size, maize and mango had similar values, and that of banana was the largest. Tester (1997) point out that the degree of perfection of the crystals reflects higher gelatinization temperature, but the heterogeneity of the granules and crystals present can also be evaluated with the gelatinization interval. Banana starch exhibited the largest interval, similar to that of barley and lower than those of mango and maize starches; this trend is as that observed in the G’ and G”.
Banana starch had the largest retrogradation temperature interval, indicating that the crystals formed during storage were heterogeneous. Moreover, it had a higher degree of retrogradation since it required higher temperature and enthalpy change to disorganize its crystals (Table 3); its percentage of retrogradation was the highest of all. Maize starch had a percentage of retrogradation similar to
465CASARRUBIAS-CASTILLO et al.
DIFERENCIAS ESTRUCTURALES Y REOLÓGICAS ENTRE ALMIDONES DE FRUTAS Y CEREALES
almidones, dada por el intervalo de gelatinización. Las diferencias fisicoquímicas, funcionales y reológi-cas de los almidones de cereales y frutos se deben a sus características de tamaño, forma y arreglo crista-lino, por lo cual puede tener diferentes aplicaciones.
AgRAdecImIentos
Se agradece el apoyo económico de SIP-IPN, COFAA-IPN y EDI-IPN.
lIteRAtuRA cItAdA
Adkins, G. K., and C. T. Greenwood. 1966. The isolation of cereal starches in the laboratory. Starch/Starke 7: 213-218.
Bello-Pérez, L. A., and O. Paredes-López. 2009. Starches of some food crops, changes during processing and their nutraceuti-cal potential. Food Eng. Rev. 1: 50-65.
Bello-Pérez, L. A., M. M. Sánchez-Rivera, C. Núñez-Santiago, S. L. Rodríguez-Ambriz, and A. D. Román-Gutiérrez. 2010. Effect of the pearled in the isolation and the morphologi-cal, physicochemical and rheological characteristics of barley starch. Carbohydrate Polymers 81: 63-69.
Biliaderis, C. G. 1991. The structure and interactions of starch with food constituents. Can. J. Physiol. Pharmacol. 69: 60-78.
Eliasson, A. C., and M. Gudmundsson. 1996. Starch: Physi-cochemical and functional aspects. In: Eliasson, A. C. (ed). Carbohydrates in Food. Marcel Dekker Inc., New York, U.S.A. pp: 431-482.
Espinosa-Solis, V., J. L. Jane, and L. A. Bello-Pérez. 2009. Phy-sicochemical characteristics of starches from unripe fruits of mango and banana. Starch/starke 61: 291-299.
Flores-Gorosquera, E., F. J. García-Suárez, E. Flores-Huicochea, M. C. Núñez-Santiago, R. A. González-Soto, y L. A. Bello-Pérez. 2004. Rendimiento del proceso de extracción de almi-dón a partir de frutos de plátano (Musa paradisiaca) estudio en planta piloto. Acta Cientifica Venezolana 55: 86-90.
Hsu, S., S. Lu, and C. Huang. 2000. Viscoelastic changes of rice starch suspensions during gelatinization. J. Food Sci. 65: 215–220.
Jane, J., Y. Y. Chen, L. F. Lee, A. E. McPherson, K. S. Wong, M. Radosavljevic, and T. Kasemsuwan. 1999. Effects of amylo-pectin branch chain length and amylose content on the ge-latinization and pasting properties of starch. Cereal Chem. 76: 629–637.
Kulp, K. 1973. Characteristics of small-granule starch of flour wheat. Cereal Chem. 50: 666–679.
Mali, S., C. Ferrero, V. Redigonda, A. P. Belia, M. V. E. Grossmann, and N. E. Zaritzky. 2003. Influence of pH and hydrocolloids addition on yam (Discorea alata) starch pastes stability. Lebensmittel–Wissenschaft Und-Technologie 36: 475-481.
Morrison, W. R. 1995. Starch lipids and how they relate to starch granule structure and functionality. Cereal Foods World 40: 437–446.
Ottenhof, M. A. 2003. A multi-technique study of the retrogra-dation of concentrated starch systems. Ph.D. Thesis. Divi-sion of Food Science. University of Nottingham, UK.
Paredes-López, O., L. A. Bello-Pérez, and M. G. López. 1994. Amylopectin structural, gelatinization and retrogradation studies. Food Chem. 50: 411-418.
Rivas-González, M., M. G. Méndez-Montealvo, M. M. Sánchez-Rivera, M. C. Núñez-Santiago, y L. A. Bello- Pérez. 2008. Caracterización morfológica, molecular y fisicoquímica de almidón de plátano oxidado y lintnerizado. Agrociencia 42: 487-497.
Singh, N., J. Singh, L. Kaur, N. Singh-Sodhi, and B. Singh-Gill. 2003. Morphological, thermal and rheological properties of starches from different botanical sources. Food Chem. 81: 219-231.
Steffe, J. F. 1992. Rheological Methods in the Food Process En-gineering. Freeman Press. East Lansing. Michigan. 418 p.
Tecante, A., and J. L. Doublier. 1999. Steady flow and viscoelas-tic behaviour of crosslinked waxy corn starch-k-carrageenan pastes and gels. Carbohydrate Polymers 40: 221-231.
Tester, R. F., J. Karkalas, and X. Qi. 2004. Starch-composition, fine structure and architecture. J. Cereal Sci. 39: 151-165.
Tester, R. F. 1997. Starch: the polysaccharide fractions. In: Starch: Structure and Functionality. UK: The Royal Society of Chemistry. Cambridge. pp: 163-171.
that of banana, while barley and mango had lower percentages. This is related to the organization of amylopectin branches, the presence of double helices and the distribution of long chains in amylopectin.
conclusIons
The use of starches depends on their structural organization more than on their source. Starches obtained from fruits had a type C X-ray diffraction pattern and higher capacity of pasting formation. However, in the thermal properties such as average peak temperature and enthalpy of gelatinization, the response is directly related to granule size, while gel formation capacity (dynamic tests) is associated with heterogeneity of the crystals in the starches, given by the gelatinization interval. Physicochemical, functional and rheological differences between cereal and fruit starches are due to their size, shape and crystal arrangement that make them appropriate for different applications.
—End of the English version—
pppvPPP
AGROCIENCIA, 1 de julio - 15 de agosto, 2012
VOLUMEN 46, NÚMERO 5466
Thebaudin, J. Y., A. C. Lefebvre, and J. L Doublier. 1998. Rheo-logy of starch pastes from starches of different origins: appli-cations to starch-based sauces. Lebensmittel–Wissenschaft und-Technologie 31: 354-360.
Wiesenborn, D. P., P. H. Orr, H. H. Casper, and B. K. Tacke. 1994. Potato starch behaviour as related to some physical/chemical properties. J. Food Sci. 59: 644–648.