conservation biogeography of anurans in brazilian cerrado
TRANSCRIPT
ORI GIN AL PA PER
Conservation biogeography of anurans in BrazilianCerrado
Jose Alexandre Felizola Diniz-Filho ÆLuis Mauricio Bini Æ Mıriam Plaza Pinto ÆThiago Fernando L. V. B. Rangel Æ Priscilla Carvalho ÆSibelius Lellis Vieira Æ Rogerio Pereira Bastos
Received: 30 January 2006 / Accepted: 27 February 2006� Springer Science+Business Media, Inc. 2006
Abstract The increasing rates of declines in anuran populations worldwide are creating
demands for urgent strategies to maximize conservation efforts. This may be critical in
regions for which few detailed data on diversity, abundance and distribution are available,
such as in the Cerrado of Central Brazil. In this paper, we used a macroecological approach
based on the extent of occurrence of 131 species of Anura (Amphibia) in the Cerrado region
to design a regional network of potential areas that preserves all anuran species. The final
network, obtained using a simulation annealing algorithm based on complementarity, has a
total of 17 cells, widely distributed throughout the biome. Minimum costs solutions were
obtained in respect to total human population size, soybean production and bovine density,
because these are the factors associated with human occupation that historically are more
likely to cause broad scale habitat losses. The macro-scale approach used here can provide
overall guidelines for conservation and define the focus for more local and effective con-
servation efforts.
Keywords Anurans Æ Cerrado Æ Macroecology Æ Optimization Æ Reserve network
J. A. F. Diniz-Filho Æ L. M. Bini Æ R. P. BastosDepartamento de Biologia Geral, ICB, Universidade Federal de Goias, Cx. P. 131, CEP 74001-970Goiania, GO, Brasil
J. A. F. Diniz-Filho (&)Departamento de Biologia/MCAS, Universidade Catolica de Goias (UCG), Goiania, Goias, Brasile-mail: [email protected]: +55-062-5211480
M. P. Pinto Æ T. Fernando L. V. B. RangelGraduate program in Ecology & Evolution, ICB, Universidade Federal de Goias, Goiania, Brasil
P. CarvalhoGraduate program in Ecology of Continental Aquatic Ecosystems, NUPELIA, Universidade Estadualde Maringa, Parana, Brasil
S. L. VieiraDepartamento de Ciencia da Computacao/MCAS, Universidade Catolica de Goias (UCG), Goiania,Goias, Brasil
123
Biodivers Conserv (2006)DOI 10.1007/s10531-006-9010-4

Introduction
Reservation is the main strategy adopted by governments to preserve biodiversity
(Margules and Pressey 2000; Aaron et al. 2001). Although this strategy could be effective
to diminish habitat loss if the reserves were selected and managed adequately, scientific
criterions are hardly taken into account when a reserve is to be established (Possingham
et al. 2000; Aaron et al. 2001). Unfortunately, political and economic interests are usually
more important than scientific criterions when establishing reserve networks, and many
reserves encompass areas of unsuitable habitat for the maintenance of native species, or are
defined by cultural or scenic reasons only.
The most important criterion for locating and designing reserve systems should be to
achieve maximum representation (or persistence) of biodiversity with the smallest possible
cost (Pressey et al. 1997; Margules and Pressey 2000). This optimization involves many
different aspects, including spatial distribution of reserves, their connections, overall area,
shape and percentage of suitable habitats ensuring species persistence (Possingham et al.
2000; Cabeza and Moilanen 2001; Briers 2002; Lawler et al. 2003; Williams et al. 2004).
Also, socio-economic factors associated with the development of human populations at
local and regional scales, including population size, growth rate and land use, should be
taken into account in the optimization models (Abbitt et al. 2000). This is potentially
important because many recent papers found broad-scale correlations between species
richness and human population density (Balmford et al. 2001; Araujo 2003; Chown et al.
2003; Luck et al. 2004; Gaston and Evans 2004). These correlations have been interpreted
as an indicative that processes driving species richness, mainly related to high ecological
productivity and occupation of more suitable habitats, also drive human populations, under
the ‘more-individuals’ energy hypothesis (Balmford et al. 2001). More importantly, be-
cause of this positive correlation, a conflict between biodiversity conservation and human
development might occur, both because of direct impacts on the environment (i.e., habitat
conversion) or because of higher land prices and increase in other associated costs to
conserve biodiversity (Luck et al. 2004; but see Faith 2001a, b; Huston 2001; Diniz-Filho
et al. 2006).
There is a growing concern about the decline in amphibian populations worldwide
(Stuart et al. 2004), creating demands for urgent strategies to maximize conservation ef-
forts for these populations, especially in regions in which few detailed data on diversity,
abundance and distribution are available (Young et al. 2000). This is exactly the case of
Brazilian Cerrado, one of the global biodiversity hotspots, in which rates of habitat con-
version are very high (due to a recent expansion of soybean cultures and cattle ranching
(Klink and Machado 2005) and may imply in a quick loss of many endemic and rare
species (Sala et al. 2000; Myers et al. 2000; Stuart et al. 2004). Previous attempts to
establish conservation priorities in the Cerrado region were usually based on subjective
criteria (but see Cavalcanti and Joly 2002). However, lack of detailed data on species
distribution and abundance for most groups of organisms constrained many of these pre-
vious initiatives. It is also important to note that anurans have the highest level of ende-
mism among vertebrates in Cerrado region (Klink and Machado 2005; Silvano and Segalla
2005), so they may be an important indicator group to establish a network with a relatively
high efficiency in terms of preserving more of the biome biodiversity.
In this paper we used macroecological data of geographic distribution (extents of
occurrence, following Gaston 1994, 2003) to evaluate spatial patterns in species richness
and endemism of anurans in Cerrado. More importantly, we evaluated how these patterns
Biodivers Conserv (2006)
123

can be optimally represented using complementarity-based and irrepleaceability proce-
dures, defining which regions of the biome are more important to represent total species
richness of anurans. We also found which networks represent all Anuran species but,
simultaneously, have the minimum amount of human activities (measured as human
population and estimates of intensity of soybean cultures and cattle ranching). Although
broad-scale approaches are usually considered coarse to establish reserve networks (e.g.,
Gaston and Rodrigues 2003), they allow an overview of diversity patterns and, thus, can
furnish overall guidelines for downscaled conservation strategies and help defining the
focus for more local and effective conservation efforts, within the new framework of
conservation biogeography (Whittaker et al. 2005). This hierarchical approach may be
particularly useful in poorly known and threatened regions of the world, which demands
urgent actions due to a combination of high rates of habitat loss and fast human occupation,
for instance as the case of Brazilian’s Cerrado.
Methods
Geographic distributions, measured as extents of occurrence based on minimum convex
polygons (see Gaston 2003), for the 131 species of anurans that can be found in Brazilian
Cerrado (e.g., Colli et al. 2002) were mapped with a spatial resolution of 1� grid cell, using
as a basis a grid with 181 cells covering the Cerrado Biome (Fig. 1). These 131 species are
distributed in 6 families and 29 genera, out of which 47 are endemics to Cerrado region
(Table 1). A detailed species list and references are available from the authors upon
request (see also Diniz-Filho et al. 2004a, b, 2005, 2006, for a discussions of this dataset).
A binary matrix was constructed by recording the species whose geographic ranges
overlap each cell, and species richness was calculated by summing the species present in
cells. Total species richness, richness for endemic species and corrected weighted ende-
mism (CWE - given by the average of the inverse of geographic ranges of each species in
the Cerrado, for each cell—see Bickford et al. 2004), were also mapped.
Based on the occurrence of the 131 species in the 181 cells of the Cerrado biome, we
used an optimization procedure to select the minimum number of cells necessary to rep-
resent all species at least once (Church et al. 1996; Possingham et al. 2000; Polasky et al.
2000, 2001; Cabeza and Moilanen 2001). Simulated annealing procedure on Site Selection
Mode (SSM) routine of SITES software (Andelman et al. 1999) was used to find these
combinations of cells (a network), by performing one hundred runs with 10,000,000
iterations. A relatively high value of penalty for loosing a species was set, so all solutions
tended to represent all species with a minimum number of cells.
There are frequently multiple ways (i.e., combination of cells) that satisfy this repre-
sentation goal, and the solutions were combined to generate a map that gives the relative
importance of each cell in these multiple minimum networks, by considering the frequency
in which it occurs in the representative combinations of cells or alternative networks. This
is an estimate of the irreplaceability of the cell (see Meir et al. 2004), ranging from 0.0
(minimum irreplaceability) to 1.0 (maximum irreplaceability), measuring the likelihood of
a given cell to ensure achievement of a set of conservation targets (see also Ferrier et al.
2000).
We also added to SSM a cost for each cell, estimated by different variables expressing
human occupation of the Cerrado, and minimized this cost, while representing all species
at least once. Some previous studies minimized directly only the total number of people
Biodivers Conserv (2006)
123

within the networks (i.e., Chown et al. 2003). However, the recent mode of human
occupation in Cerrado is based on a fast expansion of highly technological agriculture and
extensive cattle ranching practices (Klink and Machado 2005), which are, in turn, usually
weakly correlated with human population density. For example, the Pearson’s r coeffi-
cients of correlation between human population density and soybean productivity and
between human population density and bovine herd density were 0.11 and 0.29, respec-
tively. Thus, due to this particularity, we also generate networks with a minimum amount
of soybean productivity and density of bovine, as described below.
Data for human population for each cell in the Cerrado region was obtained from the
official census of Brazilian population for the year 2000, done by the Brazilian Agency of
Geography and Statistics (IBGE) (see www.ibge.gov.br). For each cell covering the
Cerrado biome, human population was obtained by summing urban or rural population
from 1054 municipalities whose geopolitical limits are within the Cerrado borders. The
same procedure was used to obtain the average soybean productivity and bovine density
for each cell, based on data of official Brazilian Agricultural Census, from 1996, also from
IBGE. These two variables were used as surrogates of occupation by technological agri-
culture and extensive cattle ranching (see Rangel et al. in press, for a multivariate analysis
of socio-economic factors of Cerrado occupation). Thus, amongst many possible solutions
that represent all species, we also found a combination of cells in which there is smallest
total human occupation, and so may be useful to minimize potential conservation conflicts
(Balmford et al. 2001; Diniz-Filho et al. 2006).
23 - 32
33 - 42
43 - 51
52 - 61
62 - 71
Fig. 1 Spatial patterns of species richness of anurans in the Cerrado region
Biodivers Conserv (2006)
123
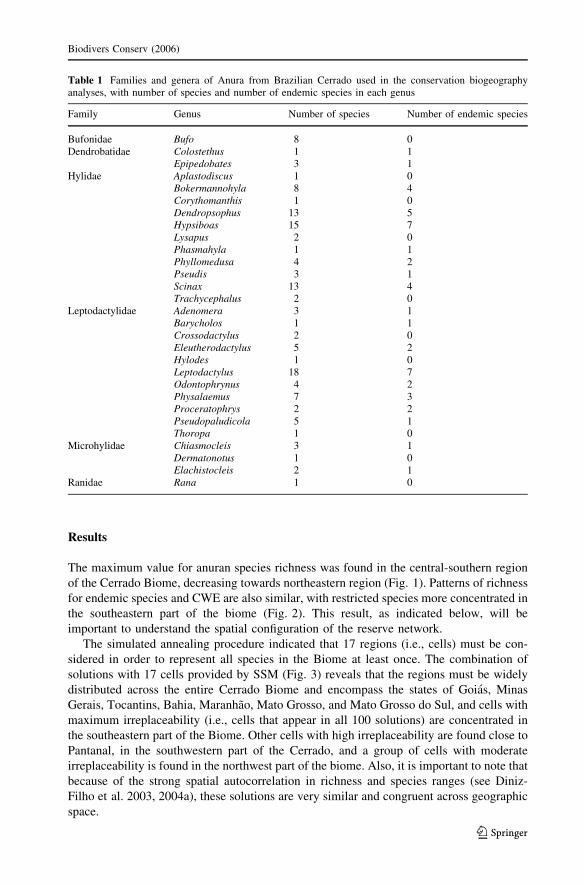
Results
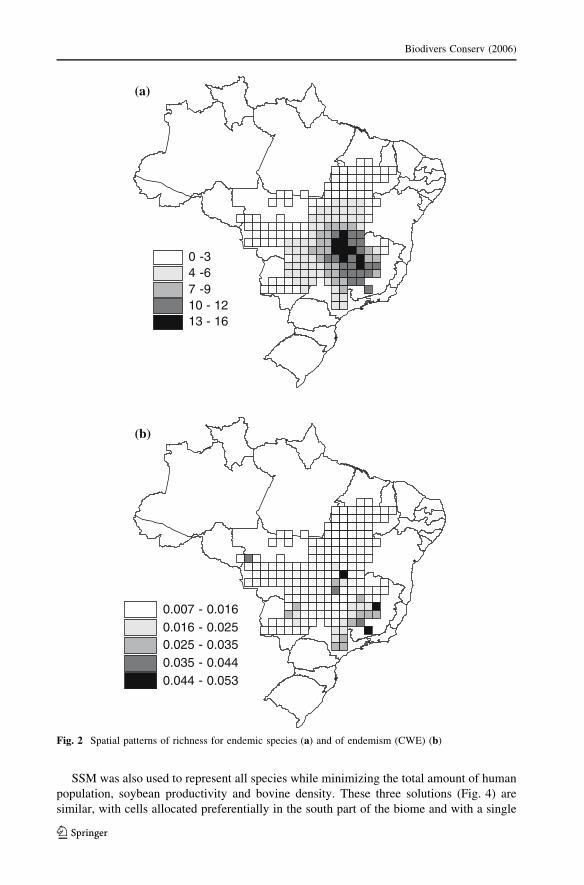
The maximum value for anuran species richness was found in the central-southern region
of the Cerrado Biome, decreasing towards northeastern region (Fig. 1). Patterns of richness
for endemic species and CWE are also similar, with restricted species more concentrated in
the southeastern part of the biome (Fig. 2). This result, as indicated below, will be
important to understand the spatial configuration of the reserve network.
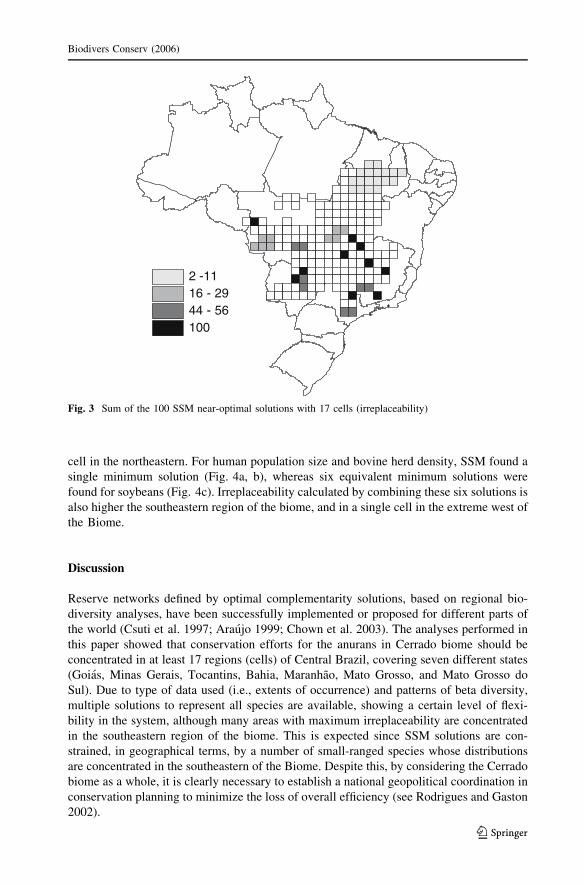
The simulated annealing procedure indicated that 17 regions (i.e., cells) must be con-
sidered in order to represent all species in the Biome at least once. The combination of
solutions with 17 cells provided by SSM (Fig. 3) reveals that the regions must be widely
distributed across the entire Cerrado Biome and encompass the states of Goias, Minas
Gerais, Tocantins, Bahia, Maranhao, Mato Grosso, and Mato Grosso do Sul, and cells with
maximum irreplaceability (i.e., cells that appear in all 100 solutions) are concentrated in
the southeastern part of the Biome. Other cells with high irreplaceability are found close to
Pantanal, in the southwestern part of the Cerrado, and a group of cells with moderate
irreplaceability is found in the northwest part of the biome. Also, it is important to note that
because of the strong spatial autocorrelation in richness and species ranges (see Diniz-
Filho et al. 2003, 2004a), these solutions are very similar and congruent across geographic
space.
Table 1 Families and genera of Anura from Brazilian Cerrado used in the conservation biogeographyanalyses, with number of species and number of endemic species in each genus
Family Genus Number of species Number of endemic species
Bufonidae Bufo 8 0Dendrobatidae Colostethus 1 1
Epipedobates 3 1Hylidae Aplastodiscus 1 0
Bokermannohyla 8 4Corythomanthis 1 0Dendropsophus 13 5Hypsiboas 15 7Lysapus 2 0Phasmahyla 1 1Phyllomedusa 4 2Pseudis 3 1Scinax 13 4Trachycephalus 2 0
Leptodactylidae Adenomera 3 1Barycholos 1 1Crossodactylus 2 0Eleutherodactylus 5 2Hylodes 1 0Leptodactylus 18 7Odontophrynus 4 2Physalaemus 7 3Proceratophrys 2 2Pseudopaludicola 5 1Thoropa 1 0
Microhylidae Chiasmocleis 3 1Dermatonotus 1 0Elachistocleis 2 1
Ranidae Rana 1 0
Biodivers Conserv (2006)
123
SSM was also used to represent all species while minimizing the total amount of human
population, soybean productivity and bovine density. These three solutions (Fig. 4) are
similar, with cells allocated preferentially in the south part of the biome and with a single
0 -34 -67 -910 - 1213 - 16
0.007 - 0.0160.016 - 0.0250.025 - 0.0350.035 - 0.0440.044 - 0.053
(a)
(b)
Fig. 2 Spatial patterns of richness for endemic species (a) and of endemism (CWE) (b)
Biodivers Conserv (2006)
123
cell in the northeastern. For human population size and bovine herd density, SSM found a
single minimum solution (Fig. 4a, b), whereas six equivalent minimum solutions were
found for soybeans (Fig. 4c). Irreplaceability calculated by combining these six solutions is
also higher the southeastern region of the biome, and in a single cell in the extreme west of
the Biome.
Discussion
Reserve networks defined by optimal complementarity solutions, based on regional bio-
diversity analyses, have been successfully implemented or proposed for different parts of
the world (Csuti et al. 1997; Araujo 1999; Chown et al. 2003). The analyses performed in
this paper showed that conservation efforts for the anurans in Cerrado biome should be
concentrated in at least 17 regions (cells) of Central Brazil, covering seven different states
(Goias, Minas Gerais, Tocantins, Bahia, Maranhao, Mato Grosso, and Mato Grosso do
Sul). Due to type of data used (i.e., extents of occurrence) and patterns of beta diversity,
multiple solutions to represent all species are available, showing a certain level of flexi-
bility in the system, although many areas with maximum irreplaceability are concentrated
in the southeastern region of the biome. This is expected since SSM solutions are con-
strained, in geographical terms, by a number of small-ranged species whose distributions
are concentrated in the southeastern of the Biome. Despite this, by considering the Cerrado
biome as a whole, it is clearly necessary to establish a national geopolitical coordination in
conservation planning to minimize the loss of overall efficiency (see Rodrigues and Gaston
2002).
2 -1116 - 2944 - 56100
Fig. 3 Sum of the 100 SSM near-optimal solutions with 17 cells (irreplaceability)
Biodivers Conserv (2006)
123

A network with 17 select cells represents about 10% of the grid system used to map
species‘ ranges (cells with 1� of latitude and longitude), and is similar, both in size and
spatial configuration, to a system previously established using a subset of the species used
here, a coarsely defined grid and based on a simple heuristic and sequential algorithm of
reserve selection (Diniz-Filho et al. 2004b). The 17 cells in the multiple solutions obtained
by the simulated annealing algorithm are widely distributed in the space, as expected if
beta-diversity increases with increasing geographic distance (see Maurer 1994), and thus
encompasses a great amount of the environmental heterogeneity at regional scales, such as
different vegetation types (Ratter and Dargie 1992; Ratter et al. 1996; Bridgewater et al.
2004). Also, and more importantly, it is possible to generate networks that contain a
smaller amount of human occupation (defined by three different surrogates of these pat-
terns), revealing a possibility to minimize conservation-human development conflicts
(sensu Balmford et al. 2001; see also Chown et al. 2003; Diniz-Filho et al. 2006).
For modern agricultural spatial patterns, based on soybean cultures, six minimum cost
12346
(a) (b)
(c)
Fig. 4 Minimum solutions of SSM in respect to human population size (a) and bovine density (b). In (c) weshow the sum of six optimum solutions minimizing costs related to soybean productivity
Biodivers Conserv (2006)
123
solutions were found, revealing even more flexibility (compared with the single solution
provided by minimizing human population and bovine density) to establish a broad-scale
conservation system targeted to represent all anuran species. However, most irreplaceable
cells are still situated in the south-eastern and central regions of the biome, as a function of
endemism of many species, including some recently discovered (Diniz-Filho et al. 2005).
The problem is that this region is the one most densely occupied by human populations and
their activities, so establishing protected areas becomes both difficult and expensive.
Since there is a strong autocorrelation pattern for grid richness (Diniz-Filho et al. 2003),
alternative reserve systems could also work if based on cells close to the ones chosen here,
as showed by the multiple solutions obtained by simulated annealing in SSM. This occurs
because short distance autocorrelation in species richness is usually a function of range
overlap, reflecting low species turnover (Diniz-Filho et al. 2003). These alternative sys-
tems would be also important when considering the previous efforts in defining reserves in
the Cerrado Biome (e.g. Emas and Chapada dos Veadeiros National Parks, in Goias State,
that are adjacent to some of the cells selected in this paper. Thus, in a context of gap
analyses at broad scale (e.g., Rodrigues et al. 2004), these previously established reserves,
after a more detailed evaluation of local parameters (see below), could be used as starting
points for defining priorities in the allocation of conservation efforts along the entire
system. Of course, a better understanding of how the current system of conservation units
preserves anuran diversity requires a more detailed study, due to differences in scale
focused for each analysis.
Despite the growth of macroecology research program worldwide (see Blackburn and
Gaston 2003), macro-scale approaches are obviously considered coarse to establish reserve
networks. Although they can provide overall guidelines for conservation and define the
focus for more local and effective conservation efforts in Neotropical regions, it is also
important to be aware of the limitations of this approach. A first general problem with
macro-scale approaches is the definition of the extent of occurrence, based on biogeo-
graphical data, which is by definition overestimated (Gaston 2003). Although each region
in our study has ca. 12,000 km2, and probably has at least one population of the species
listed (assuming continuous ranges), we cannot ensure that viable population for all species
will be found within these regions. More studies are necessary to evaluate these parameters
at local scale because, in general, regional patterns of species richness and abundance for
Cerrado species are poorly described, with inventories restricted to a few regions in the
central and south-eastern part of the biome (Cavalcanti and Joly 2002). In this case, the
hierarchical approach suggested here (i.e., defining regions using biogeographic data and
only then analysing local areas within regions by local sampling), would be in principle
more effective than select reserves based only on spatially restricted and detailed local
datasets. Also, this approach can be improved in a near future if a few additional
parameters linking species‘ persistence with patterns of regional occurrence and habitat
suitability are obtained. This can improve the system by adopting a ‘filtering’ strategy
based on extents of occurrence (Araujo and Williams 2000; Williams and Araujo 2000;
Araujo et al. 2002). Another possibility is to downscaling data to a finer resolution, based
on modeled species distributions, but this procedure still requires relatively high density of
local records of occurrence to minimize uncertainness in modeling process (Araujo et al.
2005).
Spatial variation in total species richness and especially in the level of endemism (which
possess an important role in establish the networks) may be biased since most sampling
efforts have been historically concentrated into the southern and central regions of the
Cerrado biome (Diniz-Filho et al. 2005). Suppose, for example, the discovery of new
Biodivers Conserv (2006)
123
endemic species in the northern part of the biome (e.g. in the Tocantins State), a plausible
assumption due to the paucity of faunal inventories in this region. This would increase the
relative importance (i.e., the irreplaceability) of those northern regions and, consequently,
increase the length of the entire reserve network. Increasing knowledge could also show
that geographic distribution of some currently known species could also expand towards
these northern regions, and this would counteract this effect of increasing network size due
to endemisms. On the other hand, updating data on ranges of known species would even
invert the current pattern of the reserves, since species that are today considered endemic to
southern would be also preserved in the northern.
Edge effects observed in the network would partially counteract the increase in the
number of regions necessary for reservation caused by adding more endemics species in
the northern regions, and also change network length in the future (see Diniz-Filho et al.
2005). In a broader scale approach (i.e., analysing the entire country), non-endemic species
found only at the margins of the biome would have been previously included in richer
regions outside the Cerrado, decreasing the importance of some regions selected in the
edge of the biome. Thus, the selected regions in the centre of the biome would be more
stable to changes if a national scale planning were implemented (Rodrigues and Gaston
2002). In general, these results indicate how difficult is to predict changes in the network
patterns due to the increase in the comprehensiveness in biodiversity data in the entire
biome (Diniz-Filho et al. 2005). Anyway, the irreplaceability patterns and reserve net-
works described here are the best possible conservation bioegeography design based on
current knowledge of the anuran species distribution in the Cerrado.
Despite these problems, our analyses revealed general patterns of anuran species richness
and endemism in Cerrado biome, which may be important for conservation purposes. The
regional system presented here can furnish guidelines for future conservation and research
programs, taking into account both patterns of species richness, endemism, human devel-
opment and land use to define priority regions for conservation. In this context, the next step
in this research program is to add habitat suitability dimensions to filter regional occurrence
and incorporate issues of increasing species persistence into reserve design.
In addition, at local scales, we suggest an increasing in sampling efforts within the
regions identified above with the aim of identify suitable habitats and to estimate popu-
lation and meta-population parameters. Data gathered in this way will serve to evaluate the
validity of areas to maintain viable populations and also to increase our knowledge about
patterns of richness and endemism by updating geographic distribution of known and
describing new species.
Acknowledgements Financial support for this study came from a PRONEX program of CNPq andSECTEC-GO (proc. 23234156). Work by JAFDF, LMB and RPB were also partially supported by otherCNPq projects (procs. ns. 300762/94-1, 300367/96-1; 400381-97.4). Our research program in macroecologyand biodiversity has also been continuously supported by CAPES and FUNAPE-UFG.
References
Aaron GB, Gullison RE, Rice RE, Fonseca GAB (2001) Effectiveness of parks in protecting tropicalbiodiversity. Science 291:125–128
Abbitt RJF, Scott JM, Wilcove DS (2000) The geography of vulnerability: incorporating species geographyand human development patterns into conservation planning. Biol Conserv 96:169–175
Andelman S, Ball I, Davis F, Stoms D (1999) SITES v. 1.0, An analytical toolbox for designing ecoregionalconservation portfolios. Technical report, The Nature Conservancy. http://www.biogeog.ucsb.edu/projects/tnc/toolbox.html
Biodivers Conserv (2006)
123
Araujo MB (1999) Distribution patterns of biodiversity and the design of a representative reserve network inPortugal. Div Distribut 5:151–163
Araujo MB (2003) The coincidence of people and biodiversity in Europe. Global Ecol Biogeogr 12:5–12Araujo MB, Williams PH (2000) Selecting areas for species persistence using occurrence data. Biol Conserv
96:331–345Araujo MB, Williams PH, Turner A (2002) A sequential approach to minimise threars within selected
conservation areas. Biodiv Conserv 11:1011–1024Araujo MB, Thuiller W, Williams PH, Reginster I (2005) Downscaling European species atlas distributions
to a finer resolution: implications for conservation planning. Global Ecol Biogeogr 14:17–30Balmford A, Moore JL, Brooks T, Burgess N, Hansen LA, Williams P, Rahbek C (2001) Conservation
conflicts across Africa. Science 291:2616–2619Bickford SA, Laffan SW, de Kok RPJ, Orthia LA (2004) Spatial analysis of taxonomic and genetic patterns
and their potential for understanding evolutionary histories. J Biogeogr 31:1715–1733Blackburn TM, Gaston KJ (2003) Macroecology: concepts and consequences. Blackwell Science, OxfordBridgewater S, Ratter JA, Ribeiro JF (2004) Biogeographic patterns, b-diversity and dominance in the
cerrado biome of Brazil. Biodiv Conserv 13:2295–2318Briers RA (2002) Incorporating connectivity into reserve selection procedures. Biol Conserv 103:77–83Cabeza M, Moilanen A (2001) Design of reserve network and the persistence of biodiversity. Trends Ecol
Evol 16:242–248Cavalcanti RB, Joly CA (2002) Biodiversity and conservation priorities in the cerrado region.
In: Oliveira PS, Marquis RJ (eds) The cerrados of Brazil: ecology and natural history of aneotropical savanna, pp 351–367
Chown SL, van Rensburg BJ, Gaston KJ, Rodrigues ASL, van Jaarsveld AS (2003) Energy, species rich-ness, and human population size: conservation implications at a national scale. Ecol Appl 13:1233–1241
Church RL, Stoms DM, Davis FW (1996) Reserve selection as a maximal covering location problem. BiolConserv 76:105–112
Colli GR, Bastos RP, Araujo AFB (2002) The character and dynamics of the Cerrado herpetofauna.In: Oliveira PS, Marques RJ (eds) The Cerrado of Brazil: ecology and natural history of a neotropicalsavanna. Columbia University Press, Columbia, pp 223–241
Csuti B, Polasky S, Williams PH, Pressey RL, Camm JD, Kershaw M, Kiester AR, Downs B, Hamilton R,Huso M and Sahr K (1997) A comparison of reserve selection algorithms using data on terrestrialvertebrates in Oregon. Biol Conserv 80:83–97
Diniz-Filho JAF, Bini LM, Hawkins BA (2003) Spatial autocorrelation and red herrings in geographicalecology. Global Ecol Biogeogr 12:53–64
Diniz-Filho JAF, Bini LM, Bastos RP, Vieira CM, Souza MC, Motta JAO, Pombal JP Jr, Peixoto JC (2004a)Anurans from a local assemblage in Central Brazil: linking local processes with macroecologicalpatterns. Brazilian J Biol 64:41–52
Diniz-Filho JAF, Bini LM, Vieira CM, Souza MC, Bastos RP, Brandao D, Oliveira LG (2004b) Spatialpatterns in species richness and priority areas for conservation of anurans in the Cerrado region, CentralBrazil. Amphibia-Reptilia 25:63–75
Diniz-Filho JAF, Bastos RP, Rangel TFLVB, Bini LM, Carvalho P, Silva RJ (2005) Macroecologicalcorrelates and spatial patterns of anurans description dates in Brazilian Cerrado. Global Ecol Biogeogr14:469–477
Diniz-Filho JAF, Bini LM, Pinto MP, Rangel TFLVB, Carvalho P, Bastos RP (2006) Anuran speciesrichness, complementarity and conservation conflicts in Brazilian Cerrado. Acta Oecologica 29:9–15.
Faith DP (2001a) Overlap of species richness and development-opportunity does not imply conflict. Science293:1591–1592
Faith DP (2001b) Those complementarity analyses do not reveal extent of conservation conflict in Africa.Science 293:1591–1592
Ferrier S, Pressey RL, Barrett TW (2000) A new predictor of the irreplaceability of areas for achieving aconservation goal, its application to real-world planning, and a research agenda for further refinement.Biol Conserv 93:303–325
Gaston KJ (1994) Rarity. Chapman & Hall, LondonGaston KJ (2003) The structure and dynamics of geographic ranges. Oxford University Press, OxfordGaston KJ, Rodrigues ASL (2003) Reserve selection in regions with poor biological data. Conserv Biol
17:188–195Gaston KJ, Evans KJ (2004) Birds and people in Europe. Proc R Soc London Ser B 271:1649–1655Huston MA (2001) People and biodiversity in Africa. Science 293:1591–1592Klink CA, Machado RB (2005) Conservation of the Brazilian cerrado. Conserv Biol 19:707–713
Biodivers Conserv (2006)
123

Lawler JJ, White D, Master LL (2003) Integrating representation and vulnerability: two approaches forprioritizing areas for conservation. Ecol Appl 13:1762–1772
Luck GW, Ricketts TH, Daily GC, Imhoff M (2004) Alleviating spatial conflicts between people andbiodiversity. Proc Nat Acad Sci – USA 101:182–186
Margules CR, Pressey RL (2000) Systematic conservation planning. Nature 405:243–253Maurer BA (1994) Geographical population analysis: tools for the analysis of biodiversity. Cambridge
University Press, CambridgeMeir E, Andelman S, Possingham HP (2004) Does conservation planning matter in a dynamic and uncertain
world? Ecol Lett 7:615–622Myers N, Mittermeier RA, Mittermeier CG, Fonseca GAB, Kent J (2000) Biodiversity hotspots for con-
servation priorities. Nature 403:853–858Polasky S, Camm JD, Solow AR, Csuti B, White D, Ding R (2000) Choosing reserve network with
incomplete species information. Biol Conserv 94:1–10Polasky S, Csuti B, Vossler CA, Meyers SM (2001) A comparison of taxonomic distinctness versus richness
as criteria for setting conservation priorities for North American birds. Biol Conserv 97:99–105Possingham H, Ball I, Andelman S (2000) Mathematical methods for identifying representative reserve
networks. In: Ferson S, Burgman M (eds) Quantitative methods for conservation biology. Springer-Verlag, New York, pp 291–306
Pressey RL, Possingham HP, Day JR (1997) Effectiveness of alternative heuristic algorithms for identifyingindicative minimum requirements for conservation reserves. Biol Conserv 80:207–219
Rangel TFLVB, Bini LM, Diniz-Filho JAF, Pinto MP, Carvalho P, Bastos RP (in press). Human devel-opment and biodiversity conservation in Brazilian Cerrado. Appl Geogr
Ratter JA, Dargie TCD (1992) An analysis of the floristic composition of 26 Cerrado areas in Brazil. Edin JBot 49:235–250
Ratter JA, Bridgewater S, Atkinson R, Ribeiro JF (1996) Analysis of the floristic composition of theBrazilian Cerrado vegetation II: comparison of the woody vegetation of 98 areas. Edinb J Bot 53:153–180
Rodrigues ASL, Gaston KJ (2002) Rarity and conservation planning across geopolitical units. Conserv Biol.16:674–682
Rodrigues ASL, Andelman SJ, Bakarr MI, Boitani L, Brooks TM, Cowling RM, Fishpool LDC, FonsecaGAB, Gaston KJ, Hoffmann M, Long JS, Marquet PA, Pilgrim JD, Abbitt RJB, Pressey RL, Schipper J,Sechrest W, Stuart SN, Underhill LG, Waller RW, Watts MEJ, Yan X (2004) Effectiveness of globalprotected area network in representing species diversity. Nature 428:640–643
Sala OE, Chapin FS, Armesto JJ, Berlow E, Bloomfield J, Dirzo R, Huber-Sanwald E, Huenneke LF,Jackson RB, Kinzig A, Leemans R, Lodge DM, Mooney HA, Oesterheld M, Poff NL, Sykes MT,Walker BH, Walker M, Wall DH (2000) Global biodiversity scenarios for the year 2100. Science287:1770–1774
Silvano DL, Sagallo MV (2005) Conservation of Brazilian amphibians. Conserv Biol 19:653–658Stuart SN, Chanson JS, Cox NA, Young BE, Rodrigues ASL, Fischman DL, Waller RW (2004) Status and
trends of amphibian declines and extinctions wordwide. Science 306:1783–1786Young BE, Lips KR, Reaser JK, Ibanez R, Salas AW, Cedeno JR, Coloma LA, Ron S, La Marca E, Meyer
JR, Munoz A, Bolanos F, Chaves G, Romo D (2000) Population declines and priorities for Amphibianconservation in Latin America. Conserv Biol 15:1213–1223
Whittaker RJ, Araujo MB, Paul J, Ladle RJ, Watson JEM, Willis KJ (2005) Conservation Biogeography:assessment and prospect. Div Distribut 11:3–23
Williams PH, Araujo MB (2000) Using probability of persistence to identify important areas for biodi-versity. Proc R Soc London B 267:1959–66
Williams JC, ReVelle CS, Levin SA (2004) Using mathematical optimization models to design naturereserves. Front Ecol Environ 2(2):98–105
Biodivers Conserv (2006)
123