coni t e g r atoi n tr e n d s a m o n g t h e nafta e ma
TRANSCRIPT
rEviSta dE Economía mundial 26, 2010, 155-176
cointEGration trEndS amonG thE nafta Equity markEtS .
tendenciaS co-integradoraS entre loS MercadoS de capital de loS paíSeS MieMbroS de nafta.
Francisco López-HerreraUniversidad Nacional Autónoma de México (UNAM)
Edgar OrtizUniversidad Nacional Autónoma de México (UNAM)
Recibido: febrero de 2009; aceptado: marzo de 2010.
aBStract .
Recent economic and financial liberalization policies have increased the internationalization of emerging markets. A daring strategy undertaken by Mexico constituted the North America Free Trade Agreement (NAFTA); in addition to increased trade and investments, it should have led to stronger links among the equity markets from Canada, United States and Mexico. This study tests a “first generation” financial integration among those markets, applying Johansen’s cointegration technique. It also examines integration between the NAFTA markets and the world capital market. Results evidence a time-varying integration process among NAFTA equity markets. Integration of the NAFTA capital markets to the world capital market evidences a mild segmentation and a time-varying integration as well.
Keywords: Cointegration; Integration/segmentation; NAFTA; Mexico.
ISSN: 1576-0162
rESumEn .
Las recientes políticas de liberalización económica y financiera han incrementado la internacionalización de los mercados emergentes. Una atrevida estrategia implementada por México constituye el Tratado de Libre Comercio de los Países de Norte América (TLCAN, NAFTA por sus siglas en inglés). Además de incrementos en el comercio y en las inversiones, este tratado debería haber fortalecido los vínculos entre le mercados accionarios de Canadá, Estados Unidos y México. El presente estudio analiza la “primera generation” de integración entre dichos mercados aplicando la técnica de cointegración de Johansen. También examina la integración entre los mercados del NAFTA y el mercado de capitales mundial. La evidencia empírica sugiere un proceso de integración cambiante en el tiempo entre los mercados accionarios de los socios del NAFTA. La integración de los mercados de capital del NAFTA con el mercado de capitales mundial evidencia una segmentación moderada y también cambiante en el tiempo.
Palabras clave: Cointegración; Integración/segmentación; TLCAN; México.
JEL classification: G12, G15.
rEviSta dE Economía mundial 26, 2010, 155-176
1 . introduction1 .
The end of World War II promoted greater economic activity. In practice, all countries experienced economic growth. However, growth was hindered by extensive barriers to international trade and real and portfolio investments. Additionally, governments over-regulated their financial systems. Financial repression prevailed, creating strong barriers to international capital flows which led into segmented capital markets (Errunza and Miller, 2000). Errunza (1979) identified this impeding impact on international portfolio investments as portfolio suppression. Nevertheless, restrictions on financial flows, enforced by the most developed countries, particularly United States, led to the creation and exponential growth of the eurodollar market. Economic recovery lasted a bit over two decades. However, the creation of the euromarket, the breakdown of the international monetary system based on the Bretton Woods agreement, the oil crisis of the 1970’s and the debt crisis of the developing countries from the 1980’s led to a downfall in growth rates around the world, breaking in addition the international economic and financial long run patterns of institutional developments. This marked the birth of economic and financial globalization. In response to the new economic and financial challenges, since the early 1970´s, governments from the developed world, specifically United States and Great Britain began implementing strong market oriented policies, liberalizing markets, and easing up restricting regulations. In brief, concerning the financial sector, local markets opened up to foreign investments and free capital movements abroad were permitted. These practices were soon followed by both other developed countries as well as by the developing nations. To overcome, their stagnant growth, and in many cases their recurring crises, during the “lost decade” of the 1980’s, and specially seeking to internationalize their economies at a competitive level, developing countries undertook deep economic and financial reforms, opening their economies to international trade
1 The authors would like to thank Alejandra Cabello, Universidad Nacional Autónoma de México, Vincent Dropsy, California State University, Fullerton, Raul Moncarz and Ali M. Parhizgari, Florida In-ternational University, and two anonymous referees for their helpful comments. The usual disclaimer applies.
158 franciSco lóPEz-hErrEra, EdGar ortiz
and portfolio flows.2 In addition, due to their need to capture international savings in order to strengthen their limited savings rates, and hence promoting private investments, governments from these nations stressed the development of their capital markets, known ever since as emerging capital markets.3
Thus, many barriers to international portfolio investments have been removed in many countries, seemingly leading to higher levels of integration among the world’s financial markets. It is worth noting that both new advances in computer and in information and communications technologies have facilitated an increased the volume of international capital transactions; similarly, financial securitization innovations have created a wide range of opportunities for hedging, investing and arbitrage at the international level to the extent that by the mid 1980’s foreign portfolio flows outperformed foreign direct investment flows around the world (Márquez Pozos, Islas Camargo and Venegas Martínez, 2003), changing the composition of external flows arriving to emerging markets (Cabello, 1999; Ortiz, 2008).
Mexico started reforming its economy during the mid 1980’s and strong financial liberalization policies began to be implemented by the end of that decade. A significant step of this process was the North American Free Trade Agreement (NAFTA) signed by Mexico, Canada and United States, which opened the three countries’ capital markets to corporations and investors from these nations. Hence, it should be expected stronger links among their stock markets, particularly since the implementation of the trinational agreement, January of 1994. Furthermore, liberalization of the Mexican, Canadian and U.S. economies and financial systems suggests that their capital markets must have also become integrated, at least in some degree, with the world capital market. In this paper empirical evidence about both of these hypotheses is provided through cointegration analysis.
2 In Latin America strong financial reforms were implemented mainly by the end of the 1980’s. How-ever, financial reforms in Argentina and Chile were undertaken since the 1970’s. Mexico´s financial reforms took place mostly during the presidential term of Carlos Salinas de Gortari, 1988-1994. Moreover, the 1994-1995 crisis, triggered by the peso macrodevaluation of December 1994 forced the following Presidents, Ernesto Zedillo, 1994-200, and Vicente Fox, 2000-2006, to implement further financial opening policies and measures to restructure and strengthen financial institutions and markets. For instance, 85% of bank capital is now held by foreign institutions. Mexico’s more important banks are Banamex (Citibank, U.SA.), BBVA (Banco Bilbao Vizcaya Argentaria and Banco Santander (both Spanish) and HSBC (Hongkong Shangai Banking Corporation (United Kingdom); simi-larly foreign portfolio holdings at the Mexican Stock Exchange account for near 65 percent of total capitalization. 3 The term emerging market was coined in 1981 by Antoine W. van Agtmael of the International Finance Corporation of the World Bank. An emerging, or developing, market economy (EME) is defined as an economy with low-to-middle per capita income. In turn, Emerging Stock Markets or Emerging Capital Markets refers to stock exchanges from developing and transition economies. Sev-eral of these markets were created during the XIX Century, but have only recently experienced a healthy high growth. Other markets are of recent creation, particularly in East and South Eat Asia; emerging markets also include markets from ex-state led socialist countries now ending a transition to full market economies Hence, developing capital markets show heterogeneous characteristics con-cerning size, liquidity, and sophistication.
159
rEviSta dE Economía mundial 26, 2010, 155-176
cointEGration trEndS amonG thE nafta Equity markEtS
The paper is organized in four sections. Following this Introduction, Section 2 presents a review of the literature. Section 3 presents the data and the empirical results based on Johansen (1988, 1991, 1992) and Johansen and Juselius (1990) cointegration analysis. Section 4 presents the conclusions and a brief agenda for future research.
2 . litEraturE rEviEw .
Research on financial markets integration has become a very important issue during the last two decades. Most studies deal with asset pricing, portfolio investment diversification and cost of capital. Cho, Eun and Senbet (1986) sustain that different assets from different, but integrated, markets must be priced in a unified way. That is, expressed in the same currency, these assets must pay equal returns for similar systematic risk levels. On the contrary, in segmented markets, different assets from different markets for the same level of risk offer different returns when expressed in a common currency; hence, arbitrage opportunities, leading to excess returns can be identified, if barriers to international investing do not exist. Consequently, segmentation encourages investors to pick mispriced assets in order to obtain gains by means of an over-compensation relative to the levels of risk borne. A segmented market can also impose higher costs of capital for local firms. In their mild segmentation model, Errunza and Losq (1985) sustain that capital markets around the world lie on a continuum whose extreme points are perfect integration and perfect segmentation; partially segmented capital markets lie between these extreme points. Errunza and Losq (1985) find some evidence of mild segmentation among markets through an international version of CAPM; Cho, Eun and Senbet (1986) find similar results with an international APT specification. Bachman, Choi, Jeon and Kopecky (1996) use multilateral and bilateral cointegration techniques to examine the stock market behavior of the G-7 major industrial countries over the 1970-1989 period. When all the countries are included, the tests indicate the presence of at least one common trend among the stock price levels. However, disaggregating the data to smaller sets of countries, including all the bilateral relations as the smallest possible subset, the finding of a common trend becomes tenuous.
Recent research also reports mild segmentation. Applying cointegration analysis Chan and Lai (1993), Pérez de Gracia and Cuñado Eizaguirre, (2000), and Da Costa and Ceretta (2001) obtain similar results for different capital market groups. Similarly, testing cointegration among the stock markets from U.S. Canada, UK, India, Malaysia and Singapore for the period 1994-2005, Tambi (2006) reports that developments at the international level significantly influence national stock markets; however, they are driven mainly by the developments at the domestic level; his study also indicates that world equity markets are segmented; where developed nations and emerging markets make separate groupings. Further, for the original Association of Southeast Asian
160 franciSco lóPEz-hErrEra, EdGar ortiz
Nations countries (ASEAN-5), Click and Plummer (2005) report that their stock markets are cointegrated; however, there is only one cointegrating vector, leaving four common trends among the five variables; thus these markets are not completely segmented by national borders. Finally, Shackman (2006) presents evidence that emerging markets have higher excess returns than developed markets, but when adjusted for risk developed markets have higher returns. Further, there is a positive relationship between degree of integration and excess returns. Nevertheless, recent evidence also confirms the existence of long-run relations and interdependence between emerging and developed capital markets. Voronkova (2004) and Neubauer (2006) obtain evidence of strong links between the Central European markets; Voronkova also shows that those markets have become more integrated with global markets. Similarly, Chelley-Steeley (2004) and Phylaktis, and Ravazzolo (2005) report trends of rapid integration for the Asean and Pacif Basin stock markets. Phylaktis, and Ravazzolo also report increased integration of those markets with U.S. and Japan. Masih and Masih (2001) support the contention offered by several studies of significant interdependencies between the established OECD markets and the Asian markets, and also evidence the leadership of the US and UK markets over the short and long run. Using levels VAR (in liu of ordinary difference VAR) they also illustrate that the Japanese market influences as an additional long run leader.
In the Latin American case, Chen, Firth, and Rui (2002) examine the dynamic interdependence of the stock exchanges from Argentina, Brazil, Chile, Colombia, Mexico and Venezuela for the period 1995-2000; employing cointegration analysis their evidence reveals the presence of one cointegrating vector which appears to explain dependencies in prices. The results are robust in dollar terms and to partitioning the sample into periods before and after the Asian and Russian financial crises of 1997 and 1998, respectively. Hence their results also suggest a significant interdependence amongst those markets so that the potential for diversifying risk by investing in different Latin American markets is limited, albeit full integration is absent. Contrary to this evidence using ADR’s and a two factor conditional asset pricing model for the stock markets from Argentina, Chile, and Mexico, Hunter (2006) concludes that in the post liberalization period from the 1990’s these markets have not become integrated. Moreover, no secular trend towards greater integration is present. The Brazilian and Mexican currency crises temporarily increased the level of segmentation of Argentina and Chile, and appear to have had a more persistent effect on Mexico, for this market has become increasingly segmented in the post-crisis period; it appears that both direct and indirect barriers are responsible for the segmentation.
Empirical evidence has also suggested that integration is a time-varying process. Bekaert and Harvey (1995) report evidence that emerging markets integration to the world capital market changes over time. Serletis and King (1997), Aggarwal, Lucey and Muckley (2006) find similar results for the
161
rEviSta dE Economía mundial 26, 2010, 155-176
cointEGration trEndS amonG thE nafta Equity markEtS
case of European Union capital markets; they observe a changing degree in the level of integration among those markets. Bekaert and Harvey (1995), Carrieri, Errunza and Hogan (2001), and Barari (2004) find evidence that integration of the Mexican Stock Market to the world capital market changes over time. Finally, concerning the NAFTA countries, Atteberry and Swanson (1997), Aggarwal and Kyaw (2005) and Darrat and Zhong (2005), suggest changing degrees of integration among their capital markets. Galindo and Guerrero (1999) also show some variation in the level of cointegration among the Mexican and U.S. capital markets; nonetheless, Ewing, Payne and Sowell (1999) do not find evidence of co-integration even after controlling for NAFTA effects.
3 . data and EmPirical rESultS .
Data on the Mexican, Canadian and US stock markets were gathered from IMF’s International Financial Statistics. Proxy for the world capital market is the Morgan Stanley Capital International (MSCI) Index.4 Monthly series for the 1984.1 to 2002.12 period is used; January 1984 is the base period. Historically, it is important to note, that this sample period typifies a “first generation” on the growth and integration of the Mexican capital market with the North American stock markets; nationalization of commercial banking September 1982 induced “by substitution” a remarkable growth of the shares market from 1984 on along with recuperation of economic growth following the beginning of the debt crisis in 1982; liberalization policies enforced by the end of the decade enhanced this trend which finally consolidated with implementation of the NAFTA. However, by 2003 the Mexican Stock Market implemented an important institutional change: listing and trading of stock indices and shares from other countries, initially from the United States at its denominated Global Market plataform. which has induced new patterns of growth and internationalization of the Mexican stock market.5 All market indexes are expressed in dollars. For the cointegration analysis all the market data is transformed to their log return form. The variables analyzed are:
4 The MSCI index is built on more than 1,500 stock prices from 23 stock markets around the world. 5 By 1984 capitalization of the Mexican stock market only amounted to $2,197 billion dollars: by 2002 stock market capitalization had increased to $113,087.79 billion dollars With authorization from Comisión National Bancaria y de Valores (Mexico’s SEC) the Mexican stock exchange imple-mented in 2003 an International Quotations System (Sistema Internacional de Cotizaciones) taking into account worldwide financial deregulation, financial innovations, and financial integration trends arising during the first decade from the XXI Century. The goal of the Global Plataform was to introduce and create financial instruments and vehicles that allow gradually to “complete” Mexican capital markets creating new investment alternatives, increasing the number of participants and generat-ing new intermediation alterlatives. (Bolsa Mexicana de Valores, 2008). Although this change has induced further growth of the Mexican stock market and clearly signal new patterns of integration of this market with the North American and world capital markets, it is worth noting that the number of local corporations listed at the shares market has tended to decrease (Ortiz, 2007).
162 franciSco lóPEz-hErrEra, EdGar ortiz
MXSMIL = Mexican Stock Market Level SeriesCNSMIL = Canadian Stock Market Level SeriesUSSMIL = U.S. Stock Market Level SeriesWCMPL = World Stock Market Level SeriesΔMXSMIL = Mexican Stock Market First Difference SeriesΔCNSMIL = Canadian Stock Market First Difference SeriesΔUSSMIL = U.S. Stock Market First Difference SeriesΔWCMPL = World Stock Market First Difference Series
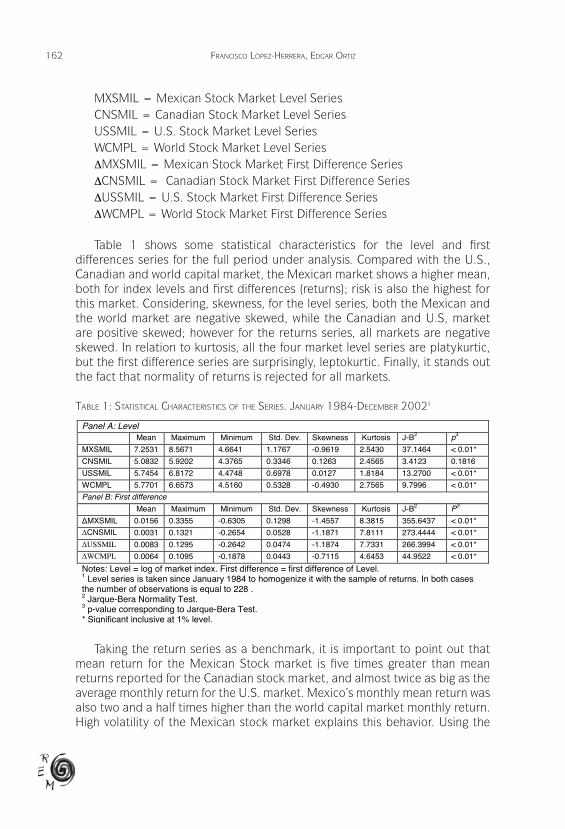
Table 1 shows some statistical characteristics for the level and first differences series for the full period under analysis. Compared with the U.S., Canadian and world capital market, the Mexican market shows a higher mean, both for index levels and first differences (returns); risk is also the highest for this market. Considering, skewness, for the level series, both the Mexican and the world market are negative skewed, while the Canadian and U.S, market are positive skewed; however for the returns series, all markets are negative skewed. In relation to kurtosis, all the four market level series are platykurtic, but the first difference series are surprisingly, leptokurtic. Finally, it stands out the fact that normality of returns is rejected for all markets.
taBlE 1: StatiStical charactEriSticS of thE SEriES . January 1984-dEcEmBEr 20021
TABLE 1: STATISTICAL CHARACTERISTICS OF THE SERIES. JANUARY 1984-DECEMBER 20021
Panel A: Level Mean Maximum Minimum Std. Dev. Skewness Kurtosis J-B2 p3
MXSMIL 7.2531 8.5671 4.6641 1.1767 -0.9619 2.5430 37.1464 < 0.01* CNSMIL 5.0832 5.9202 4.3765 0.3346 0.1263 2.4565 3.4123 0.1816
USSMIL 5.7454 6.8172 4.4748 0.6978 0.0127 1.8184 13.2700 < 0.01* WCMPL 5.7701 6.6573 4.5160 0.5328 -0.4930 2.7565 9.7996 < 0.01* Panel B: First difference Mean Maximum Minimum Std. Dev. Skewness Kurtosis J-B2 P3
MXSMIL 0.0156 0.3355 -0.6305 0.1298 -1.4557 8.3815 355.6437 < 0.01* CNSMIL 0.0031 0.1321 -0.2654 0.0528 -1.1871 7.8111 273.4444 < 0.01* USSMIL 0.0083 0.1295 -0.2642 0.0474 -1.1874 7.7331 266.3994 < 0.01* WCMPL 0.0064 0.1095 -0.1878 0.0443 -0.7115 4.6453 44.9522 < 0.01*
Notes: Level = log of market index. First difference = first difference of Level. 1 Level series is taken since January 1984 to homogenize it with the sample of returns. In both cases the number of observations is equal to 228 . 2 Jarque-Bera Normality Test. 3 p-value corresponding to Jarque-Bera Test. * Significant inclusive at 1% level.
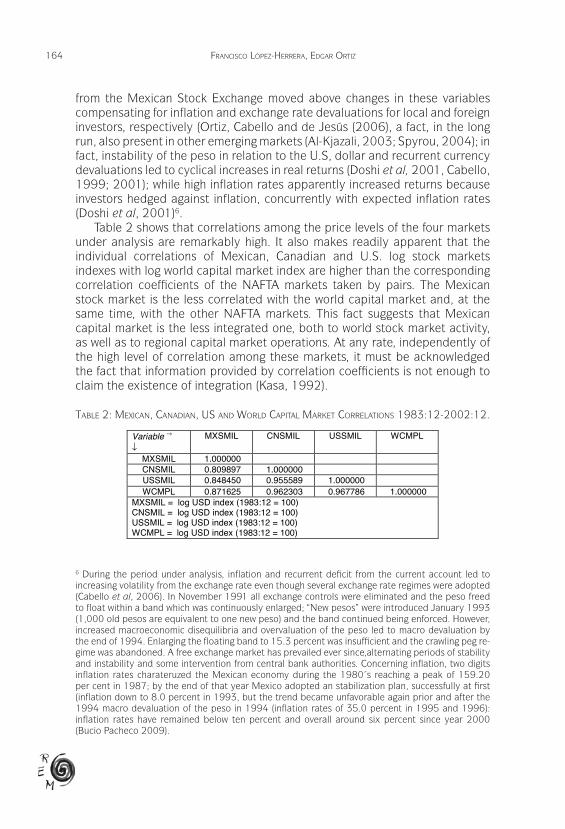
TABLE 2: MEXICAN, CANADIAN, US AND WORLD CAPITAL MARKET CORRELATIONS 1983:12-2002:12.
Variable →
↓ MXSMIL CNSMIL USSMIL WCMPL
MXSMIL 1.000000 CNSMIL 0.809897 1.000000 USSMIL 0.848450 0.955589 1.000000 WCMPL 0.871625 0.962303 0.967786 1.000000
MXSMIL = log USD index (1983:12 = 100) CNSMIL = log USD index (1983:12 = 100) USSMIL = log USD index (1983:12 = 100) WCMPL = log USD index (1983:12 = 100)
Taking the return series as a benchmark, it is important to point out that mean return for the Mexican Stock market is five times greater than mean returns reported for the Canadian stock market, and almost twice as big as the average monthly return for the U.S. market. Mexico’s monthly mean return was also two and a half times higher than the world capital market monthly return. High volatility of the Mexican stock market explains this behavior. Using the
163
rEviSta dE Economía mundial 26, 2010, 155-176
cointEGration trEndS amonG thE nafta Equity markEtS
mean/standard deviation ratio as an over all measure of reward to risks taken, the U.S. market provided higher returns per unit of risk taken (.175), while the Canadian market offered the lowest reward per unit of risk taken (.073); the risk premium from the Mexican market (.12) was lower than that offered by both the U.S. market and the world market (.14).
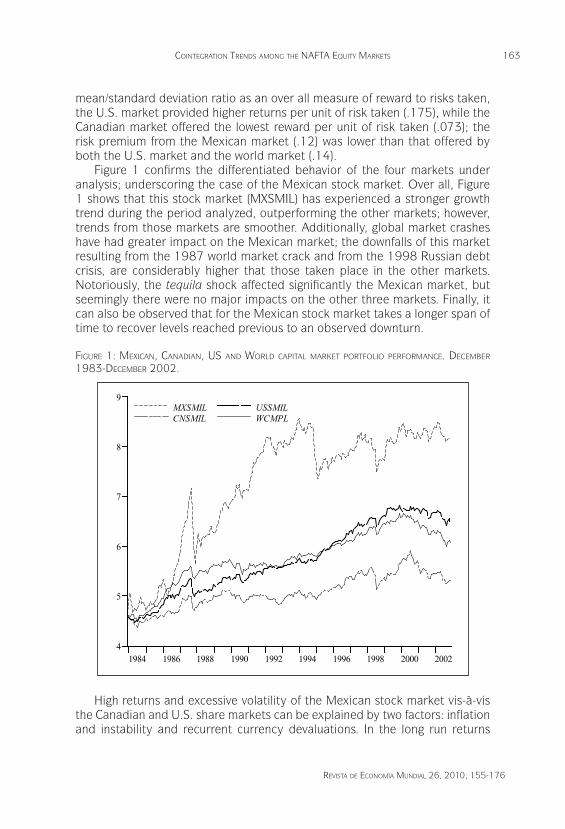
Figure 1 confirms the differentiated behavior of the four markets under analysis; underscoring the case of the Mexican stock market. Over all, Figure 1 shows that this stock market (MXSMIL) has experienced a stronger growth trend during the period analyzed, outperforming the other markets; however, trends from those markets are smoother. Additionally, global market crashes have had greater impact on the Mexican market; the downfalls of this market resulting from the 1987 world market crack and from the 1998 Russian debt crisis, are considerably higher that those taken place in the other markets. Notoriously, the tequila shock affected significantly the Mexican market, but seemingly there were no major impacts on the other three markets. Finally, it can also be observed that for the Mexican stock market takes a longer span of time to recover levels reached previous to an observed downturn.
fiGurE 1: mExican, canadian, uS and world caPital markEt Portfolio PErformancE . dEcEmBEr 1983-dEcEmBEr 2002 .
4
5
6
7
8
9
1984 1986 1988 1990 1992 1994 1996 1998 2000 2002
MXSMILCNSMIL
USSMILWCMPL
High returns and excessive volatility of the Mexican stock market vis-à-vis the Canadian and U.S. share markets can be explained by two factors: inflation and instability and recurrent currency devaluations. In the long run returns
164 franciSco lóPEz-hErrEra, EdGar ortiz
from the Mexican Stock Exchange moved above changes in these variables compensating for inflation and exchange rate devaluations for local and foreign investors, respectively (Ortiz, Cabello and de Jesús (2006), a fact, in the long run, also present in other emerging markets (Al-Kjazali, 2003; Spyrou, 2004); in fact, instability of the peso in relation to the U.S, dollar and recurrent currency devaluations led to cyclical increases in real returns (Doshi et al, 2001, Cabello, 1999; 2001); while high inflation rates apparently increased returns because investors hedged against inflation, concurrently with expected inflation rates (Doshi et al, 2001)6.
Table 2 shows that correlations among the price levels of the four markets under analysis are remarkably high. It also makes readily apparent that the individual correlations of Mexican, Canadian and U.S. log stock markets indexes with log world capital market index are higher than the corresponding correlation coefficients of the NAFTA markets taken by pairs. The Mexican stock market is the less correlated with the world capital market and, at the same time, with the other NAFTA markets. This fact suggests that Mexican capital market is the less integrated one, both to world stock market activity, as well as to regional capital market operations. At any rate, independently of the high level of correlation among these markets, it must be acknowledged the fact that information provided by correlation coefficients is not enough to claim the existence of integration (Kasa, 1992).
taBlE 2: mExican, canadian, uS and world caPital markEt corrElationS 1983:12-2002:12 .
TABLE 1: STATISTICAL CHARACTERISTICS OF THE SERIES. JANUARY 1984-DECEMBER 20021
Panel A: Level Mean Maximum Minimum Std. Dev. Skewness Kurtosis J-B2 p3
MXSMIL 7.2531 8.5671 4.6641 1.1767 -0.9619 2.5430 37.1464 < 0.01* CNSMIL 5.0832 5.9202 4.3765 0.3346 0.1263 2.4565 3.4123 0.1816
USSMIL 5.7454 6.8172 4.4748 0.6978 0.0127 1.8184 13.2700 < 0.01* WCMPL 5.7701 6.6573 4.5160 0.5328 -0.4930 2.7565 9.7996 < 0.01* Panel B: First difference Mean Maximum Minimum Std. Dev. Skewness Kurtosis J-B2 P3
MXSMIL 0.0156 0.3355 -0.6305 0.1298 -1.4557 8.3815 355.6437 < 0.01* CNSMIL 0.0031 0.1321 -0.2654 0.0528 -1.1871 7.8111 273.4444 < 0.01* USSMIL 0.0083 0.1295 -0.2642 0.0474 -1.1874 7.7331 266.3994 < 0.01* WCMPL 0.0064 0.1095 -0.1878 0.0443 -0.7115 4.6453 44.9522 < 0.01*
Notes: Level = log of market index. First difference = first difference of Level. 1 Level series is taken since January 1984 to homogenize it with the sample of returns. In both cases the number of observations is equal to 228 . 2 Jarque-Bera Normality Test. 3 p-value corresponding to Jarque-Bera Test. * Significant inclusive at 1% level.
TABLE 2: MEXICAN, CANADIAN, US AND WORLD CAPITAL MARKET CORRELATIONS 1983:12-2002:12.
Variable →
↓ MXSMIL CNSMIL USSMIL WCMPL
MXSMIL 1.000000 CNSMIL 0.809897 1.000000 USSMIL 0.848450 0.955589 1.000000 WCMPL 0.871625 0.962303 0.967786 1.000000
MXSMIL = log USD index (1983:12 = 100) CNSMIL = log USD index (1983:12 = 100) USSMIL = log USD index (1983:12 = 100) WCMPL = log USD index (1983:12 = 100)
6 During the period under analysis, inflation and recurrent deficit from the current account led to increasing volatility from the exchange rate even though several exchange rate regimes were adopted (Cabello et al, 2006). In November 1991 all exchange controls were eliminated and the peso freed to float within a band which was continuously enlarged; “New pesos” were introduced January 1993 (1,000 old pesos are equivalent to one new peso) and the band continued being enforced. However, increased macroeconomic disequilibria and overvaluation of the peso led to macro devaluation by the end of 1994. Enlarging the floating band to 15.3 percent was insufficient and the crawling peg re-gime was abandoned. A free exchange market has prevailed ever since,alternating periods of stability and instability and some intervention from central bank authorities. Concerning inflation, two digits inflation rates charateruzed the Mexican economy during the 1980´s reaching a peak of 159.20 per cent in 1987; by the end of that year Mexico adopted an stabilization plan, successfully at first (inflation down to 8.0 percent in 1993, but the trend became unfavorable again prior and after the 1994 macro devaluation of the peso in 1994 (inflation rates of 35.0 percent in 1995 and 1996): inflation rates have remained below ten percent and overall around six percent since year 2000 (Bucio Pacheco 2009).
165
rEviSta dE Economía mundial 26, 2010, 155-176
cointEGration trEndS amonG thE nafta Equity markEtS
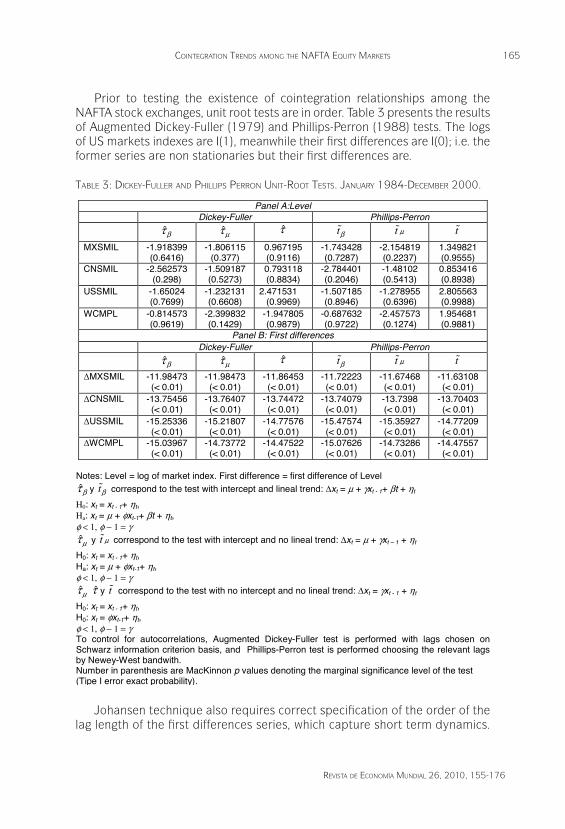
Prior to testing the existence of cointegration relationships among the NAFTA stock exchanges, unit root tests are in order. Table 3 presents the results of Augmented Dickey-Fuller (1979) and Phillips-Perron (1988) tests. The logs of US markets indexes are I(1), meanwhile their first differences are I(0); i.e. the former series are non stationaries but their first differences are.
taBlE 3: dickEy-fullEr and PhilliPS PErron unit-root tEStS . January 1984-dEcEmBEr 2000 .
TABLE 3: DICKEY-FULLER AND PHILLIPS PERRON UNIT-ROOT TESTS. JANUARY 1984-DECEMBER 2000.
Panel A:LevelDickey-Fuller Phillips-Perron
ˆβτ ˆµτ τ̂ tβɶ t µɶ tɶ
MXSMIL -1.918399 (0.6416)
-1.806115 (0.377)
0.967195 (0.9116)
-1.743428 (0.7287)
-2.154819 (0.2237)
1.349821 (0.9555)
CNSMIL -2.562573 (0.298)
-1.509187 (0.5273)
0.793118 (0.8834)
-2.784401 (0.2046)
-1.48102 (0.5413)
0.853416 (0.8938)
USSMIL -1.65024 (0.7699)
-1.232131 (0.6608)
2.471531 (0.9969)
-1.507185 (0.8946)
-1.278955 (0.6396)
2.805563 (0.9988)
WCMPL -0.814573 (0.9619)
-2.399832 (0.1429)
-1.947805 (0.9879)
-0.687632 (0.9722)
-2.457573 (0.1274)
1.954681 (0.9881)
Panel B: First differences Dickey-Fuller Phillips-Perron
ˆβτ ˆµτ τ̂ tβɶ t µɶ tɶMXSMIL -11.98473
(< 0.01) -11.98473 (< 0.01)
-11.86453 (< 0.01)
-11.72223 (< 0.01)
-11.67468 (< 0.01)
-11.63108 (< 0.01)
CNSMIL -13.75456 (< 0.01)
-13.76407 (< 0.01)
-13.74472 (< 0.01)
-13.74079 (< 0.01)
-13.7398 (< 0.01)
-13.70403 (< 0.01)
USSMIL -15.25336 (< 0.01)
-15.21807 (< 0.01)
-14.77576 (< 0.01)
-15.47574 (< 0.01)
-15.35927 (< 0.01)
-14.77209 (< 0.01)
WCMPL -15.03967 (< 0.01)
-14.73772 (< 0.01)
-14.47522 (< 0.01)
-15.07626 (< 0.01)
-14.73286 (< 0.01)
-14.47557 (< 0.01)
Notes: Level = log of market index. First difference = first difference of Level ˆβτ y tβɶ correspond to the test with intercept and lineal trend: ∆xt = µ + γxt - 1+ βt + ηt
H0: xt = xt - 1+ ηt, Ha: xt = µ + φxt-1+ βt + ηt, φ < 1, φ − 1 = γ ˆµτ y t µɶ correspond to the test with intercept and no lineal trend: ∆xt = µ + γxt – 1 + ηt
H0: xt = xt - 1+ ηt, Ha: xt = µ + φxt-1+ ηt, φ < 1, φ − 1 = γ ˆµτ τ̂ y tɶ correspond to the test with no intercept and no lineal trend: ∆xt = γxt - 1 + ηt
H0: xt = xt - 1+ ηt, H0: xt = φxt-1+ ηt, φ < 1, φ − 1 = γ To control for autocorrelations, Augmented Dickey-Fuller test is performed with lags chosen on Schwarz information criterion basis, and Phillips-Perron test is performed choosing the relevant lags by Newey-West bandwith. Number in parenthesis are MacKinnon p values denoting the marginal significance level of the test (Tipe I error exact probability).
Johansen technique also requires correct specification of the order of the lag length of the first differences series, which capture short term dynamics.
166 franciSco lóPEz-hErrEra, EdGar ortiz
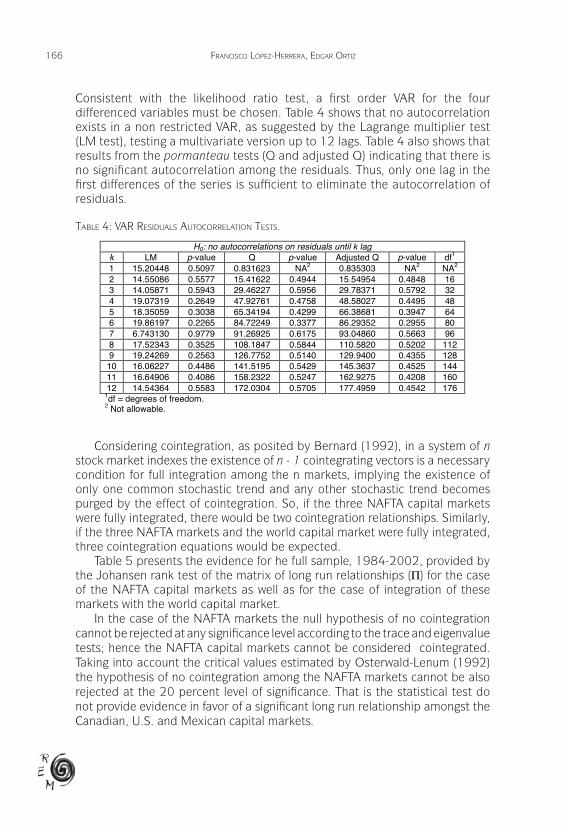
Consistent with the likelihood ratio test, a first order VAR for the four differenced variables must be chosen. Table 4 shows that no autocorrelation exists in a non restricted VAR, as suggested by the Lagrange multiplier test (LM test), testing a multivariate version up to 12 lags. Table 4 also shows that results from the pormanteau tests (Q and adjusted Q) indicating that there is no significant autocorrelation among the residuals. Thus, only one lag in the first differences of the series is sufficient to eliminate the autocorrelation of residuals.
taBlE 4: var rESidualS autocorrElation tEStS .TABLE 4: VAR RESIDUALS AUTOCORRELATION TESTS.
H0: no autocorrelations on residuals until k lag k LM p-value Q p-value Adjusted Q p-value df1
1 15.20448 0.5097 0.831623 NA2 0.835303 NA2 NA2
2 14.55086 0.5577 15.41622 0.4944 15.54954 0.4848 16 3 14.05871 0.5943 29.46227 0.5956 29.78371 0.5792 32 4 19.07319 0.2649 47.92761 0.4758 48.58027 0.4495 48 5 18.35059 0.3038 65.34194 0.4299 66.38681 0.3947 64 6 19.86197 0.2265 84.72249 0.3377 86.29352 0.2955 80 7 6.743130 0.9779 91.26925 0.6175 93.04860 0.5663 96 8 17.52343 0.3525 108.1847 0.5844 110.5820 0.5202 112 9 19.24269 0.2563 126.7752 0.5140 129.9400 0.4355 128 10 16.06227 0.4486 141.5195 0.5429 145.3637 0.4525 144 11 16.64906 0.4086 158.2322 0.5247 162.9275 0.4208 160 12 14.54364 0.5583 172.0304 0.5705 177.4959 0.4542 176
1df = degrees of freedom. 2 Not allowable.
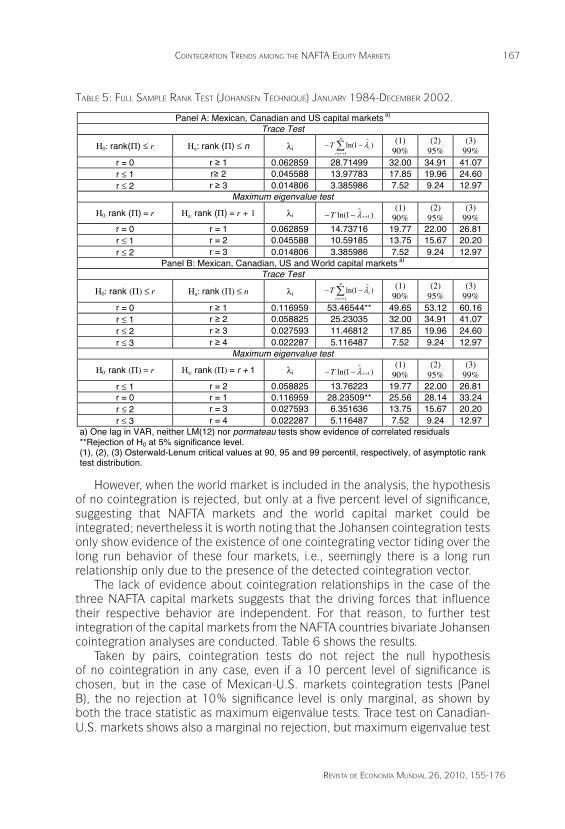
TABLE 5: FULL SAMPLE RANK TEST (JOHANSEN TECHNIQUE) JANUARY 1984-DECEMBER 2002.
Panel A: Mexican, Canadian and US capital markets a)
Trace Test
H0: rank(Π) ≤ r Ha: rank (Π) ≤ n λi )1ln(1
∑+=
∧−−
n
riiT λ (1)
90% (2)
95% (3)
99% r = 0 r ≥ 1 0.062859 28.71499 32.00 34.91 41.07 r ≤ 1 r≥ 2 0.045588 13.97783 17.85 19.96 24.60 r ≤ 2 r ≥ 3 0.014806 3.385986 7.52 9.24 12.97
Maximum eigenvalue test
H0: rank (Π) = r Ha: rank (Π) = r + 1 λi )1ln( 1+
∧−− rT λ
(1) 90%
(2) 95%
(3) 99%
r = 0 r = 1 0.062859 14.73716 19.77 22.00 26.81 r ≤ 1 r = 2 0.045588 10.59185 13.75 15.67 20.20 r ≤ 2 r = 3 0.014806 3.385986 7.52 9.24 12.97
Panel B: Mexican, Canadian, US and World capital markets a)
Trace Test
H0: rank (Π) ≤ r Ha: rank (Π) ≤ n λi )1ln(1
∑+=
∧−−
n
riiT λ (1)
90% (2)
95% (3)
99% r = 0 r ≥ 1 0.116959 53.46544** 49.65 53.12 60.16 r ≤ 1 r ≥ 2 0.058825 25.23035 32.00 34.91 41.07 r ≤ 2 r ≥ 3 0.027593 11.46812 17.85 19.96 24.60 r ≤ 3 r ≥ 4 0.022287 5.116487 7.52 9.24 12.97
Maximum eigenvalue test
H0: rank (Π) = r Ha: rank (Π) = r + 1 λi )1ln( 1+
∧−− rT λ
(1) 90%
(2) 95%
(3) 99%
r ≤ 1 r = 2 0.058825 13.76223 19.77 22.00 26.81 r = 0 r = 1 0.116959 28.23509** 25.56 28.14 33.24 r ≤ 2 r = 3 0.027593 6.351636 13.75 15.67 20.20 r ≤ 3 r = 4 0.022287 5.116487 7.52 9.24 12.97
a) One lag in VAR, neither LM(12) nor pormateau tests show evidence of correlated residuals **Rejection of H0 at 5% significance level. (1), (2), (3) Osterwald-Lenum critical values at 90, 95 and 99 percentil, respectively, of asymptotic rank test distribution.
Considering cointegration, as posited by Bernard (1992), in a system of n stock market indexes the existence of n - 1 cointegrating vectors is a necessary condition for full integration among the n markets, implying the existence of only one common stochastic trend and any other stochastic trend becomes purged by the effect of cointegration. So, if the three NAFTA capital markets were fully integrated, there would be two cointegration relationships. Similarly, if the three NAFTA markets and the world capital market were fully integrated, three cointegration equations would be expected.
Table 5 presents the evidence for he full sample, 1984-2002, provided by the Johansen rank test of the matrix of long run relationships (Π) for the case of the NAFTA capital markets as well as for the case of integration of these markets with the world capital market.
In the case of the NAFTA markets the null hypothesis of no cointegration cannot be rejected at any significance level according to the trace and eigenvalue tests; hence the NAFTA capital markets cannot be considered cointegrated. Taking into account the critical values estimated by Osterwald-Lenum (1992) the hypothesis of no cointegration among the NAFTA markets cannot be also rejected at the 20 percent level of significance. That is the statistical test do not provide evidence in favor of a significant long run relationship amongst the Canadian, U.S. and Mexican capital markets.
167
rEviSta dE Economía mundial 26, 2010, 155-176
cointEGration trEndS amonG thE nafta Equity markEtS
taBlE 5: full SamPlE rank tESt (JohanSEn tEchniquE) January 1984-dEcEmBEr 2002 .
TABLE 4: VAR RESIDUALS AUTOCORRELATION TESTS.
H0: no autocorrelations on residuals until k lag k LM p-value Q p-value Adjusted Q p-value df1
1 15.20448 0.5097 0.831623 NA2 0.835303 NA2 NA2
2 14.55086 0.5577 15.41622 0.4944 15.54954 0.4848 16 3 14.05871 0.5943 29.46227 0.5956 29.78371 0.5792 32 4 19.07319 0.2649 47.92761 0.4758 48.58027 0.4495 48 5 18.35059 0.3038 65.34194 0.4299 66.38681 0.3947 64 6 19.86197 0.2265 84.72249 0.3377 86.29352 0.2955 80 7 6.743130 0.9779 91.26925 0.6175 93.04860 0.5663 96 8 17.52343 0.3525 108.1847 0.5844 110.5820 0.5202 112 9 19.24269 0.2563 126.7752 0.5140 129.9400 0.4355 128 10 16.06227 0.4486 141.5195 0.5429 145.3637 0.4525 144 11 16.64906 0.4086 158.2322 0.5247 162.9275 0.4208 160 12 14.54364 0.5583 172.0304 0.5705 177.4959 0.4542 176
1df = degrees of freedom. 2 Not allowable.
TABLE 5: FULL SAMPLE RANK TEST (JOHANSEN TECHNIQUE) JANUARY 1984-DECEMBER 2002.
Panel A: Mexican, Canadian and US capital markets a)
Trace Test
H0: rank(Π) ≤ r Ha: rank (Π) ≤ n λi )1ln(1
∑+=
∧−−
n
riiT λ (1)
90% (2)
95% (3)
99% r = 0 r ≥ 1 0.062859 28.71499 32.00 34.91 41.07 r ≤ 1 r≥ 2 0.045588 13.97783 17.85 19.96 24.60 r ≤ 2 r ≥ 3 0.014806 3.385986 7.52 9.24 12.97
Maximum eigenvalue test
H0: rank (Π) = r Ha: rank (Π) = r + 1 λi )1ln( 1+
∧−− rT λ
(1) 90%
(2) 95%
(3) 99%
r = 0 r = 1 0.062859 14.73716 19.77 22.00 26.81 r ≤ 1 r = 2 0.045588 10.59185 13.75 15.67 20.20 r ≤ 2 r = 3 0.014806 3.385986 7.52 9.24 12.97
Panel B: Mexican, Canadian, US and World capital markets a)
Trace Test
H0: rank (Π) ≤ r Ha: rank (Π) ≤ n λi )1ln(1
∑+=
∧−−
n
riiT λ (1)
90% (2)
95% (3)
99% r = 0 r ≥ 1 0.116959 53.46544** 49.65 53.12 60.16 r ≤ 1 r ≥ 2 0.058825 25.23035 32.00 34.91 41.07 r ≤ 2 r ≥ 3 0.027593 11.46812 17.85 19.96 24.60 r ≤ 3 r ≥ 4 0.022287 5.116487 7.52 9.24 12.97
Maximum eigenvalue test
H0: rank (Π) = r Ha: rank (Π) = r + 1 λi )1ln( 1+
∧−− rT λ
(1) 90%
(2) 95%
(3) 99%
r ≤ 1 r = 2 0.058825 13.76223 19.77 22.00 26.81 r = 0 r = 1 0.116959 28.23509** 25.56 28.14 33.24 r ≤ 2 r = 3 0.027593 6.351636 13.75 15.67 20.20 r ≤ 3 r = 4 0.022287 5.116487 7.52 9.24 12.97
a) One lag in VAR, neither LM(12) nor pormateau tests show evidence of correlated residuals **Rejection of H0 at 5% significance level. (1), (2), (3) Osterwald-Lenum critical values at 90, 95 and 99 percentil, respectively, of asymptotic rank test distribution.
However, when the world market is included in the analysis, the hypothesis of no cointegration is rejected, but only at a five percent level of significance, suggesting that NAFTA markets and the world capital market could be integrated; nevertheless it is worth noting that the Johansen cointegration tests only show evidence of the existence of one cointegrating vector tiding over the long run behavior of these four markets, i.e., seemingly there is a long run relationship only due to the presence of the detected cointegration vector.
The lack of evidence about cointegration relationships in the case of the three NAFTA capital markets suggests that the driving forces that influence their respective behavior are independent. For that reason, to further test integration of the capital markets from the NAFTA countries bivariate Johansen cointegration analyses are conducted. Table 6 shows the results.
Taken by pairs, cointegration tests do not reject the null hypothesis of no cointegration in any case, even if a 10 percent level of significance is chosen, but in the case of Mexican-U.S. markets cointegration tests (Panel B), the no rejection at 10% significance level is only marginal, as shown by both the trace statistic as maximum eigenvalue tests. Trace test on Canadian-U.S. markets shows also a marginal no rejection, but maximum eigenvalue test
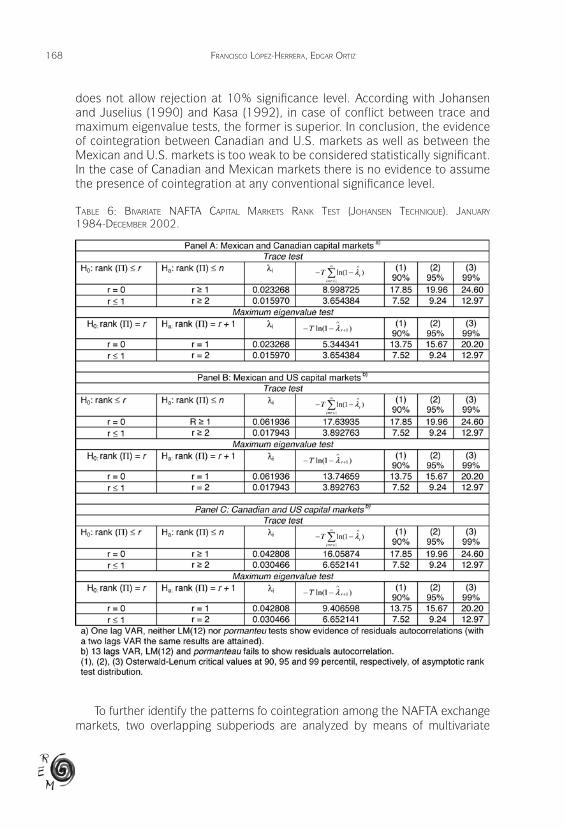
168 franciSco lóPEz-hErrEra, EdGar ortiz
does not allow rejection at 10% significance level. According with Johansen and Juselius (1990) and Kasa (1992), in case of conflict between trace and maximum eigenvalue tests, the former is superior. In conclusion, the evidence of cointegration between Canadian and U.S. markets as well as between the Mexican and U.S. markets is too weak to be considered statistically significant. In the case of Canadian and Mexican markets there is no evidence to assume the presence of cointegration at any conventional significance level.
taBlE 6: BivariatE nafta caPital markEtS rank tESt (JohanSEn tEchniquE) . January 1984-dEcEmBEr 2002 .
To further identify the patterns fo cointegration among the NAFTA exchange markets, two overlapping subperiods are analyzed by means of multivariate
169
rEviSta dE Economía mundial 26, 2010, 155-176
cointEGration trEndS amonG thE nafta Equity markEtS
cointegration The first subperiod, January 1984 to December 1993 (Table 7), covers data before the NAFTA agreement was enforced, January 1994; the second subperiod extends the series to December 1998 (Table 8).
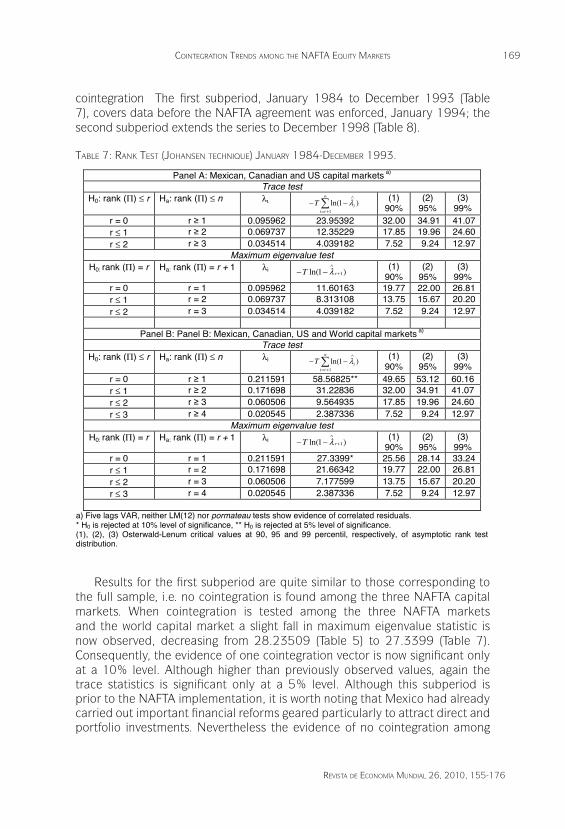
taBlE 7: rank tESt (JohanSEn tEchniquE) January 1984-dEcEmBEr 1993 .TABLE 7: RANK TEST (JOHANSEN TECHNIQUE) JANUARY 1984-DECEMBER 1993.
Panel A: Mexican, Canadian and US capital markets a)
Trace testH0: rank (Π) ≤ r Ha: rank (Π) ≤ n λι )1ln(
1∑
+=
∧−−
n
riiT λ (1)
90% (2)
95% (3)
99% r = 0 r ≥ 1 0.095962 23.95392 32.00 34.91 41.07r ≤ 1 r ≥ 2 0.069737 12.35229 17.85 19.96 24.60r ≤ 2 r ≥ 3 0.034514 4.039182 7.52 9.24 12.97
Maximum eigenvalue test H0: rank (Π) = r Ha: rank (Π) = r + 1 λi )1ln( 1+
∧−− rT λ (1)
90% (2)
95% (3)
99% r = 0 r = 1 0.095962 11.60163 19.77 22.00 26.81r ≤ 1 r = 2 0.069737 8.313108 13.75 15.67 20.20r ≤ 2 r = 3 0.034514 4.039182 7.52 9.24 12.97
Panel B: Panel B: Mexican, Canadian, US and World capital markets a)
Trace testH0: rank (Π) ≤ r Ha: rank (Π) ≤ n λi )1ln(
1∑
+=
∧−−
n
riiT λ (1)
90% (2)
95% (3)
99% r = 0 r ≥ 1 0.211591 58.56825** 49.65 53.12 60.16 r ≤ 1 r ≥ 2 0.171698 31.22836 32.00 34.91 41.07 r ≤ 2 r ≥ 3 0.060506 9.564935 17.85 19.96 24.60 r ≤ 3 r ≥ 4 0.020545 2.387336 7.52 9.24 12.97
Maximum eigenvalue testH0: rank (Π) = r Ha: rank (Π) = r + 1 λi )1ln( 1+
∧−− rT λ (1)
90% (2)
95% (3)
99% r = 0 r = 1 0.211591 27.3399* 25.56 28.14 33.24r ≤ 1 r = 2 0.171698 21.66342 19.77 22.00 26.81r ≤ 2 r = 3 0.060506 7.177599 13.75 15.67 20.20r ≤ 3 r = 4 0.020545 2.387336 7.52 9.24 12.97
a) Five lags VAR, neither LM(12) nor pormateau tests show evidence of correlated residuals. * H0 is rejected at 10% level of significance, ** H0 is rejected at 5% level of significance. (1), (2), (3) Osterwald-Lenum critical values at 90, 95 and 99 percentil, respectively, of asymptotic rank test distribution.
Results for the first subperiod are quite similar to those corresponding to the full sample, i.e. no cointegration is found among the three NAFTA capital markets. When cointegration is tested among the three NAFTA markets and the world capital market a slight fall in maximum eigenvalue statistic is now observed, decreasing from 28.23509 (Table 5) to 27.3399 (Table 7). Consequently, the evidence of one cointegration vector is now significant only at a 10% level. Although higher than previously observed values, again the trace statistics is significant only at a 5% level. Although this subperiod is prior to the NAFTA implementation, it is worth noting that Mexico had already carried out important financial reforms geared particularly to attract direct and portfolio investments. Nevertheless the evidence of no cointegration among
170 franciSco lóPEz-hErrEra, EdGar ortiz
the NAFTA capital markets and the weak evidence of cointegration when the world capital market is also considered suggest that liberalization of the Mexican stock market was not enough to integrate it to the Canadian and U.S. stock markets, as well as to the world capital market.
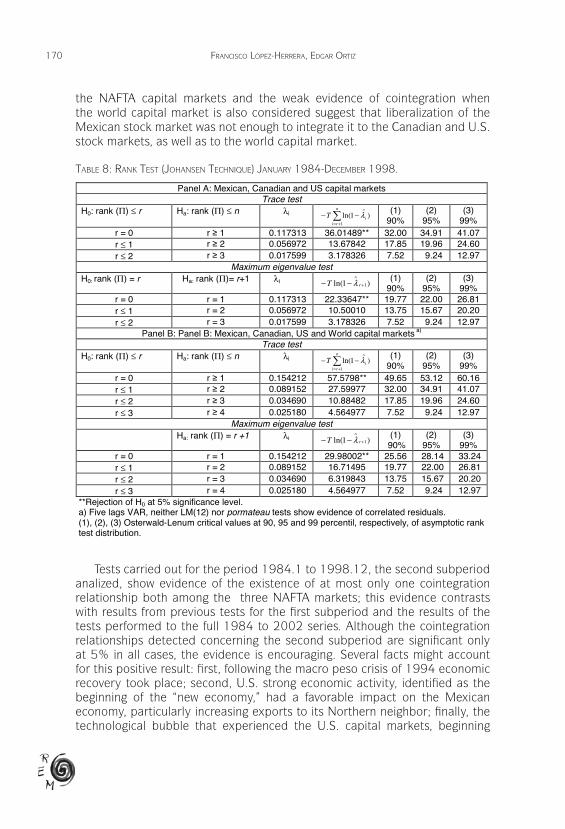
taBlE 8: rank tESt (JohanSEn tEchniquE) January 1984-dEcEmBEr 1998 .TABLE 8: RANK TEST (JOHANSEN TECHNIQUE) JANUARY 1984-DECEMBER 1998.
Panel A: Mexican, Canadian and US capital markets Trace test
H0: rank (Π) ≤ r Ha: rank (Π) ≤ n λi )1ln(1
∑+=
∧−−
n
riiT λ (1)
90% (2)
95% (3)
99% r = 0 r ≥ 1 0.117313 36.01489** 32.00 34.91 41.07 r ≤ 1 r ≥ 2 0.056972 13.67842 17.85 19.96 24.60 r ≤ 2 r ≥ 3 0.017599 3.178326 7.52 9.24 12.97
Maximum eigenvalue test H0: rank (Π) = r Ha: rank (Π)= r+1 λi )1ln( 1+
∧−− rT λ (1)
90% (2)
95% (3)
99% r = 0 r = 1 0.117313 22.33647** 19.77 22.00 26.81r ≤ 1 r = 2 0.056972 10.50010 13.75 15.67 20.20 r ≤ 2 r = 3 0.017599 3.178326 7.52 9.24 12.97
Panel B: Panel B: Mexican, Canadian, US and World capital markets a)
Trace testH0: rank (Π) ≤ r Ha: rank (Π) ≤ n λi )1ln(
1∑
+=
∧−−
n
riiT λ (1)
90% (2)
95% (3)
99% r = 0 r ≥ 1 0.154212 57.5798** 49.65 53.12 60.16 r ≤ 1 r ≥ 2 0.089152 27.59977 32.00 34.91 41.07 r ≤ 2 r ≥ 3 0.034690 10.88482 17.85 19.96 24.60 r ≤ 3 r ≥ 4 0.025180 4.564977 7.52 9.24 12.97
Maximum eigenvalue testHa: rank (Π) = r +1 λi )1ln( 1+
∧−− rT λ (1)
90% (2)
95% (3)
99% r = 0 r = 1 0.154212 29.98002** 25.56 28.14 33.24 r ≤ 1 r = 2 0.089152 16.71495 19.77 22.00 26.81 r ≤ 2 r = 3 0.034690 6.319843 13.75 15.67 20.20 r ≤ 3 r = 4 0.025180 4.564977 7.52 9.24 12.97
**Rejection of H0 at 5% significance level. a) Five lags VAR, neither LM(12) nor pormateau tests show evidence of correlated residuals. (1), (2), (3) Osterwald-Lenum critical values at 90, 95 and 99 percentil, respectively, of asymptotic rank test distribution.
Tests carried out for the period 1984.1 to 1998.12, the second subperiod analized, show evidence of the existence of at most only one cointegration relationship both among the three NAFTA markets; this evidence contrasts with results from previous tests for the first subperiod and the results of the tests performed to the full 1984 to 2002 series. Although the cointegration relationships detected concerning the second subperiod are significant only at 5% in all cases, the evidence is encouraging. Several facts might account for this positive result: first, following the macro peso crisis of 1994 economic recovery took place; second, U.S. strong economic activity, identified as the beginning of the “new economy,” had a favorable impact on the Mexican economy, particularly increasing exports to its Northern neighbor; finally, the technological bubble that experienced the U.S. capital markets, beginning
171
rEviSta dE Economía mundial 26, 2010, 155-176
cointEGration trEndS amonG thE nafta Equity markEtS
in 1996, coupled with further financial liberalization reforms in Mexico, also led to greater activity at the Mexican stock market; in fact, during global stock market bubbles comovements and cointegration seemingly increase temporarily across national stock markets (Brooks and Del Negro, 2005). All these facts undoubtedly contributed to move the Mexican market closer to the behavior from the U.S. and Canadian markets.
The evidence provided in this paper by no means suggests that the hypothesis on no cointegration can be rejected at a one percent level of significance. Neither it is possible to find evidence that there is more than one cointegration vector considering only the three NAFTA markets or including the world capital market. Time-varying cointegration trends have been reported for the Latin American stock markets (Bekaert and Harvey, 1995; Barari, 2004). Hence a reasonable explanation for the result obtained through the econometric tests previously presented might be that the driving forces for the long run relationship among the NAFTA capital markets change over time, becoming not necessarily tighter, but possibly also becoming weaker during some periods. A similar assertion could be made about the relationship among NAFTA capital markets and the world capital market, although such a claim would be weaker.
4 . concluSionS and rESEarch aGEnda .
This paper has analyzed a first generation pattern of integration among the stock markets from Mexico, Canada and U.S. and among integration of these markets to the world capital market. Multivariate Johansen cointegration tests were carried out for 1984 to 2002 period and for two subperiods, dividing the sample to analyze cointegration before and after the NAFTA implementation. Bivariate cointegration test were also carried out, taking the NAFTA markets by pairs.
Empirical results show that the Mexican, Canadian and U.S. stock markets are partially segmented; these results are consistent with Errunza and Losq (1985) model of mild segmentation. This evidence is confirmed by the fact that it was not possible to find two cointegrating relationships for applications of Johansen analysis technique. The evidence of no cointegration for the full sample tests is discomforting, considering the high level of economic activity that Mexico maintains with the U.S. economy as well as the small but growing relationship with Canada. It is also disappointing considering the high degree of openness of the Mexican stock market. Nevertheless, the evidence provided in this paper is consistent with the Bekaert and Harvey (1995) and Barari (2004) findings of a time varying integration level of the Latin American emerging markets in relation to the world market The evidence of Johansen cointegration analysis presented in the empirical section of this work suggests that integration among NAFTA capital markets is time-varying. It is also worth pointing out that Atteberry and Swanson (1997) results support the hypotheses both of partial segmentation and time-varying integration of NAFTA capital markets. Darrat and Zhong (2005) suggest stronger links among NAFTA capital markets
172 franciSco lóPEz-hErrEra, EdGar ortiz
resulting from the commercial agreement among Mexico, Canada and U.S.; this evidence is akin to the results of cointegration presented in this work for the January 1984 to December 1998 subperiod. Similar results are reported by Galindo and Guerrero (1999) about Mexican and U.S. markets integration; they find evidence of a cointegrating relationship between those markets, even though they also observe a diminishing degree on the cointegration statistics. Nevertheless, the works just mentioned used market indexes expressed in local currencies; hence, they rather show evidence concerning the relationships among these markets derived from currency impacts.
The differences on the relative weight of each stock market on the local financial system, risks associated to each economy, transaction costs and other issues related to market efficiency, could be reasonable explanations of the mild integration between Mexican, Canadian and U.S. markets. Yet, it must be acknowledged that NAFTA is an ongoing process; in addition these countries will be experiencing further economic and financial changes, as well as legal and economic reforms, particularly in the case of Mexico. Hence, further research on NAFTA capital markets integration will be required. Integration among these markets to world’s capital markets will also demand more research efforts. In addition to examining the impacts on integration from institutional changes implemented by Bolsa Mexicana de Valores, further research on this area should also include contagion and the transmission of returns and volatility among the NAFTA markets and the global stock markets. Comparative studies between these markets and integration at other regions, particularly coincerning the new European Union countries and the mature markets from this area, and integration patterns from the Asian countries should be also included in future research works. Finally, these studies should be extended to include the emerging markets from Latin America
rEfErEncES .
Aggarwal, R, and Kyaw, N. A. (2005): “Equity Market Integration in the NAFTA Region: Evidence from Unit Root and Cointegration Tests”, International Review of Financial Analysis, 14, 393-406.
Aggarwal R., Lucey, B.M. and Muckley, C. (2006): “Dynamics of Equity Market Integration in Europe: Impact of Political Events”, Working Paper, Finance Department, Kent State University.
Al-Knazali, O.M. (2003): “Stock Prices, Inflation and Output: Evidence from Emerging Markets”, Journal of Emerging Markets Finance 2, 287-314.
Atteberry, W.L. and Swanson, P.E. (1997): “Equity Market Integration: The Case of North America”, North American Journal of Economics and Finance, 8, 23-37.
Bachman, D, J.J. Choi, J.J., .Jeon , B.N. and Kopecky, K.J. (1996): “Common Factors in International Stock Prices: Evidence from a Cointegration Study”, International Review of Financial Analysis, 5, 39-53.
173
rEviSta dE Economía mundial 26, 2010, 155-176
cointEGration trEndS amonG thE nafta Equity markEtS
Barari, M. (2004): “Equity Market Integration in Latin America: A Time-varying Integration Score Analysis”, International Review of Financial Analysis, 13, 649-668.
Bekaert, G. and Harvey, C.R. (1995): “Time-varying World Market Integration”, Journal of Finance, 50, 403-444.
Bernard, A.B. (1992): “Empirical Implications of the Convergence Hypothesis”, Working Paper, Massachusetts Institute of Technology.
Bolsa Mexicana de Valores (2008): “Global BMV. Las empresas del mundo en tu bolsa. Guía Operativa”, Bolsa Mexicana de Valores, (http://www.bmv.com.mx/wb3/wb/BMV/BMV_mercado_global, (December 26, 2009)
Brooks, R. M. and Del Negro, M. (2004): “The Rise in Comovement across National Stock Markets: Market Integration or IT Bubble?“, Journal of Empirical Finance, 11, 659-680.
Bucio Pacheco, L. (2009): Factores macroeconómicos, riesgo sistemático e integración de los mercados de capital del TLCAN, Tesis de Maestría, Facultad de Economía, Universidad Nacional Autónoma de México.
Cabello, A. (1999): Globalización y Liberalización Financieras y la Bolsa Mexicana de Valores. Del Auge a la Crisis, Plaza y Valdés, México, D.F.
Cabello, A. (2001): “Financial Liberalization and the Mexican Stock Market beyond the 1994 Crisis”, in Meric, I. and Meric G. (edit.): Global Financial Markets at the End of the Century, Pergamon, Kidlington, Oxford.
Cabello, A., Johnson, R., and Ortiz, E. (2006): “Paridad del poder adquisitivo y mercados efficientes: Análisis a largo plazo del peso mexicano”, in Correa, E. and Girón, A. (edit.): Reforma financiera en Amércia Latina, CLACSO Libros, Buenos Aires.
Carrieri, F., Errunza, V.R. and Hogan, K. (2001): “Characterizing World Market Integration through Time”, Working Paper, McGill University, Montreal.
Chan, K.C. and Lai, P. (1993): “Unit Root and Cointegration Tests of World Stock Prices”, in Stansell Stanley R. (edit): International Financial Market Integration, Blackwell, Oxford.
Ciner, C. (2006): “A Further Look at Linkages between NAFTA Equity Markets”, The Quarterly Review of Economics and Finance, 16, 338-352.
Chelley-Steeley, P. (2004): “Equity Market Integration in the Asia-Pacific Region: A Smooth Transition Analysis”, International Review of Financial Analysis, 13, 621-632.
Chen, G-M., Firth, M and Rui, O. M. (2004): “Stock Market Linkages: Evidence from Latin America”, Journal of Banking & Finance, 26, 1113-1141.
Cho, D.C., Eun, C.S. and Senbet, L.W. (1986): “International Arbitrage Pricing Theory: An Empirical Investigation”, Journal of Finance, 41, 313-330.
Click, R.W. and Plummer, M.G. (2005): “Stock Market Integration in ASEAN after the Asian Financial Crisis”, Journal of Asian Economics, 16, 5-28.
174 franciSco lóPEz-hErrEra, EdGar ortiz
Da Costa, N. C. A. and Ceretta, P.S. (2001): “International Portfolio Diversification: The Case of Latin American Markets”, in Kotabe, Masaaki y Leal, Ricardo P. C. (edit.) (2001): Market Revolution in Latin American: Beyond Mexico, Pergamon. Kidlington, Oxford.
Darrat, A.F. and Zhong, M. (2005): “Equity Market Integration and Multinational Agreements: The Case of NAFTA”, Journal of International Money and Finance, 24, 793-817.
Dickey, D.A. and Fuller, W.A. (1979): “Distribution of the Estimators for Autoregressive Time Series with a Unit Root”, Journal of the American Statistical Association, 74, 427-431.
Doshi, K., Johnson, R., Ortiz, E. and Soenen, L. (2001): “Privatization Financial Liberalization and Stock Market Performance: The Case of Mexico”, in Kotabe, Masaaki y Leal, Ricardo P. C. (edit.): Market Revolution in Latin American: beyond Mexico, Pergamon, Kidlington, Oxford.
Errunza, V.R. (1979): “Efficiency and the Programs to Develop Capital Markets: The Brazilian Experience”, Journal of Banking and Finance, 3, 355-382.
Errunza, Vihang R. y Losq, E. (1985): “International Asset Pricing under Mild Segmentation: Theory and Test”, Journal of Finance, 40(1), 105-124.
Errunza, V.R. and Miller, D.P. (2000): “Market Segmentation and the Cost of Capital in International Equity Markets”, Journal of Financial and Quantitative Analysis, 35, 577-600.
Ewing, B. T., Payne, J. E. and Sowell, C. (1999): “NAFTA and North American Stock Market Linkages: An Empirical Note”, North American Journal of Economics and Finance, 10, 443-451.
Fernández-Serrano, J.L. and Sosvilla-Rivero, S. (2001): “Modelling Evolving Long-run Relationships: The Linkages between Stock Markets in Asia”, Japan and the World Economy, 13, 145-160.
Fernández-Serrano, J. L. and Sosvilla-Rivero, S. (2003): “Modelling the Linkages between US and Latin American Stock Markets”, Applied Economics, 35, 1423-1434.
Galindo, L.M. and Guerrero, C. (1999): “La transmisión de las crisis financieras: la relación entre los Índices de precios de las bolsas de valores de México y Estados Unidos”, Economía: Teoría y Práctica, 11, 83-95.
Garret, I., Hyed, S. and Varas, J. (2004): “The Interaction between Latin American Stock Markets and US”, Working Paper, Manchester School of Business.
Granger, C.W. J. (1981): “Some Properties of Time Series Data and their Use in Econometric Model Specification”, Journal of Econometrics, 16, 121-130.
Grubel, O.J. (2007): “Globalization and the New Business Models for the Banking Industry”, CEO Credit Suisse Group, Zurich.
Hamilton, J.D. (1994): Time Series Analysis, Princeton University Press, Princeton, NJ.
175
rEviSta dE Economía mundial 26, 2010, 155-176
cointEGration trEndS amonG thE nafta Equity markEtS
Hunter, D.M. (2006): “The Evolution of Stock Market Integration in the Post-Liberalization Period. A Look at Latin America”, Journal of International Money and Finance, 25, 795-826.
Johansen, S. (1991): “Estimation and Hypothesis Testing of Cointegration Vectors in Gaussian Vector Autoregressive Models”, Econometrica, 59, 1551-1580.
Johansen, S. (1992): “Determination of Cointegration Rank in the Presence of a Linear Trend”, Oxford Bulletin of Economics and Statistics, 54, 383-397.
Johansen, S. (1988): “Statistical Analysis of Cointegrating Vectors”, Journal of Economic Dynamics and Control, 12, 231-254.
Johansen, S. (1999): “Estimation and Hypothesis Testing of Cointegration Vectors in Gaussian Vector Autoregressive Models”, Econometrica, 59, 1551-1580.
Johansen, S. and Juselius, K. (1990): “Maximum Likelihood Estimation and Inference on Cointegration with Applications to Money Demand”, Oxford Bulletin of Economics and Statistics, 52, 169-210.
Kasa, K. (1992): “Common Stochastic Trends in International Stock Markets”, Journal of Monetary Economics, 29, 95-124.
Koh, T. S, and Maysami, R.C. (1996): “A Cointegration Analysis of the Impact of Economic Forces and Global Market Integration on the Singapore Stock Market”, Nanyang Business School, mimeo.
Lucey, M. and Voronkova, S. (2005): “Linkages and Relationships between Emerging and Developed Stock Markets before and after the Russian crisis of 1997-1998”, Working Paper, Trinity University.
Márquez Pozos, J.M., Islas Camargo, A. and Venegas Martínez, F. (2003): “Corrientes internacionales de capital e inversión extranjera de cartera. El caso de México, 1989-1999”, El Trimestre Económico, 70, 791-833.
Masih, R. and A.B.M. Masih (2001): “Long and Short Term Dynamic Causal Transmission amongst International Stock Markets”, Journal of International Money and Finance, 20, 563-587.
Neubauer, M. (2006): “International Portfolio Diversification in the Central European Region”, Prague Economic Papers, Vysoká škola ekonomická.
Ortiz, E. (2007): “Irrelevancia de los mercados de valores emergentes”, Ponencia, II Coloquio Internacional Mutaciones del Capitalismo, Facultad de Ciencias Políticas y Sociales, Universidad Nacional Autónoma de México.
Ortiz, E. (2008): “Finanzas y productos derivados. Contratos adelantados, futuros, opciones, swaps”, Facultad de Ciencias Políticas y Sociales. Universidad Nacional Autónoma de México, mimeo.
176 franciSco lóPEz-hErrEra, EdGar ortiz
Ortiz, E., Cabello, A., and De Jesús, R. (2006): “Long-run Inflation and Exchange Rates Hedge of Stocks in Brazil and Mexico”, Global Economy Journal 6, 3.
Osterwald-Lenum, M.A (1992): “A Note with Quantiles of the Asymptotic Distribution of the Maximum Likehood Cointegration Rank Test Statistics”, Oxford Bulletin of Economics and Statistics, 54, 461-472.
Pérez de Gracia, F. and Cuñado Eizaguirre, J. (2000): “Integración bursátil en América Latina”, Mimeo, Facultad de Ciencias Económicas y Empresariales, Universidad de Navarra, Pamplona.
Phillips, P.C.B. and Perron, P. (1988): “Testing for a Unit Root in Time Series Regression”, Biometrika, 75, 335-346.
Perron, P. (1989): “The Great Crash, the Oil Price Shock, and the Unit Root Hypothesis”, Econometrica, 57 (6), 1361-1401.
Phylaktis, K. and Ravazzolo, F. (2005): “Stock Market Linkages in Emerging Markets: Implications for International Portfolio Diversification”, Journal of International Markets, Institutions and Money, 15, 91-106.
Serletis, A. and King, M. (1997): “Common Stochastic Trends and Convergence of European Union Stock Markets”, The Manchester School of Economic and Social Studies, 64, 44-57.
Shackman, J. D. (2006): “The Equity Premium and Market Integration: Evidence from International Data”, Journal of International Financial Markets, Institutions and Money, 16,155-179.
Spyrou, S.I. (2004): “Are Stocks a Good Hedge against Inflation? Evidence from Emerging Markets”, Applied Economics 36, 41-48.
Stock, J. H. and Watson, M.W. (1988): “Testing for Common Trends”, Journal of the American Statistical Association, 83, 1097-1107.
Tambi, M.K. (2006): “A Test of Integration between Emerging and Developed Nation’s Stock Markets” Working Paper, Indian Institute for Management Teachers (IIMT), Hyderabad- India.
Torres, A., and Vela, O. (2003): “Trade Integration and Synchronization between the Business Cycles of Mexico and the United States”, The North American Journal of Economics and Finance, 14, 319-342.
Voronkova, S. (2004): “Equity Market Integration in Central European Emerging Markets: A Cointegration Analysis with Shifting Regimes”, International Review of Financial Analysis, 13, 633-647.
Yang, J., Kolari, J.W. and Sutanto, P.W. (2004): “On the Stability of Long-run Relationships between Emerging and US Stock Markets”, Journal of Multinational Financial Management, 14(3), 233-248.
Zivot, E. and Andrews, D. W. K. (1992): “Further Evidence on the Great Crash, the Oil-price Shock, and the Unit Root Hypothesis”, Journal of Business and Economic Statistics, 10(3), 251-270.