artÍculo de investigaciÓn / research article · esperado a 20 años supera los 30 millones de...
TRANSCRIPT
Volumen 29, no. 2Julio-diciembre, 2011ISSN: 0122-3461
* Texas Transportation Institute-The Texas A&M University System, College Station, Texas (USA). [email protected], [email protected], [email protected]** Department of Civil Engineering, Universidad del Magdalena (Santa Marta, Colombia). [email protected], [email protected]*** School of Chemical and Metallurgical Engineering, University of the Witwatersrand, Johannesburg (South Africa). [email protected] author: Lubinda F. Walubita. Email: [email protected]; [email protected]. Address: TTI-The Texas A&M University System, College Station, TX, USA. Phone: +1 (979) 862-3356. Fax: +1 (979) 845-1701.Grants and support: The authors thank TxDOT and the Federal High-way Administration (FHWA) for their financial support.
Lubinda F. Walubita*Wenting Liu*
Tom Scullion*Texas A&M University System (United States)
Allex Eduardo Alvarez-Lugo**Yenis Margarita López-Esalas**
Universidad del Magdalena (Colombia)Geoffrey Simate***
University of the Witwatersand (South Africa)
ARTÍCULO DE INVESTIGACIÓN / RESEARCH ARTICLE
Traffic weigh-in-motion (WIM) measurements and validation of the Texas perpetual pavement structural
design concept
Mediciones con estaciones de pesaje de tráfico en movimiento y validación del concepto de diseño estructural de
pavimentos perpetuos de Texas
TrAFFIC WEIGH-In-MOTIOn (WIM) MEASUrEMEnTS AnD VALIDATIOn OF THE TEXAS PErPETUAL PAVEMEnT STrUCTUrAL DESIGn COnCEPT
267Ingeniería & Desarrollo. Universidad del norte. 29(2): 266-285, 2011
Fech
a de
rece
pció
n: 3
0 de
juni
o de
201
1Fe
cha
de a
cept
ació
n: 1
4 de
sep
tiem
bre
de 2
011
Abstract
Over the past few years, the State of Texas has used perpetual pavement (PP) structures on its heavily trafficked highways, where the expected 20-year truck-traffic estimate of 80 kn ESALs (equivalent single axle loads) is in excess of 30 million. As a means to validate the Texas PP structural design concept and to make optimal future truck-traffic design recommendations, traffic Weigh-In-Motion (WIM) measurements were conducted and analyzed for two PP projects. The findings indicated that the initial 80 kn ESAL traffic design estimates for PP were comparable to the projections based on the actual measured WIM traffic data. However, underestimation of the hot mix asphalt layer dynamic moduli resulted in conservative designs for the PP structures. In addition, based on the suc-cessful use of the automated WIM data stations for traffic data collection, the paper highlights possible applications and advantages (as compared to conventional manual collection of traffic data) of using detailed WIM traffic data information for future analyses of both highway operation and pavement structural design.
Keywords: Perpetual pavement (PP), Traffic, Weigh-In-Motion (WIM), Axle load, 80 kn Equivalent single axle loads (ESALs), Gross vehicle weight (GVW).
Resumen
Desde hace unos años, en Texas se vienen utilizando estructuras de pa-vimento perpetuo (PP) en carreteras de tráfico pesado, donde el tráfico esperado a 20 años supera los 30 millones de ejes equivalentes de 80 kN. Con el fin de realizar una validación del diseño de PP y presentar recomendaciones para la estimación de tráficos de diseño, se realizaron y analizaron mediciones obtenidas con estaciones de pesaje de tráfico en movimiento (WIM) ubicadas en dos proyectos de PP. Los resultados encontrados indicaron que las estimaciones del tráfico inicial de diseño de PP fueron comparables con las proyecciones basadas en los datos arrojados por WIM. Sin embargo, se encontró que la subestimación de los módulos dinámicos de las mezclas asfálticas en caliente conllevó a diseños muy conservadores para las estructuras de PP. Adicionalmente, considerando que el uso de estaciones WIM para recolectar datos de trá-fico en forma automatizada fue exitoso, en este artículo se destacan las posibles aplicaciones y ventajas (con respecto a sistemas manuales de recolección de datos de tráfico) de usar información de tráfico detallada obtenida mediante el sistema WIM para el análisis futuro de la operación de carreteras y el diseño estructural de pavimentos.
Palabras clave: Pavimentos perpetuos, Sistema de pesaje en mo-vimiento, Ejes sencillos equivalentes de 80 kn, Peso bruto vehicular.
Lubinda F. Walubita, Wenting Liu, Tom Scullion, Allex Eduardo Alvarez-Lugo, Yenis Margarita López-Esalas, Geoffrey Simate
268 Ingeniería & Desarrollo. Universidad del norte. 29(2): 266-285, 2011
1. INTRODUCTION
Given that the movement of heavy vehicles, exceeding the permitted legal maximum load, has negative consequences on the highway operations (e.g., increased risk of accidents and premature deterioration of pavement structures), there is an ultimate need for installing automated methods to monitor and control the present and future vehicle operation on the roads. Conventionally, the vehicle weighting was done in a static way, which implied traffic disruptions. In addition, vehicle weighting random sampling operation was typically done, because in high-volume vehicle highways it was not possible to weigh all the trucks. However, the evolution of the available tools has led to the development of systems for automated load monitoring that can be applied to moving vehicles; specifically WIMs (Weigh in Motion Systems).
The WIM is, basically, a mechanism to estimate the motionless (static) weight of a vehicle from measurements of the vertical component of dynamic tire forces applied to a sensor on a smooth, level road surface. In addition, the WIM operation requires both communication- and energy-systems. In the United States, WIM systems have been used since the early 1950’s [1]. Since then, WIM stations have been evaluated using different types of sensors: they have evolved from instrumented plates (scales) fixed in a frame mounted on the road, strip sensors, and capacitive strips to the fiber optic sensors currently used including laser diode (LD) or a light-emitting diode (LED).
In this study, traffic WIM measurements were conducted on two selected highway projects (Interstate highway IH 35 and State highway SH 114) as a means to validate the Texas perpetual pavements (PP) structural design concept and to make optimal future truck-traffic design recommendations based on WIM measurements.
Since 2001, the State of Texas has been designing and constructing PP structures on some of its heavily trafficked highways where the expected 20-year truck-traffic estimate of 80 kN equivalent single-axle loads (ESALs) is in excess of 30 million. To date, there are 10 in-service PP sections, typically consisting of about 550 mm total thickness of hot-mix asphalt (HMA) layers and supported on an 200 mm thick 2% lime- or 6% cement-treated base, resting on a well compacted in-situ subgrade soil [2], [3].
TrAFFIC WEIGH-In-MOTIOn (WIM) MEASUrEMEnTS AnD VALIDATIOn OF THE TEXAS PErPETUAL PAVEMEnT STrUCTUrAL DESIGn COnCEPT
269Ingeniería & Desarrollo. Universidad del norte. 29(2): 266-285, 2011
The results and analysis of the traffic WIM data measurements on the Texas PP sections on IH 35 and SH 114 are presented and discussed in this paper as a mean to provide evidence of the potential application of WIM data for highway operation analysis and pavement structural design. In particular, traffic comparison evaluations of the initial design and actual traffic counts together with a re-design of the PP structures (i.e., based on forecasted cumulative traffic loading projected from actual measured traffic WIM data and material properties) are presented in the paper. In the paper, the WIM stations are discussed first. Traffic WIM data are then presented and analyzed followed by a re-design of the PP structures using the FPS software [4]. The paper then concludes with a summary of key findings and recommendations.
2. METHODS AND MEASUREMENTS
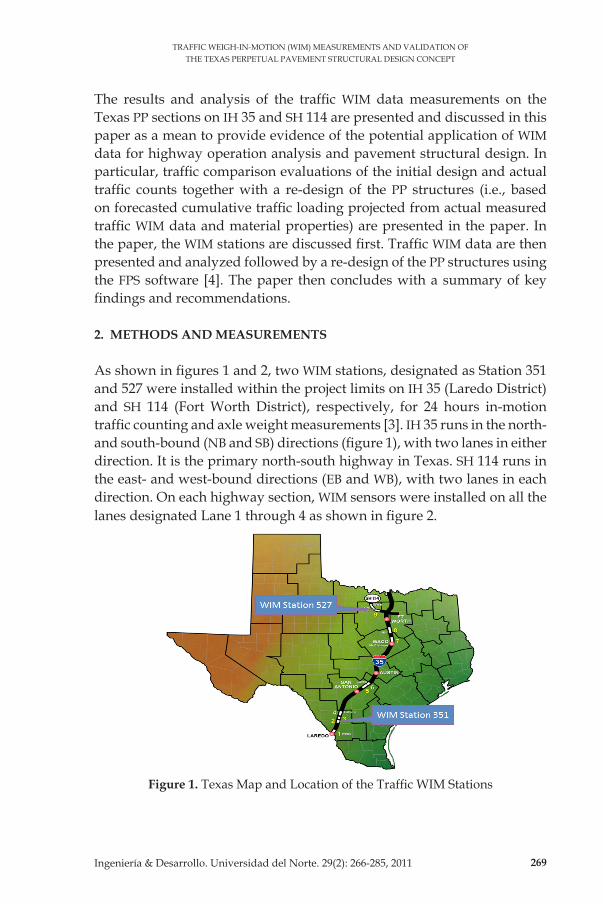
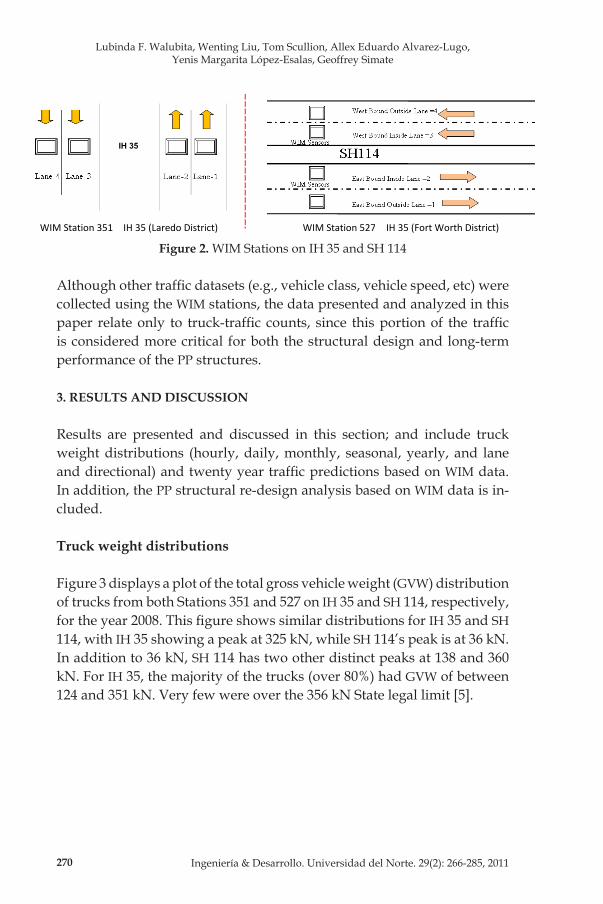
As shown in figures 1 and 2, two WIM stations, designated as Station 351 and 527 were installed within the project limits on IH 35 (Laredo District) and SH 114 (Fort Worth District), respectively, for 24 hours in-motion traffic counting and axle weight measurements [3]. IH 35 runs in the north- and south-bound (nB and SB) directions (figure 1), with two lanes in either direction. It is the primary north-south highway in Texas. SH 114 runs in the east- and west-bound directions (EB and WB), with two lanes in each direction. On each highway section, WIM sensors were installed on all the lanes designated Lane 1 through 4 as shown in figure 2.
Figure 1. Texas Map and Location of the Traffic WIM Stations
Lubinda F. Walubita, Wenting Liu, Tom Scullion, Allex Eduardo Alvarez-Lugo, Yenis Margarita López-Esalas, Geoffrey Simate
270 Ingeniería & Desarrollo. Universidad del norte. 29(2): 266-285, 2011
IH 35
WIM Station 351 IH 35 (Laredo District) WIM Station 527 IH 35 (Fort Worth District)
Figure 2. WIM Stations on IH 35 and SH 114
Although other traffic datasets (e.g., vehicle class, vehicle speed, etc) were collected using the WIM stations, the data presented and analyzed in this paper relate only to truck-traffic counts, since this portion of the traffic is considered more critical for both the structural design and long-term performance of the PP structures.
3. RESULTS AND DISCUSSION
results are presented and discussed in this section; and include truck weight distributions (hourly, daily, monthly, seasonal, yearly, and lane and directional) and twenty year traffic predictions based on WIM data. In addition, the PP structural re-design analysis based on WIM data is in-cluded.
Truck weight distributions
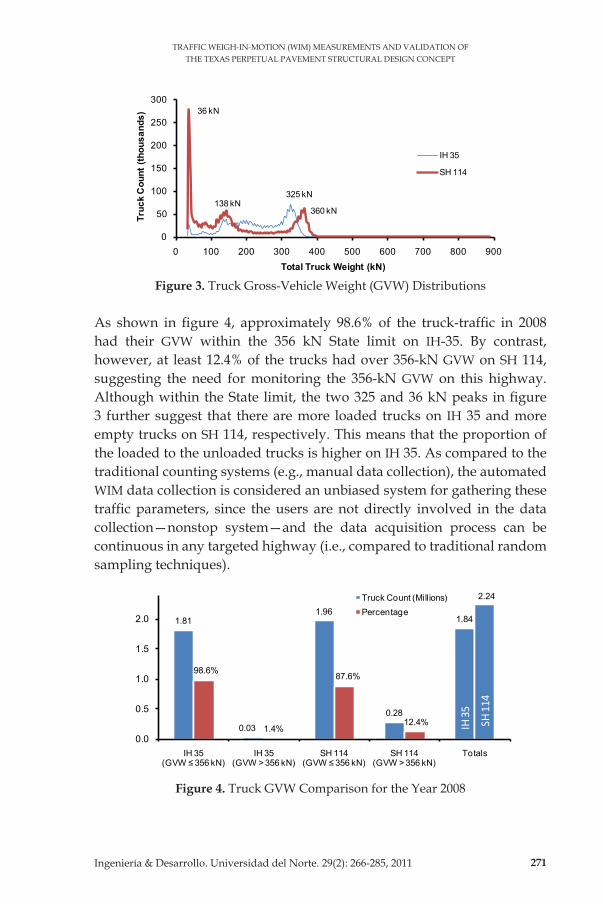
Figure 3 displays a plot of the total gross vehicle weight (GVW) distribution of trucks from both Stations 351 and 527 on IH 35 and SH 114, respectively, for the year 2008. This figure shows similar distributions for IH 35 and SH 114, with IH 35 showing a peak at 325 kn, while SH 114’s peak is at 36 kn. In addition to 36 kn, SH 114 has two other distinct peaks at 138 and 360 kn. For IH 35, the majority of the trucks (over 80%) had GVW of between 124 and 351 kn. Very few were over the 356 kn State legal limit [5].
TrAFFIC WEIGH-In-MOTIOn (WIM) MEASUrEMEnTS AnD VALIDATIOn OF THE TEXAS PErPETUAL PAVEMEnT STrUCTUrAL DESIGn COnCEPT
271Ingeniería & Desarrollo. Universidad del norte. 29(2): 266-285, 2011
325 kN
36 kN
138 kN360 kN
0
50
100
150
200
250
300
0 100 200 300 400 500 600 700 800 900
Truc
k C
ount
(tho
usan
ds)
Total Truck Weight (kN)
IH 35
SH 114
Figure 3. Truck Gross-Vehicle Weight (GVW) Distributions
As shown in figure 4, approximately 98.6% of the truck-traffic in 2008 had their GVW within the 356 kn State limit on IH-35. By contrast, however, at least 12.4% of the trucks had over 356-kn GVW on SH 114, suggesting the need for monitoring the 356-kn GVW on this highway. Although within the State limit, the two 325 and 36 kN peaks in figure 3 further suggest that there are more loaded trucks on IH 35 and more empty trucks on SH 114, respectively. This means that the proportion of the loaded to the unloaded trucks is higher on IH 35. As compared to the traditional counting systems (e.g., manual data collection), the automated WIM data collection is considered an unbiased system for gathering these traffic parameters, since the users are not directly involved in the data collection—nonstop system—and the data acquisition process can be continuous in any targeted highway (i.e., compared to traditional random sampling techniques).
1.81
0.03
1.96
0.28
1.84
98.6%
1.4%
87.6%
12.4%
2.24
0.0
0.5
1.0
1.5
2.0
IH 35 (GVW ≤ 356 kN)
IH 35 (GVW > 356 kN)
SH 114 (GVW ≤ 356 kN)
SH 114 (GVW > 356 kN)
Totals
Truck Count (Millions)Percentage
IH35
SH11
4
Figure 4. Truck GVW Comparison for the Year 2008
Lubinda F. Walubita, Wenting Liu, Tom Scullion, Allex Eduardo Alvarez-Lugo, Yenis Margarita López-Esalas, Geoffrey Simate
272 Ingeniería & Desarrollo. Universidad del norte. 29(2): 266-285, 2011
Hourly distribution of equivalent single axel loads (ESAL) of 80 kN The 80 kn ESAL were calculated using the following equation [4], [6]:
1 2 25.93 9.36 ( 1) 4.79 ( ) 4.33 tt
GLo W Lo SN Lo L L Lo Lb
= + + − + + +g g g g (1)
where Wt is the axle load applications (ESAL) at the end of time t (i.e., end of structural design period); and as defined by AASHTO [8], SN is the structural number; L1 is the load on one single or one tandem axle set in kips; L2 is the axle code (1 for single and 2 for tandem axle); Gt is a function of the change in pavement serviceability index (PSI) from initial to final PSI; and b is a parametric coefficient that is a function of the design and loading variables [6].
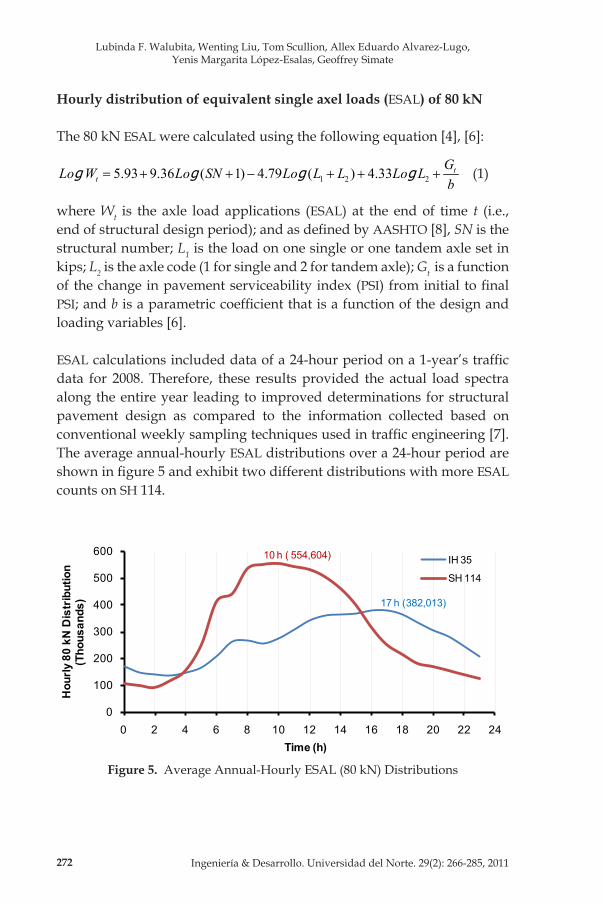
ESAL calculations included data of a 24-hour period on a 1-year’s traffic data for 2008. Therefore, these results provided the actual load spectra along the entire year leading to improved determinations for structural pavement design as compared to the information collected based on conventional weekly sampling techniques used in traffic engineering [7]. The average annual-hourly ESAL distributions over a 24-hour period are shown in figure 5 and exhibit two different distributions with more ESAL counts on SH 114.
17 h (382,013)
10 h ( 554,604)
0
100
200
300
400
500
600
0 2 4 6 8 10 12 14 16 18 20 22 24
Hou
rly 8
0 kN
Dis
trib
utio
n (T
hous
ands
)
Time (h)
IH 35
SH 114
Figure 5. Average Annual-Hourly ESAL (80 kn) Distributions
TrAFFIC WEIGH-In-MOTIOn (WIM) MEASUrEMEnTS AnD VALIDATIOn OF THE TEXAS PErPETUAL PAVEMEnT STrUCTUrAL DESIGn COnCEPT
273Ingeniería & Desarrollo. Universidad del norte. 29(2): 266-285, 2011
For the time-scale considered on the X-axis, SH 114 exhibits close to a normal hourly 80 kn ESAL distribution, while that of IH 35 appears to be skewed towards the right. In addition, the data shown in figure 5 indicate that the peak truck-traffic (80 kN) counts on the two highways do not occur at the same time. On IH 35, the majority (75%) of the 80 kn ESAL count occurs between 06 hrs (6:00 AM) and 21 hrs (9:00 PM), with a peak at 17 hrs (5:00 PM). For SH 114, majority (about 80%) of the truck traffic occurs between 05 hrs (5.00 AM) and 18 hrs (6:00 PM), with a maximum peak at 10 hrs (10:00 AM). On both highways however, the least truck traffic count (about 12%) occurs during the night hours from 23 hrs (11 PM) to 03 hrs (3.00 AM). Evidently, these results—computed based on the WIM automated station—suggest that different highways may have different hourly truck-traffic distribution patterns, which can be difficult to validate based on manual traffic counts. Among other reasons, the differences in the distribution patterns are attributed to the differences in the highway functional class, the associated truck activity type, highway geographical location, etc.
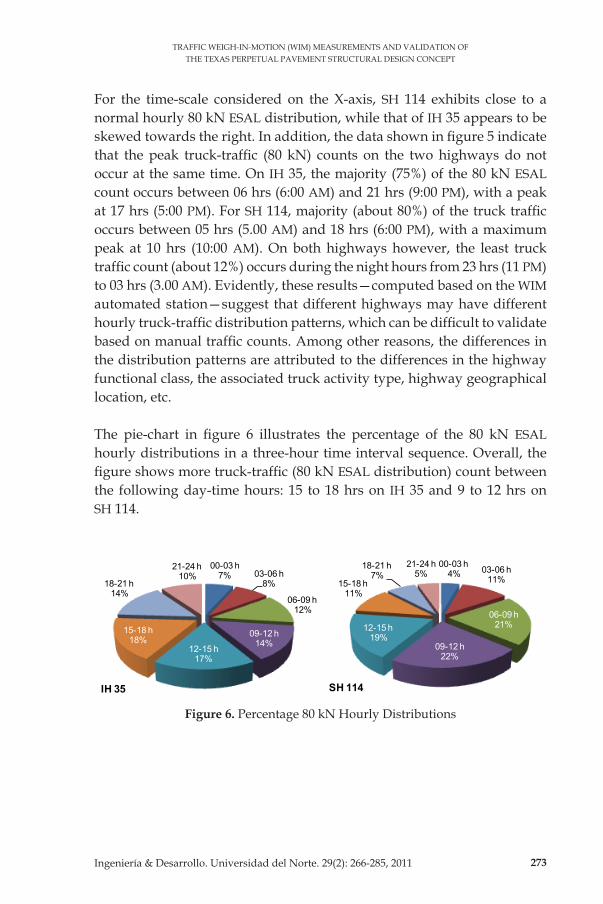
The pie-chart in figure 6 illustrates the percentage of the 80 kN ESAL hourly distributions in a three-hour time interval sequence. Overall, the figure shows more truck-traffic (80 kN ESAL distribution) count between the following day-time hours: 15 to 18 hrs on IH 35 and 9 to 12 hrs on SH 114.
00-03 h7% 03-06 h
8%
06-09 h12%
09-12 h14%12-15 h
17%
15-18 h18%
18-21 h14%
21-24 h10%
IH 35
00-03 h4% 03-06 h
11%
06-09 h21%
09-12 h22%
12-15 h19%
15-18 h11%
18-21 h7%
21-24 h5%
SH 114
Figure 6. Percentage 80 kn Hourly Distributions
Lubinda F. Walubita, Wenting Liu, Tom Scullion, Allex Eduardo Alvarez-Lugo, Yenis Margarita López-Esalas, Geoffrey Simate
274 Ingeniería & Desarrollo. Universidad del norte. 29(2): 266-285, 2011
Daily and monthly distributions of equivalent single axel loads (ESAL) of 80 kN
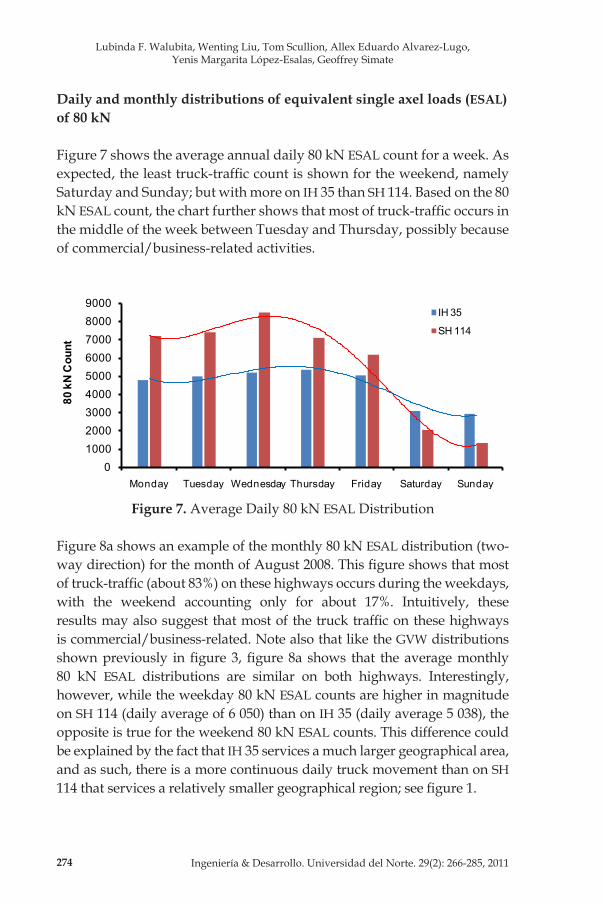
Figure 7 shows the average annual daily 80 kn ESAL count for a week. As expected, the least truck-traffic count is shown for the weekend, namely Saturday and Sunday; but with more on IH 35 than SH 114. Based on the 80 kn ESAL count, the chart further shows that most of truck-traffic occurs in the middle of the week between Tuesday and Thursday, possibly because of commercial/business-related activities.
0100020003000400050006000700080009000
Monday Tuesday Wednesday Thursday Friday Saturday Sunday
80 k
N C
ount
IH 35
SH 114
Figure 7. Average Daily 80 kn ESAL Distribution
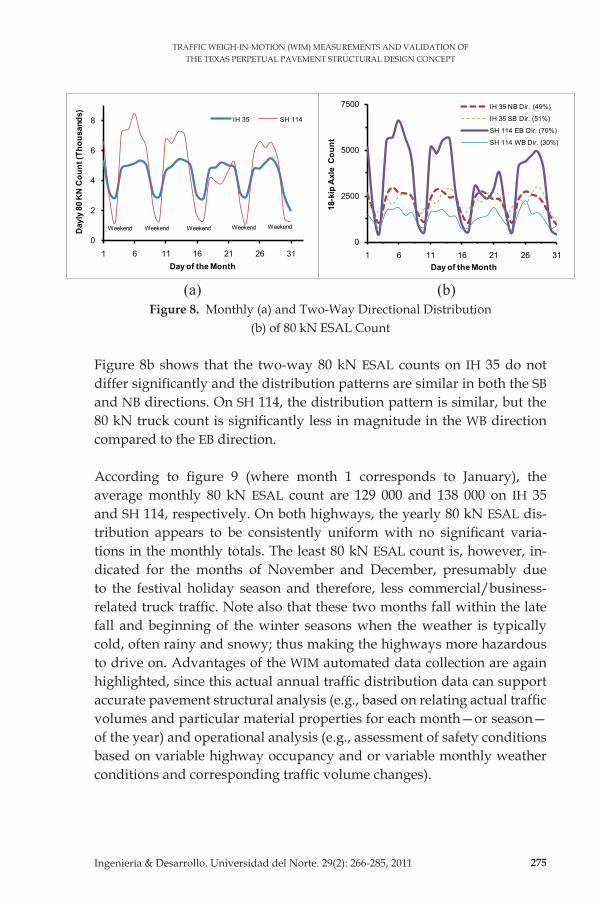
Figure 8a shows an example of the monthly 80 kn ESAL distribution (two-way direction) for the month of August 2008. This figure shows that most of truck-traffic (about 83%) on these highways occurs during the weekdays, with the weekend accounting only for about 17%. Intuitively, these results may also suggest that most of the truck traffic on these highways is commercial/business-related. note also that like the GVW distributions shown previously in figure 3, figure 8a shows that the average monthly 80 kn ESAL distributions are similar on both highways. Interestingly, however, while the weekday 80 kn ESAL counts are higher in magnitude on SH 114 (daily average of 6 050) than on IH 35 (daily average 5 038), the opposite is true for the weekend 80 kn ESAL counts. This difference could be explained by the fact that IH 35 services a much larger geographical area, and as such, there is a more continuous daily truck movement than on SH 114 that services a relatively smaller geographical region; see figure 1.
TrAFFIC WEIGH-In-MOTIOn (WIM) MEASUrEMEnTS AnD VALIDATIOn OF THE TEXAS PErPETUAL PAVEMEnT STrUCTUrAL DESIGn COnCEPT
275Ingeniería & Desarrollo. Universidad del norte. 29(2): 266-285, 2011
0
2
4
6
8
1 6 11 16 21 26 31
Day
ly 8
0 K
N C
ount
(Tho
usan
ds)
Day of the Month
IH 35 SH 114
Weekend Weekend Weekend Weekend Weekend
0
2500
5000
7500
1 6 11 16 21 26 31
18-k
ip A
xle
Cou
nt
Day of the Month
IH 35 NB Dir. (49%)
IH 35 SB Dir. (51%)
SH 114 EB Dir. (70%)
SH 114 WB Dir. (30%)
(a) (b)Figure 8. Monthly (a) and Two-Way Directional Distribution
(b) of 80 kn ESAL Count
Figure 8b shows that the two-way 80 kn ESAL counts on IH 35 do not differ significantly and the distribution patterns are similar in both the SB and nB directions. On SH 114, the distribution pattern is similar, but the 80 kN truck count is significantly less in magnitude in the WB direction compared to the EB direction.
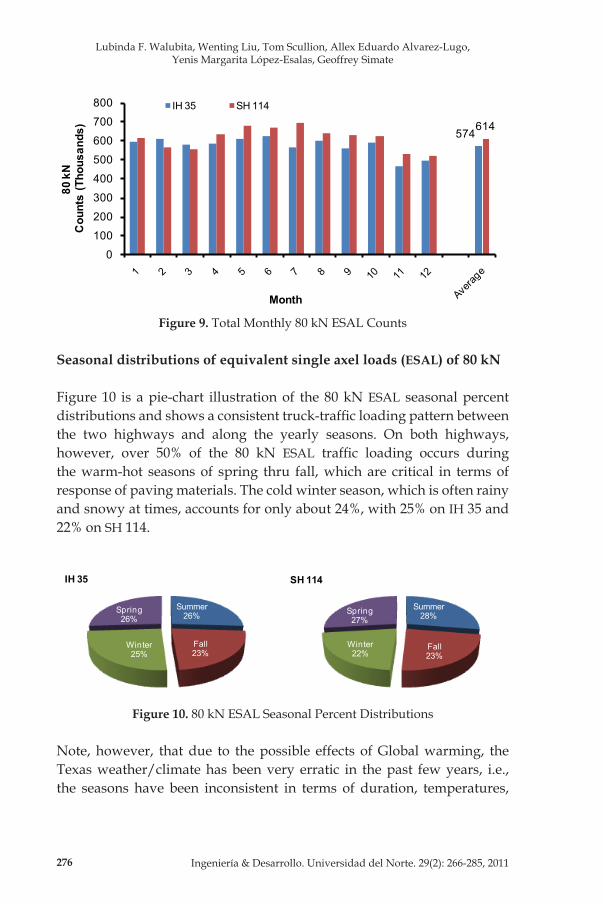
According to figure 9 (where month 1 corresponds to January), the average monthly 80 kn ESAL count are 129 000 and 138 000 on IH 35 and SH 114, respectively. On both highways, the yearly 80 kn ESAL dis-tribution appears to be consistently uniform with no significant varia-tions in the monthly totals. The least 80 kn ESAL count is, however, in-dicated for the months of november and December, presumably due to the festival holiday season and therefore, less commercial/business-related truck traffic. Note also that these two months fall within the late fall and beginning of the winter seasons when the weather is typically cold, often rainy and snowy; thus making the highways more hazardous to drive on. Advantages of the WIM automated data collection are again highlighted, since this actual annual traffic distribution data can support accurate pavement structural analysis (e.g., based on relating actual traffic volumes and particular material properties for each month—or season—of the year) and operational analysis (e.g., assessment of safety conditions based on variable highway occupancy and or variable monthly weather conditions and corresponding traffic volume changes).
Lubinda F. Walubita, Wenting Liu, Tom Scullion, Allex Eduardo Alvarez-Lugo, Yenis Margarita López-Esalas, Geoffrey Simate
276 Ingeniería & Desarrollo. Universidad del norte. 29(2): 266-285, 2011
574614
0
100
200
300
400
500
600
700
800
80 k
NC
ount
s (T
hous
ands
)
Month
IH 35 SH 114
Figure 9. Total Monthly 80 kn ESAL Counts
Seasonal distributions of equivalent single axel loads (ESAL) of 80 kN
Figure 10 is a pie-chart illustration of the 80 kn ESAL seasonal percent distributions and shows a consistent truck-traffic loading pattern between the two highways and along the yearly seasons. On both highways, however, over 50% of the 80 kn ESAL traffic loading occurs during the warm-hot seasons of spring thru fall, which are critical in terms of response of paving materials. The cold winter season, which is often rainy and snowy at times, accounts for only about 24%, with 25% on IH 35 and 22% on SH 114.
Summer26%
Fall23%
Winter25%
Spring26%
IH 35
Summer28%
Fall23%
Winter22%
Spring27%
SH 114
Figure 10. 80 kn ESAL Seasonal Percent Distributions
note, however, that due to the possible effects of Global warming, the Texas weather/climate has been very erratic in the past few years, i.e., the seasons have been inconsistent in terms of duration, temperatures,
TrAFFIC WEIGH-In-MOTIOn (WIM) MEASUrEMEnTS AnD VALIDATIOn OF THE TEXAS PErPETUAL PAVEMEnT STrUCTUrAL DESIGn COnCEPT
277Ingeniería & Desarrollo. Universidad del norte. 29(2): 266-285, 2011
rainfall, snow, etc. As such, there were limitations to accurately categorize the truck-traffic and 80 kN ESAL distributions as a function of the yearly seasons. Therefore, the values indicated in figure 10 should be interpreted with subjectivity.
Yearly axle-load distributions
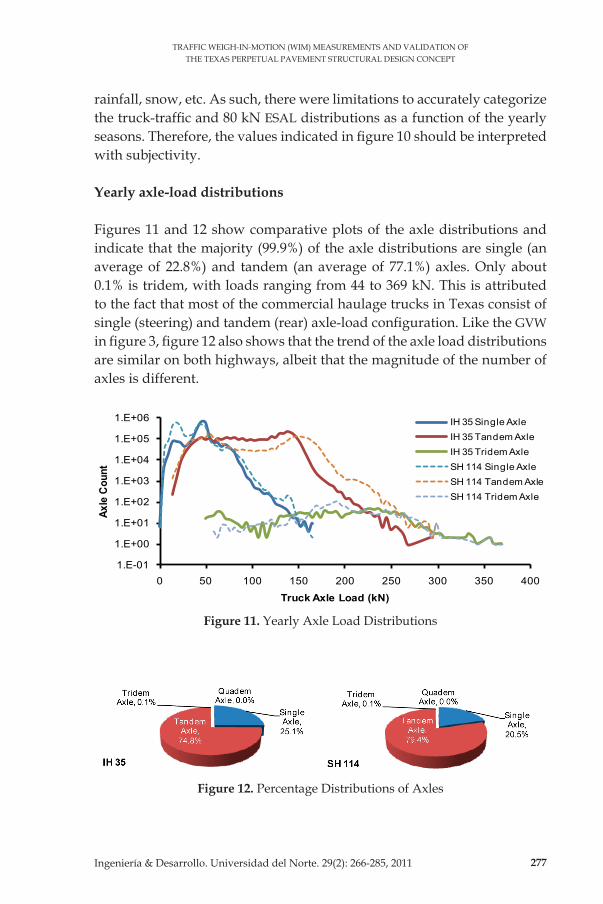
Figures 11 and 12 show comparative plots of the axle distributions and indicate that the majority (99.9%) of the axle distributions are single (an average of 22.8%) and tandem (an average of 77.1%) axles. Only about 0.1% is tridem, with loads ranging from 44 to 369 kn. This is attributed to the fact that most of the commercial haulage trucks in Texas consist of single (steering) and tandem (rear) axle-load configuration. Like the GVW in figure 3, figure 12 also shows that the trend of the axle load distributions are similar on both highways, albeit that the magnitude of the number of axles is different.
1.E-01
1.E+00
1.E+01
1.E+02
1.E+03
1.E+04
1.E+05
1.E+06
0 50 100 150 200 250 300 350 400
Axle
Cou
nt
Truck Axle Load (kN)
IH 35 Single AxleIH 35 Tandem AxleIH 35 Tridem AxleSH 114 Single AxleSH 114 Tandem AxleSH 114 Tridem Axle
Figure 11. Yearly Axle Load Distributions
Figure 12. Percentage Distributions of Axles
Lubinda F. Walubita, Wenting Liu, Tom Scullion, Allex Eduardo Alvarez-Lugo, Yenis Margarita López-Esalas, Geoffrey Simate
278 Ingeniería & Desarrollo. Universidad del norte. 29(2): 266-285, 2011
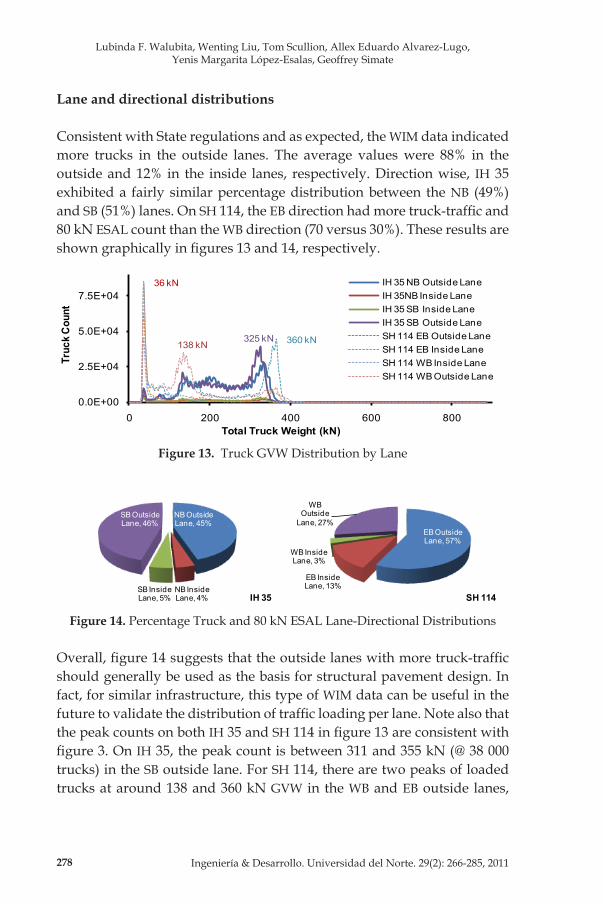
Lane and directional distributions
Consistent with State regulations and as expected, the WIM data indicated more trucks in the outside lanes. The average values were 88% in the outside and 12% in the inside lanes, respectively. Direction wise, IH 35 exhibited a fairly similar percentage distribution between the nB (49%) and SB (51%) lanes. On SH 114, the EB direction had more truck-traffic and 80 kn ESAL count than the WB direction (70 versus 30%). These results are shown graphically in figures 13 and 14, respectively.
325 kN 360 kN
36 kN
138 kN
0.0E+00
2.5E+04
5.0E+04
7.5E+04
0 200 400 600 800
Truc
k C
ount
Total Truck Weight (kN)
IH 35 NB Outside LaneIH 35NB Inside LaneIH 35 SB Inside LaneIH 35 SB Outside LaneSH 114 EB Outside LaneSH 114 EB Inside LaneSH 114 WB Inside LaneSH 114 WB Outside Lane
Figure 13. Truck GVW Distribution by Lane
NB Outside Lane, 45%
NB Inside Lane, 4%
SB Inside Lane, 5%
SB Outside Lane, 46%
IH 35
EB Outside Lane, 57%
EB Inside Lane, 13%
WB Inside Lane, 3%
WB Outside
Lane, 27%
SH 114
Figure 14. Percentage Truck and 80 kn ESAL Lane-Directional Distributions
Overall, figure 14 suggests that the outside lanes with more truck-traffic should generally be used as the basis for structural pavement design. In fact, for similar infrastructure, this type of WIM data can be useful in the future to validate the distribution of traffic loading per lane. Note also that the peak counts on both IH 35 and SH 114 in figure 13 are consistent with figure 3. On IH 35, the peak count is between 311 and 355 kn (@ 38 000 trucks) in the SB outside lane. For SH 114, there are two peaks of loaded trucks at around 138 and 360 kn GVW in the WB and EB outside lanes,
TrAFFIC WEIGH-In-MOTIOn (WIM) MEASUrEMEnTS AnD VALIDATIOn OF THE TEXAS PErPETUAL PAVEMEnT STrUCTUrAL DESIGn COnCEPT
279Ingeniería & Desarrollo. Universidad del norte. 29(2): 266-285, 2011
respectively. The maximum peak is, however, at 35 kn GVW with a truck count of about 85 000 in the WB outside lane; obviously unloaded trucks leaving the surround cities (i.e., roanoke) to join the main Interstate IH 35 for goods collection; see figure 1.
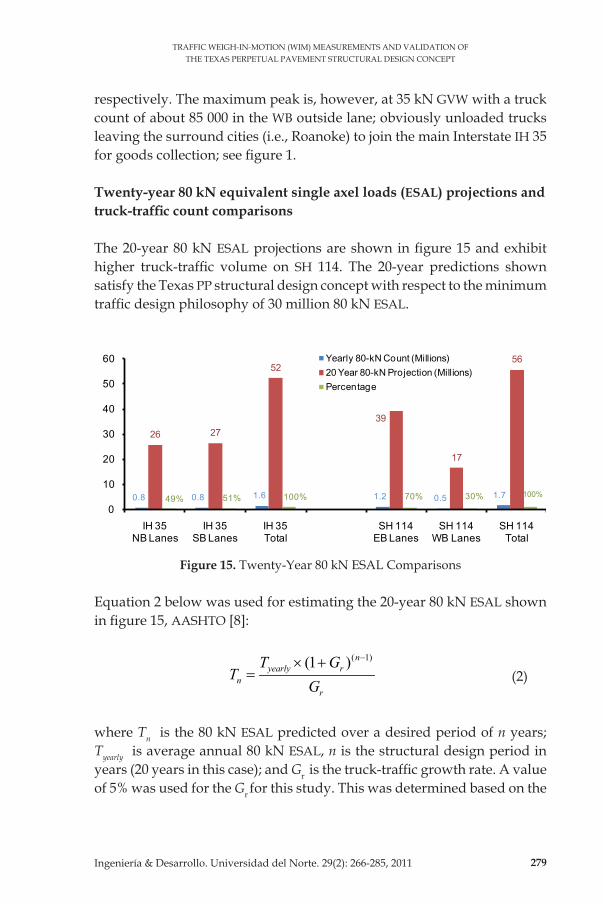
Twenty-year 80 kN equivalent single axel loads (ESAL) projections and truck-traffic count comparisons
The 20-year 80 kn ESAL projections are shown in figure 15 and exhibit higher truck-traffic volume on SH 114. The 20-year predictions shown satisfy the Texas PP structural design concept with respect to the minimum traffic design philosophy of 30 million 80 kN ESAL.
0.8 0.8 1.6 1.2 0.5 1.7
26 27
52
39
17
56
49% 51% 100% 70% 30% 100%
0
10
20
30
40
50
60
IH 35 NB Lanes
IH 35 SB Lanes
IH 35 Total
SH 114 EB Lanes
SH 114 WB Lanes
SH 114 Total
Yearly 80-kN Count (Millions)20 Year 80-kN Projection (Millions)Percentage
Figure 15. Twenty-Year 80 kn ESAL Comparisons
Equation 2 below was used for estimating the 20-year 80 kn ESAL shown in figure 15, AASHTO [8]:
( 1)(1 ) n
yearly rn
r
T GT
G
−× += (2)
where Tn is the 80 kn ESAL predicted over a desired period of n years; Tyearly is average annual 80 kn ESAL, n is the structural design period in years (20 years in this case); and Gr is the truck-traffic growth rate. A value of 5% was used for the Gr for this study. This was determined based on the
Lubinda F. Walubita, Wenting Liu, Tom Scullion, Allex Eduardo Alvarez-Lugo, Yenis Margarita López-Esalas, Geoffrey Simate
280 Ingeniería & Desarrollo. Universidad del norte. 29(2): 266-285, 2011
3-year traffic WIM data from the two highways under consideration instead of assuming the Gr default values—between 2.5 and 5%—recommended by AASHTO [8]. Future research can focus on conducting a sensitivity analysis using different Gr values.
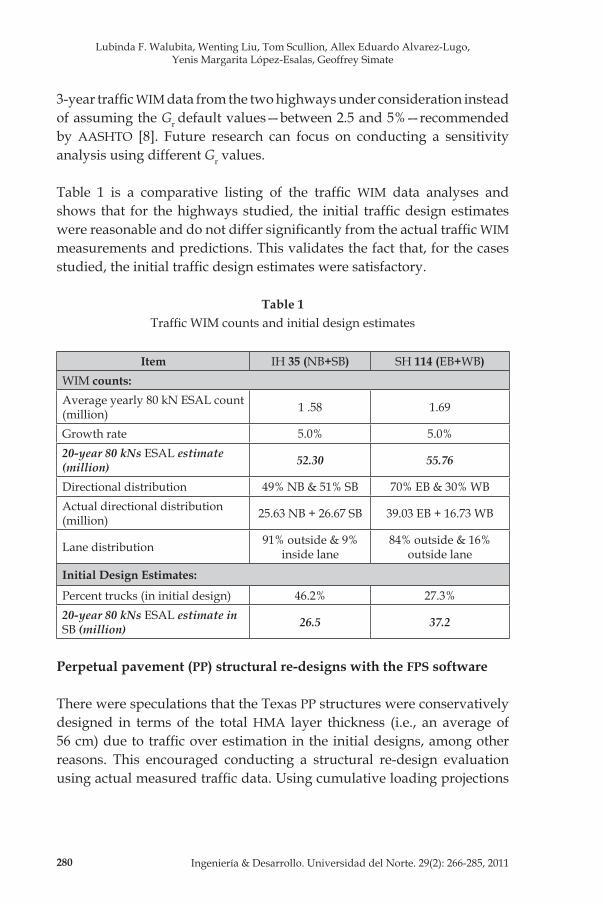
Table 1 is a comparative listing of the traffic WIM data analyses and shows that for the highways studied, the initial traffic design estimates were reasonable and do not differ significantly from the actual traffic WIM measurements and predictions. This validates the fact that, for the cases studied, the initial traffic design estimates were satisfactory.
Table 1Traffic WIM counts and initial design estimates
Item IH 35 (nB+SB) SH 114 (EB+WB)WIM counts:Average yearly 80 kn ESAL count (million) 1 .58 1.69
Growth rate 5.0% 5.0%20-year 80 kNs ESAL estimate (million) 52.30 55.76
Directional distribution 49% nB & 51% SB 70% EB & 30% WBActual directional distribution (million) 25.63 nB + 26.67 SB 39.03 EB + 16.73 WB
Lane distribution 91% outside & 9% inside lane
84% outside & 16% outside lane
Initial Design Estimates:
Percent trucks (in initial design) 46.2% 27.3%20-year 80 kNs ESAL estimate in SB (million) 26.5 37.2
Perpetual pavement (PP) structural re-designs with the FPS software
There were speculations that the Texas PP structures were conservatively designed in terms of the total HMA layer thickness (i.e., an average of 56 cm) due to traffic over estimation in the initial designs, among other reasons. This encouraged conducting a structural re-design evaluation using actual measured traffic data. Using cumulative loading projections
TrAFFIC WEIGH-In-MOTIOn (WIM) MEASUrEMEnTS AnD VALIDATIOn OF THE TEXAS PErPETUAL PAVEMEnT STrUCTUrAL DESIGn COnCEPT
281Ingeniería & Desarrollo. Universidad del norte. 29(2): 266-285, 2011
based on actual measured traffic WIM data and measured moduli values [3], the IH 35 (Laredo) and SH 114 (Fort Worth) PP sections were structurally re-designed using the Flexible Pavement System (FPS) software [4].
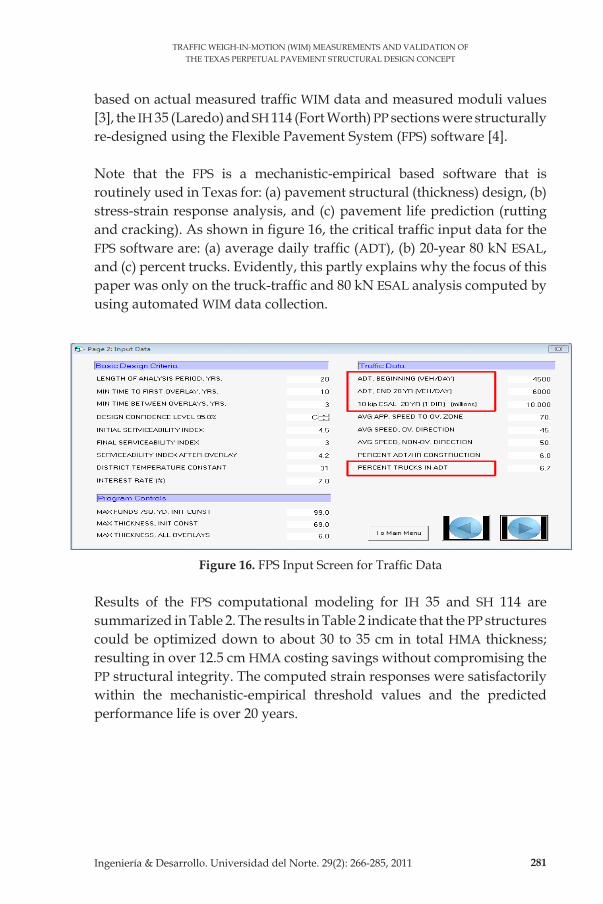
note that the FPS is a mechanistic-empirical based software that is routinely used in Texas for: (a) pavement structural (thickness) design, (b) stress-strain response analysis, and (c) pavement life prediction (rutting and cracking). As shown in figure 16, the critical traffic input data for the FPS software are: (a) average daily traffic (ADT), (b) 20-year 80 kn ESAL, and (c) percent trucks. Evidently, this partly explains why the focus of this paper was only on the truck-traffic and 80 kN ESAL analysis computed by using automated WIM data collection.
Figure 16. FPS Input Screen for Traffic Data
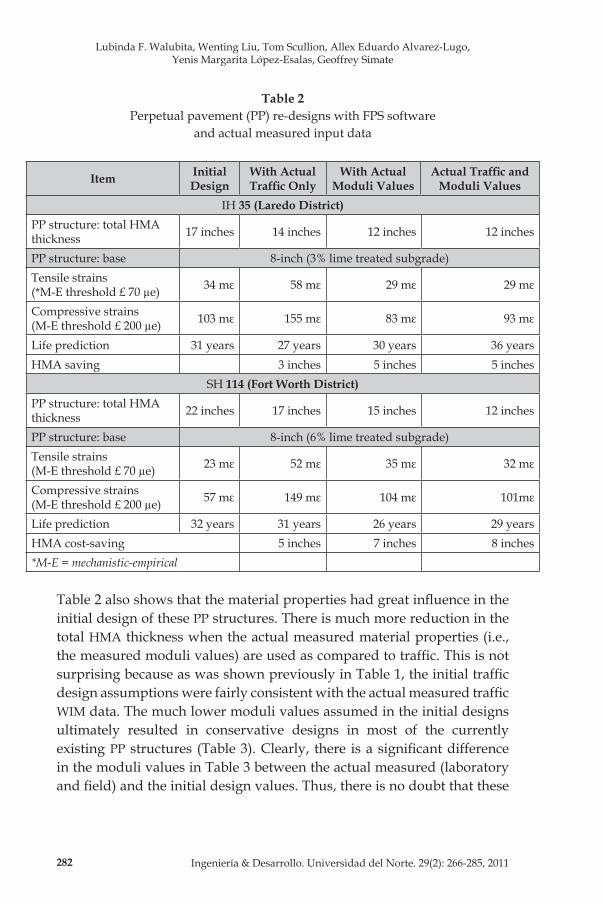
results of the FPS computational modeling for IH 35 and SH 114 are summarized in Table 2. The results in Table 2 indicate that the PP structures could be optimized down to about 30 to 35 cm in total HMA thickness; resulting in over 12.5 cm HMA costing savings without compromising the PP structural integrity. The computed strain responses were satisfactorily within the mechanistic-empirical threshold values and the predicted performance life is over 20 years.
Lubinda F. Walubita, Wenting Liu, Tom Scullion, Allex Eduardo Alvarez-Lugo, Yenis Margarita López-Esalas, Geoffrey Simate
282 Ingeniería & Desarrollo. Universidad del norte. 29(2): 266-285, 2011
Table 2Perpetual pavement (PP) re-designs with FPS software
and actual measured input data
Item Initial Design
With Actual Traffic Only
With Actual Moduli Values
Actual Traffic and Moduli Values
IH 35 (Laredo District)PP structure: total HMA thickness 17 inches 14 inches 12 inches 12 inches
PP structure: base 8-inch (3% lime treated subgrade)Tensile strains (*M-E threshold £ 70 µe) 34 mε 58 mε 29 mε 29 mε
Compressive strains (M-E threshold £ 200 µe) 103 mε 155 mε 83 mε 93 mε
Life prediction 31 years 27 years 30 years 36 yearsHMA saving 3 inches 5 inches 5 inches
SH 114 (Fort Worth District)PP structure: total HMA thickness 22 inches 17 inches 15 inches 12 inches
PP structure: base 8-inch (6% lime treated subgrade)Tensile strains (M-E threshold £ 70 µe) 23 mε 52 mε 35 mε 32 mε
Compressive strains (M-E threshold £ 200 µe) 57 mε 149 mε 104 mε 101mε
Life prediction 32 years 31 years 26 years 29 yearsHMA cost-saving 5 inches 7 inches 8 inches*M-E = mechanistic-empirical
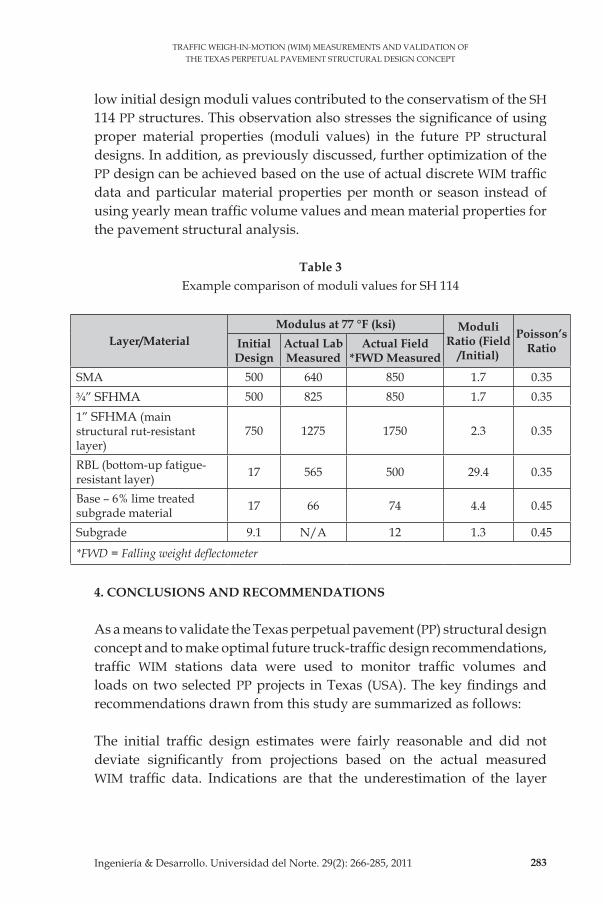
Table 2 also shows that the material properties had great influence in the initial design of these PP structures. There is much more reduction in the total HMA thickness when the actual measured material properties (i.e., the measured moduli values) are used as compared to traffic. This is not surprising because as was shown previously in Table 1, the initial traffic design assumptions were fairly consistent with the actual measured traffic WIM data. The much lower moduli values assumed in the initial designs ultimately resulted in conservative designs in most of the currently existing PP structures (Table 3). Clearly, there is a significant difference in the moduli values in Table 3 between the actual measured (laboratory and field) and the initial design values. Thus, there is no doubt that these
TrAFFIC WEIGH-In-MOTIOn (WIM) MEASUrEMEnTS AnD VALIDATIOn OF THE TEXAS PErPETUAL PAVEMEnT STrUCTUrAL DESIGn COnCEPT
283Ingeniería & Desarrollo. Universidad del norte. 29(2): 266-285, 2011
low initial design moduli values contributed to the conservatism of the SH 114 PP structures. This observation also stresses the significance of using proper material properties (moduli values) in the future PP structural designs. In addition, as previously discussed, further optimization of the PP design can be achieved based on the use of actual discrete WIM traffic data and particular material properties per month or season instead of using yearly mean traffic volume values and mean material properties for the pavement structural analysis.
Table 3Example comparison of moduli values for SH 114
Layer/MaterialModulus at 77 °F (ksi) Moduli
Ratio (Field /Initial)
Poisson’s RatioInitial
Design Actual Lab Measured
Actual Field *FWD Measured
SMA 500 640 850 1.7 0.35¾” SFHMA 500 825 850 1.7 0.351” SFHMA (main structural rut-resistant layer)
750 1275 1750 2.3 0.35
rBL (bottom-up fatigue-resistant layer) 17 565 500 29.4 0.35
Base – 6% lime treated subgrade material 17 66 74 4.4 0.45
Subgrade 9.1 n/A 12 1.3 0.45
*FWD = Falling weight deflectometer
4. CONCLUSIONS AND RECOMMENDATIONS
As a means to validate the Texas perpetual pavement (PP) structural design concept and to make optimal future truck-traffic design recommendations, traffic WIM stations data were used to monitor traffic volumes and loads on two selected PP projects in Texas (USA). The key findings and recommendations drawn from this study are summarized as follows:
The initial traffic design estimates were fairly reasonable and did not deviate significantly from projections based on the actual measured WIM traffic data. Indications are that the underestimation of the layer
Lubinda F. Walubita, Wenting Liu, Tom Scullion, Allex Eduardo Alvarez-Lugo, Yenis Margarita López-Esalas, Geoffrey Simate
284 Ingeniería & Desarrollo. Universidad del norte. 29(2): 266-285, 2011
moduli, particularly for the SFHMA- and rBL-HMA, is what resulted in conservative designs for these PP structures. The structural re-designed conducted showed potential of over 12.5 cm thick of HMA cost-savings.
Based on the particular assessment conducted for PP structures, the fol-lowing traffic data would be considered reasonable as guideline for the future Texas PP structures: (a) ADT ≥ 4 500, (b) 20year 80 kN ESALs = 25-50 million, and (c) traffic growth rate ≥ 5%. Provided appropriate material properties (i.e., design moduli values) are used, these proposed numbers should yield optimal PP structural designs. However, this is not to dis-count the need to estimate or measure the actual traffic design data for each specific highway project.
The use of automated WIM data stations in PP structures permitted the successful collection of traffic data and subsequent detailed analysis of traffic characteristics that included the: (a) truck-traffic distribution, (b) gross vehicle weight (GVW) distribution, (c) identification of overloading traffic, (d) single, tandem, and tridem axle distributions, and (e) 80 kN ESAL distributions (hourly, weekly, monthly, seasonal, and yearly). Appli cation and advantages (i.e., as compared to conventional manual collection of traffic data) of using this type of detailed WIM data in future highway operational and pavement structural analyses were highlighted in the paper. Additional research can allow further optimization of the PP design—and in general, optimization of the pavement structural design and highway operational analysis—based on the detailed traffic parameters captured by using the automated WIM data collection strategy.
Acknowledgements
The authors thank all those who helped during the course of this research work. In particular, special thanks are due to Bhaven n. Musonda and Charles Mushota (Estal Pride [Z] Ltd.) for their invaluable contributions to the paper.
Disclaimer
The contents of this paper reflect the views of the authors who are responsible for the facts and accuracy of the data presented herein and do not necessarily reflect the official views or policies of any agency or institute. This paper does not constitute a standard, specification, nor is it intended for design, construction,
TrAFFIC WEIGH-In-MOTIOn (WIM) MEASUrEMEnTS AnD VALIDATIOn OF THE TEXAS PErPETUAL PAVEMEnT STrUCTUrAL DESIGn COnCEPT
285Ingeniería & Desarrollo. Universidad del norte. 29(2): 266-285, 2011
bidding, contracting, tendering, or permit purposes. Trade names were used solely for information purposes and not for product endorsement.
REFERENCES
[1] B. Jacob and V. Feypell-de la Beaumelle, “Improving truck safety: Potential of weigh-in –motion technology,” in Elsevier, IATSS Research, 34, 2010, pp. 9 -15, France, 2010.
[2] TxDOT, “Memorandum on Full-depth Asphalt Pavements, Flexible Pavement Design Task Force Implementation,” Austin, Tech. Memo., 2001.
[3] L.F. Walubita et al., “Texas Perpetual Pavements - Experience Overview and the Way Forward,” TTI, Austin, Tech. rep. 0-4822-3, 2010.
[4] T. Scullion and W. Liu, “Flexible Pavement Design System FPS 19W: User’s Manual,” TTI, Austin, Tech. rep. 0-1869-1, 2001.
[5] TxDOT(year). Online Manuals (edition). Available: ftp://ftp.dot.state.tx.us/pub/txdot-info/cmd/mpl/brsqc.pdf
[6] Y.H. Huang, Pavement Analysis and Design. new Jersey: Prentice-Hall, 1993.[7] r. Cal y Mayor and J. Cardenas, Traffic Engineering. Fundamentals and applica-
tions, 8ht ed. Mexico, D. F.: Alfaomega publishing, 2007.[8] AASHTO. AASHTO 2002 Pavement Design Guide, 2010. Available: http://
www.2002designguide.com, http://www.trb.org/mepdg