análisis, caracterización y calibración de sensores de
TRANSCRIPT

Trabajo Fin de Grado
Escuela de Ingenierıa Industrial
Analisis, caracterizacion y
calibracion de sensores de bajo
coste para Arduino
Grado en Ingenierıa Electronica Industrial y Automatica
Universidad de La Laguna
Autor:Sawan Shadadpuri Goplani
Tutor: Sergio Elias Hernandez Alonso
Curso 2017/2018
Convocatoria de Septiembre

Agradecimientos
A mi tutor Sergio Helıas Hernandez, por ayudarme en todo lo posible y no
desistir en la ardua tarea que puede implicar tutorizarme.
A mi madre y mi padre, por ser un apoyo constante y escucharme siempre que
ha hecho falta.

Dedicatoria
A mi sobrino Arian Dos Santos Shadadpuri, que aun recien nacido, tiene cara
de entender todo lo que le digo.

Indice general
Indice I
Indice de figuras V
Indice de tablas IX
0. Objetivos y Estructura de la Memoria XII
0.1. Objetivos . . . . . . . . . . . . . . . . . . . . . . . . . . . . . . . XII
0.2. Estructura de la memoria . . . . . . . . . . . . . . . . . . . . . . XII
1. Introduccion 1
1.1. Sensores de bajo coste para Arduino . . . . . . . . . . . . . . . . 1
1.2. Herramientas y Equipos utilizados en los montajes experimentales 1
1.2.1. Arduino . . . . . . . . . . . . . . . . . . . . . . . . . . . . 1
1.2.2. MATLAB R2015a . . . . . . . . . . . . . . . . . . . . . . . 3
1.2.3. Mutımetro PROMAX PD-185 . . . . . . . . . . . . . . . . 4
1.2.4. Luxometro BENETECH GM010 . . . . . . . . . . . . . . 6
1.2.5. Editor de circuitos electronicos EasyEDA . . . . . . . . . . 7
2. Sensor de Temperatura KEYES KY-001 8
2.1. Principio de funcionamiento . . . . . . . . . . . . . . . . . . . . . 9
2.2. Resumen de las principales caracterısticas . . . . . . . . . . . . . 12
2.3. Metodo de Calibracion en Dos Puntos (Two Point Calibration)
para el Sensor de Temperatura KEYES KY-001 . . . . . . . . . . 12
2.3.1. Medicion en el punto triple del agua . . . . . . . . . . . . 13
2.3.2. Medicion en estado de ebullicion del agua . . . . . . . . . 15
2.4. Resultados . . . . . . . . . . . . . . . . . . . . . . . . . . . . . . . 16
I

2.4.1. Resultados para la medicion en el triple punto del agua . . 16
2.4.2. Resultados para la medicion en el punto de ebullicion . . . 17
2.4.3. Ajuste del valor de salida . . . . . . . . . . . . . . . . . . . 17
2.4.4. Discusion de los resultados . . . . . . . . . . . . . . . . . . 18
3. Sensor de Temperatura KEYES KY-013 19
3.1. Esquema electrico . . . . . . . . . . . . . . . . . . . . . . . . . . . 20
3.2. Principio de funcionamiento . . . . . . . . . . . . . . . . . . . . . 20
3.3. Resumen de las principales caracterısticas . . . . . . . . . . . . . 21
3.4. Metodo de Calibracion mediante el ajuste la ecuacion de SteinHart-
Hart para el sensor de Temperatura KEYES KY-013 . . . . . . . 22
3.4.1. caracterizacion del sensor de Temperatura KEYES KY-013 24
3.5. Resultados . . . . . . . . . . . . . . . . . . . . . . . . . . . . . . . 25
3.5.1. Obtencion de los parametros A, B y C de la ecuacion de
SteinHart-Hart para el sensor KEYES KY-013 . . . . . . . 25
3.5.2. Discusion de los resultados . . . . . . . . . . . . . . . . . . 29
4. Sensor de Temperatura KEYES KY-028 30
4.1. Principio de funcionamiento . . . . . . . . . . . . . . . . . . . . . 31
4.2. Resumen de las principales caracterısticas . . . . . . . . . . . . . 33
4.3. Metodo de Calibracion mediante el ajuste la ecuacion de SteinHart-
Hart para el sensor de Temperatura KEYES-KY028 . . . . . . . . 33
4.4. Resultados . . . . . . . . . . . . . . . . . . . . . . . . . . . . . . . 34
4.4.1. Obtencion de los parametros A, B y C de la ecuacion de
SteinHart Hart para el sensor KEYES KY-028 . . . . . . . 34
4.4.2. Discusion de los resultados . . . . . . . . . . . . . . . . . . 35
5. Sensor Fotoresistor KEYES KY-018 37
5.1. Principio de funcionamiento . . . . . . . . . . . . . . . . . . . . . 38
5.2. Resumen de las principales caracterısticas . . . . . . . . . . . . . 39
II

5.3. Metodo de Caracterizacion del sensor de luminiscencia KEYES
KY-018 mediante el Luxometro BENETECH GM010 . . . . . . . 39
5.4. Resultados . . . . . . . . . . . . . . . . . . . . . . . . . . . . . . . 40
5.4.1. Discusion de los resultados . . . . . . . . . . . . . . . . . . 42
6. Sensor de Ultrasonidos HC-SR04 43
6.1. Principio de funcionamiento . . . . . . . . . . . . . . . . . . . . . 44
6.2. Resumen de las principales caracterısticas . . . . . . . . . . . . . 46
6.3. Metodo de calibracion del Sensor de Ultrasonidos HC-SR04 . . . . 46
6.4. Resultados . . . . . . . . . . . . . . . . . . . . . . . . . . . . . . . 48
6.4.1. Recta de Calibracion . . . . . . . . . . . . . . . . . . . . . 48
6.4.2. Desviacion Tıpica . . . . . . . . . . . . . . . . . . . . . . . 48
6.4.3. Ajuste de la recta de calibracion . . . . . . . . . . . . . . . 49
6.4.4. Discusion de los resultados . . . . . . . . . . . . . . . . . . 51
7. Sensor de Humedad KEYES KY-015 52
7.1. Principio de funcionamiento . . . . . . . . . . . . . . . . . . . . . 53
7.2. Resumen de las principales caracterısticas . . . . . . . . . . . . . 54
7.3. Metodo de calibracion para el Sensor de Humedad KEYES KY-015
con soluciones sal-agua como generadores de humedad . . . . . . . 55
7.4. Resultados . . . . . . . . . . . . . . . . . . . . . . . . . . . . . . . 56
7.4.1. Ensayo en solucion de cloruro de magnesio . . . . . . . . . 56
7.4.2. Ensayo en solucion de cloruro de sodio . . . . . . . . . . . 57
7.4.3. Ajuste de la ecuacion de salida . . . . . . . . . . . . . . . 58
7.4.4. Discusion de los resultados . . . . . . . . . . . . . . . . . . 59
8. Sensor de Campo Magnetico KEYES KY-035 60
8.1. Principio de funcionamiento . . . . . . . . . . . . . . . . . . . . . 61
8.1.1. Efecto Hall . . . . . . . . . . . . . . . . . . . . . . . . . . 62
8.2. Resumen de las principales caracterısticas . . . . . . . . . . . . . 63
III

8.3. Metodo de Caracterizacion del Sensor de Campo Magnetico KE-
YES KY-035 . . . . . . . . . . . . . . . . . . . . . . . . . . . . . 63
8.4. Resultados . . . . . . . . . . . . . . . . . . . . . . . . . . . . . . . 64
8.4.1. Ecuacion Caracterıstica . . . . . . . . . . . . . . . . . . . 64
8.4.2. Nivel de OFFSET . . . . . . . . . . . . . . . . . . . . . . . 65
8.4.3. Fondos de escala . . . . . . . . . . . . . . . . . . . . . . . 66
8.4.4. Comprobacion y prueba de ajustes . . . . . . . . . . . . . 67
8.4.5. Discusion de los resultados . . . . . . . . . . . . . . . . . . 68
9. Conclusiones/Conclusions 69
9.1. Conclusiones . . . . . . . . . . . . . . . . . . . . . . . . . . . . . . 69
9.2. Conclusions . . . . . . . . . . . . . . . . . . . . . . . . . . . . . . 71
Bibliografıa 73
Anexos 78
A. Tablas de Datos complementarias 79
A.1. Tabla de datos para el Sensor de Ultrasonidos HC-SR04 . . . . . . 79
A.2. Tabla de datos recogidos para el Sensor Fotoresistor KEYES KY-018 87
B. Codigos 88
B.1. Codigo de MATLAB . . . . . . . . . . . . . . . . . . . . . . . . . 88
B.2. Codigos de ARDUINO . . . . . . . . . . . . . . . . . . . . . . . . 91
B.2.1. Codigo de Arduino para el Sensor de Temperatura KEYES
KY-001 . . . . . . . . . . . . . . . . . . . . . . . . . . . . 91
B.2.2. Codigo de Arduino para el Sensor de Temperatura KY-013 93
B.2.3. Codigo de Arduino para el Sensor de Temperatura KEYES
KY-028 . . . . . . . . . . . . . . . . . . . . . . . . . . . . 94
B.2.4. Codigo de Arduino para el Sensor Fotoresistor KEYES KY-
018 . . . . . . . . . . . . . . . . . . . . . . . . . . . . . . . 95
IV

B.2.5. Codigo de Arduino para el Sensor de Ultrasonidos HC-SR04 96
B.2.6. Codigo de Arduino para el Sensor de Humedad KEYES
KY-015 . . . . . . . . . . . . . . . . . . . . . . . . . . . . 98
B.2.7. Codigo de Arduino para el Sensor de Humedad KEYES
KY-035 . . . . . . . . . . . . . . . . . . . . . . . . . . . . 100
C. Hoja de especificaciones (Datasheet) de los sensores estudiados102
C.1. Datasheet del Sensor de Temperatura KEYES KY-001 (DS18B20) 103
C.2. Datasheet de los Termistores NTC utilizados en los Sensores de
Temperatura KEYES KY-013 y KEYES KY-028 . . . . . . . . . 124
C.3. Datasheet del Sensor de Ultrasonidos HC-SR04 . . . . . . . . . . 128
C.4. Datasheet de la del Sensor de Fotoresistor KEYES KY-018 (Foto-
resistencia) . . . . . . . . . . . . . . . . . . . . . . . . . . . . . . 132
C.5. Datasheet del sensor de Humedad KEYES KY-015 (DHT11) . . . 137
C.6. Datasheet del sensor de Campo Magnetico KEYES KY-035 (SS49E)146
V

Indice de figuras
1.1. ARDUINO UNO . . . . . . . . . . . . . . . . . . . . . . . . . . 2
1.2. MATLAB R2015a . . . . . . . . . . . . . . . . . . . . . . . . . 3
1.3. Multımetro PROMAX PD-185 . . . . . . . . . . . . . . . . . . 4
1.4. Luxometro digital BENETECH GM010 . . . . . . . . . . . . . 6
1.5. Logo EasyEDA . . . . . . . . . . . . . . . . . . . . . . . . . . . 7
2.1. Sensor de Temperatura KEYES KY-001 . . . . . . . . . . . . . 8
2.2. Esquema electrico de la PCB del Sensor de Temperatura KE-
YES KY-001 . . . . . . . . . . . . . . . . . . . . . . . . . . . . 9
2.3. Diagrama de bloques del Sensor de temperatura DS18B20 . . . 9
2.4. Configuracion simple y en paralelo de transistores BJT . . . . . 10
2.5. Esquema de circuito electronico Brokaw Cell . . . . . . . . . . 11
2.6. Medicion en el entorno del Triple Punto para calibracion en dos
puntos . . . . . . . . . . . . . . . . . . . . . . . . . . . . . . . 14
2.7. Medicion en el entorno de ebullicion para el metodo de calibra-
cion en dos puntos . . . . . . . . . . . . . . . . . . . . . . . . . 15
2.8. Grafica para la medicion de la temperatua en el entorno del
triple punto para el agua . . . . . . . . . . . . . . . . . . . . . 16
2.9. Grafica para la medicion de la temperatua en el entorno de
ebullicion del agua . . . . . . . . . . . . . . . . . . . . . . . . . 17
3.1. Sensor de Temperatura KEYES KY-013 . . . . . . . . . . . . . 19
3.2. Esquema electrico de la PCB del Sensor de Temperatura KE-
YES KY-013 . . . . . . . . . . . . . . . . . . . . . . . . . . . . 20
3.3. Configuracion modificada del esquema electrico del Sensor de
Temperatura KEYES KY-013 . . . . . . . . . . . . . . . . . . 21
3.4. Aislamiento del Sensor de Temperatura KEYES KY013 . . . . 23
VI

3.5. Calculadora online [21] de los parametros A, B y C de la ecua-
cion de Steinhart-Hart para el Sensor de Temperatura KEYES
KY-013 . . . . . . . . . . . . . . . . . . . . . . . . . . . . . . . 26
3.6. Voltaje de salida frente a Temperatura para el Sensor de Tem-
peratura KEYES KY-013 . . . . . . . . . . . . . . . . . . . . . 27
3.7. Potencia disipada por la resistencia RNTC del Sensor de Tem-
peratura KEYES KY-013 . . . . . . . . . . . . . . . . . . . . . 28
3.8. Prueba simultanea de los Sensores de Temperatura KEYES KY-
001 y KEYES KY-013 . . . . . . . . . . . . . . . . . . . . . . . 28
4.1. Sensor de Temperatura KEYES KY-028 . . . . . . . . . . . . . 30
4.2. Esquema electrico de la PCB del Sensor de Temperatura KE-
YES KY-028 . . . . . . . . . . . . . . . . . . . . . . . . . . . . 31
4.3. Calculadora online de los parametros A, B y C de la ecuacion de
Steinhart-Hart para el Sensor de Temperatura KEYES KY-028
[21] . . . . . . . . . . . . . . . . . . . . . . . . . . . . . . . . . 35
5.1. Sensor Fotoresistor KEYES KY-018 . . . . . . . . . . . . . . . 37
5.2. Esquema electrico de la PCB del Sensor Fotorresistor KEYES
KY-018 . . . . . . . . . . . . . . . . . . . . . . . . . . . . . . . 38
5.3. Configuracion modificada del esquema electrico del Sensor Fo-
toresistor KEYES KY-018 . . . . . . . . . . . . . . . . . . . . . 38
5.4. Disposicion conjunta de Sensor Fotoresistor KEYES KY-018 y
Luxometro BENETECH GM010 . . . . . . . . . . . . . . . . . 40
5.5. Luxes frente a voltaje del divisor de tension para el Sensor Fo-
toresistor KEYES KY-018 . . . . . . . . . . . . . . . . . . . . . 41
5.6. Herramienta de ajuste de curvas (Curve Fitting Tool) de MATLAB
para la obtencion de la ecuacion caracterıstica del sensor KE-
YES KY-018 . . . . . . . . . . . . . . . . . . . . . . . . . . . . 42
6.1. Sensor de Ultrasonidos HC-SR04 . . . . . . . . . . . . . . . . . 43
6.2. Esquema electrico de la PCB del Sensor de Ultrasonidos HC-SR04 44
VII

6.3. Principio de funcionamiento del Sensor de Ultrasonidos HC-SR04 45
6.4. Entorno de calibracion del Sensor de Ultrasonidos HC-SR04 . . 47
6.5. Recta de calibracion para el Sensor de Ultrasonidos HC-SR04 . 48
6.6. Desviacion Tıpica para el conjunto de muestras tomadas con el
Sensor de Ultrasonidos HC-SR04 . . . . . . . . . . . . . . . . . 49
6.7. Recta que relaciona la Medida Real (cm) con la obtenida por el
sensor de Ultrasonidos HC-SR04 . . . . . . . . . . . . . . . . . 50
6.8. Recta que relaciona la Medida Real (cm) con la obtenida por el
sensor de Ultrasonidos HC-SR04 . . . . . . . . . . . . . . . . . 50
7.1. Sensor de Humedad y Temperatura KEYES KY-015 . . . . . . 52
7.2. Esquema electrico de la PCB del Sensor de Humedad y Tempe-
ratura KEYES KY-015 . . . . . . . . . . . . . . . . . . . . . . 53
7.3. Modulo DHT11 del Sensor de Humedad y Temperatura KEYES
KY-015 . . . . . . . . . . . . . . . . . . . . . . . . . . . . . . . 53
7.4. Interior del Modulo DHT11 perteneciente al Sensor de Humedad
y Temperatura KEYES KY-015 . . . . . . . . . . . . . . . . . 54
7.5. Entorno de calibracion para dos puntos del Sensor de Humedad
KEYES KY-15 . . . . . . . . . . . . . . . . . . . . . . . . . . . 56
7.6. Grafica del nivel de Humedad Relativa presente en el entorno
de cloruro de magnesio . . . . . . . . . . . . . . . . . . . . . . 57
7.7. Grafica del nivel de Humedad Relativa presente en el entorno
de cloruro de sodio . . . . . . . . . . . . . . . . . . . . . . . . . 57
7.8. Grafica del nivel de humedad relativa ( %) teorico frente al re-
cogido por el Sensor de Humedad KEYES KY-015 . . . . . . . 58
7.9. Herramienta Curve Fitting Tool de MATLAB para la obtencion
de la ecuacion de la recta de calibracion del sensor KEYES KY-015 59
8.1. Sensor de Campo Magnetico KEYES KY-035 . . . . . . . . . . 60
8.2. Esquema electrico de la PCB del Sensor de Campo Magnetico
KEYES KY-035 . . . . . . . . . . . . . . . . . . . . . . . . . . 61
VIII

8.3. Efecto Hall sobre un conductor . . . . . . . . . . . . . . . . . . 62
8.4. Entorno de caracterizacion del Sensor de Campo Magnetico KE-
YES KY-035 . . . . . . . . . . . . . . . . . . . . . . . . . . . . 64
8.5. Herramienta (Curve Fitting Tool) de MATLAB para la genera-
cion de ecuaciones caracterısticas . . . . . . . . . . . . . . . . . 65
8.6. Recta teorica de calibracion del Sensor de Campo Magnetico
KEYES KY-035 con OFFSET real . . . . . . . . . . . . . . . . 66
8.7. Recta de calibracion real del Sensor de Campo Magnetico KE-
YES KY-035 . . . . . . . . . . . . . . . . . . . . . . . . . . . . 67
8.8. Prueba del Sensor de Campo Magnetico KEYES KY-035 . . . 67
IX
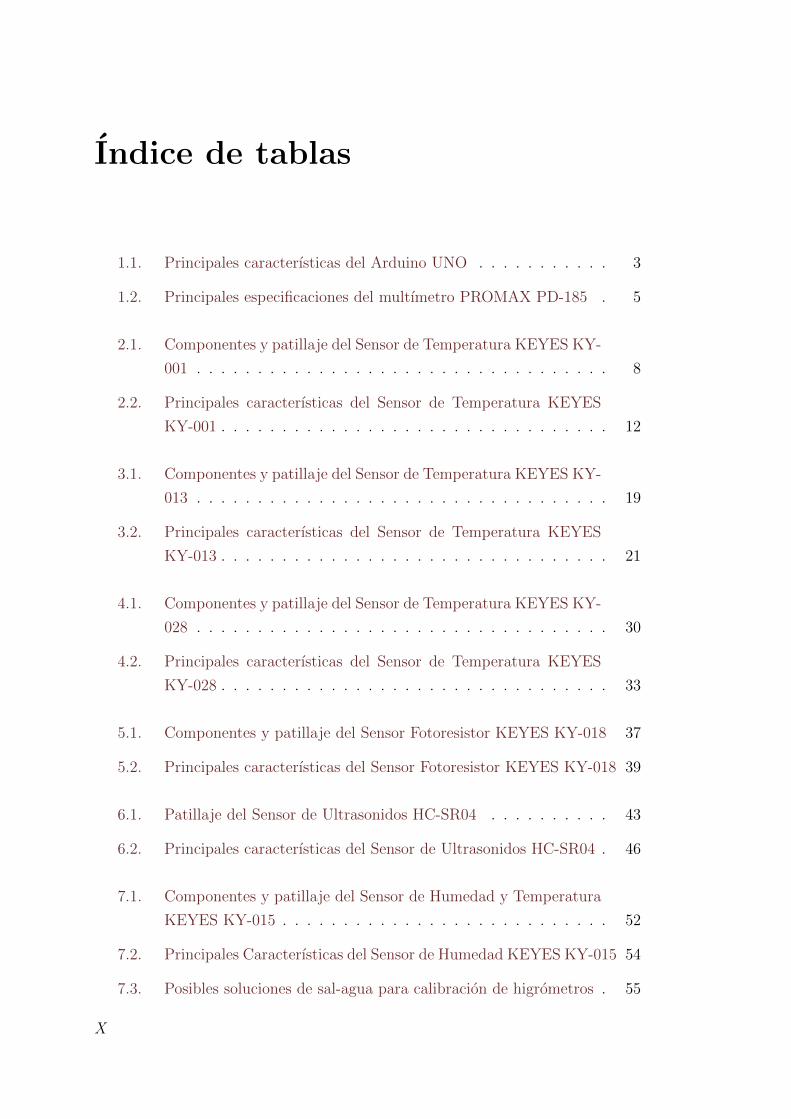
Indice de tablas
1.1. Principales caracterısticas del Arduino UNO . . . . . . . . . . . 3
1.2. Principales especificaciones del multımetro PROMAX PD-185 . 5
2.1. Componentes y patillaje del Sensor de Temperatura KEYES KY-
001 . . . . . . . . . . . . . . . . . . . . . . . . . . . . . . . . . . 8
2.2. Principales caracterısticas del Sensor de Temperatura KEYES
KY-001 . . . . . . . . . . . . . . . . . . . . . . . . . . . . . . . . 12
3.1. Componentes y patillaje del Sensor de Temperatura KEYES KY-
013 . . . . . . . . . . . . . . . . . . . . . . . . . . . . . . . . . . 19
3.2. Principales caracterısticas del Sensor de Temperatura KEYES
KY-013 . . . . . . . . . . . . . . . . . . . . . . . . . . . . . . . . 21
4.1. Componentes y patillaje del Sensor de Temperatura KEYES KY-
028 . . . . . . . . . . . . . . . . . . . . . . . . . . . . . . . . . . 30
4.2. Principales caracterısticas del Sensor de Temperatura KEYES
KY-028 . . . . . . . . . . . . . . . . . . . . . . . . . . . . . . . . 33
5.1. Componentes y patillaje del Sensor Fotoresistor KEYES KY-018 37
5.2. Principales caracterısticas del Sensor Fotoresistor KEYES KY-018 39
6.1. Patillaje del Sensor de Ultrasonidos HC-SR04 . . . . . . . . . . 43
6.2. Principales caracterısticas del Sensor de Ultrasonidos HC-SR04 . 46
7.1. Componentes y patillaje del Sensor de Humedad y Temperatura
KEYES KY-015 . . . . . . . . . . . . . . . . . . . . . . . . . . . 52
7.2. Principales Caracterısticas del Sensor de Humedad KEYES KY-015 54
7.3. Posibles soluciones de sal-agua para calibracion de higrometros . 55
X

8.1. Componentes y patillaje del Sensor de Campo Magnetico KEYES
KY-035 . . . . . . . . . . . . . . . . . . . . . . . . . . . . . . . . 60
8.2. Principales caracterısticas del Sensor de Campo Magnetico KE-
YES KY-035 . . . . . . . . . . . . . . . . . . . . . . . . . . . . . 63
9.1. Resumen de los principales procedimientos realizados con cada
sensor . . . . . . . . . . . . . . . . . . . . . . . . . . . . . . . . 70
9.2. Resume of the principal tasks developed with each sensor . . . . 71
A.1. Tabla con los datos recogidos para el Sensor de Ultrasonidos HC-
SR04 . . . . . . . . . . . . . . . . . . . . . . . . . . . . . . . . . 87
A.2. Tabla de datos obtenidos para el Sensor Fotoresistor KEYES
KY-018 . . . . . . . . . . . . . . . . . . . . . . . . . . . . . . . . 87
XI
CAPITULO 0. OBJETIVOS Y ESTRUCTURA DE LA MEMORIA
0. Objetivos y Estructura de la Me-
moria
0.1. Objetivos
En el presente Trabajo Fin de Grado se han tratado de alcanzar los siguientes
objetivos:
Analisis de las principales especificaciones tecnicas de varios sensores.
Busqueda y adaptacion de los codigos de programacion para Arduino.
Dibujo de esquemas electricos.
Calibracion/caracterizacion de los diferentes sensores.
Desarrollo de diferentes tareas de programacion y procesamiento de datos
en el sofware MATLAB.
0.2. Estructura de la memoria
La memoria se ha estructurado de la siguiente manera:
En primer lugar encontramos un capıtulo de introduccion, en el cual se pone
en situacion al lector sobre el entorno que rodea al trabajo en cuestion.
Tambien se da una descripcion de las herramientas utilizadas.
Tras el capitulo de introduccion encontramos un capıtulo para cada sen-
sor (un total de 7 sensores). Estos capıtulos siguen en lıneas generales la
siguiente estructura de 7 puntos:
1. Pequena descripcion del sensor y sus principales caracterısticas.
2. Imagen del sensor, acompanada de una tabla con los principales com-
ponentes.
XII

CAPITULO 0. OBJETIVOS Y ESTRUCTURA DE LA MEMORIA
3. Esquema electrico que presenta la placa PCB del sensor.
4. Principio fısico de funcionamiento.
5. Tabla resumen de las principales especificaciones aportadas por el fa-
bricante.
6. Metodologıas utilizadas para el analisis, caracterizacion y calibracion
del sensor.
7. Resultados de las pruebas y ensayos realizados.
Una vez analizados todos los sensores, encontramos el capıtulo de las con-
clusiones, donde se tendra una vision mas global de las tareas desarrolladas.
Por ultimo encontramos los anexos, que estan divididos en 3 apartados
principales:
Anexo A (Tablas de datos complementarias): En este apartado encon-
tramos las tablas de los datos recogidos para el Sensor de Ultrasonidos
HC-SR04 y para el Sensor Fotoresistor KEYES KY-018.
Anexo B (Codigos): En primer lugar se tiene el codigo desarrollado en
el entorno de MATLAB, para la recogida de datos por puerto serie.
En segundo lugar encontramos el codigo de Arduino para cada sensor.
Anexo C (Hojas de especificaciones): En este apartado se han dispuesto
todas las hojas de especificaciones de los sensores estudiados.
XIII

CAPITULO 1. INTRODUCCION
1. Introduccion
1.1. Sensores de bajo coste para Arduino
La plataforma de software libre Arduino es conocida por ser una de las em-
presas lıderes en creacion de placas con micro-controladores de bajo coste. Su
incursion en el mercado fue una revolucion, pues su precio (entre 10ey 30e) era
mucho menor que el de los presentes en ese momento (en muchos casos superior
a 100e). Asociado al crecimiento y aumento del uso de estos dispositivos, apare-
cen en el mercado diversos sensores de bajo coste con multiples aplicaciones para
satisfacer la demanda emergente.
Concretamente, los sensores analizados en esta memoria pertenecen en su
mayorıa a un KIT de 37 elementos (entre sensores y actuadores) adquirido por
Internet a un precio de 12e. ([1]).
Estos sensores, al ser de bajo coste, no cuentan con unas especificaciones tecni-
cas con suficiente amplitud de detalles y carecen en muchos casos, de estudios de
calibracion o caracterizacion que puedan garantizar su correcto funcionamiento.
Ası, tras observar esta situacion, surge la propuesta de TFG con el objetivo de
analizar, caracterizar y calibrar varios de estos sensores probados en la plataforma
Arduino.
1.2. Herramientas y Equipos utilizados en los
montajes experimentales
1.2.1. Arduino
Arduino fue inventado en el ano 2005 por el entonces estudiante del instituto
IVRAE Massimo Banzi, quien, en un principio, pensaba en hacer ARDUINO por
una necesidad de aprendizaje para los estudiantes de computacion y electronica
del mismo instituto, ya que en ese entonces, adquirir una placa de micro contro-
ladores eran bastante caro y no ofrecıan el soporte adecuado; no obstante, nunca
1

CAPITULO 1. INTRODUCCION
se imagino que esta herramienta se llegarıa a convertir en anos mas adelante en
el lıder mundial de tecnologıas DIY (Do It Yourself).
En este trabajo se ha utilizado la placa Arduino UNO (figura 1.1).
Figura 1.1: ARDUINO UNO
1.2.1.1. Arduino UNO
A continuacion se deja una breve descripcion:
Placa con un microcontrolador de la marca Atmel ([2]) y con toda la circuiterıa
de soporte, que incluye, reguladores de tension, un puerto USB (En los ultimos
modelos, aunque el original utilizaba un puerto serie) conectado a un modulo
adaptador USB-Serie que permite programar el microcontrolador desde cualquier
PC de manera comoda y tambien hacer pruebas de comunicacion con el propio
chip.
El Arduino UNO (ver tabla 1.1) dispone de 14 pines que pueden configurarse
como entrada o salida digital, y a los que puede conectarse cualquier dispositivo
que sea capaz de transmitir o recibir senales de 0 y 5 V. Tambien dispone de 6
entradas y salidas analogicas. Mediante las entradas analogicas podemos obtener
datos de sensores en forma de variaciones continuas de un voltaje. Para trabajar
con senales dichas analogicas, cuenta con un CAD (Convertidor Analogico/Digi-
tal) de 10 Bits
2

CAPITULO 1. INTRODUCCION
Tabla 1.1: Principales caracterısticas del Arduino UNO
MICROCONTROLADOR ATMEGA328
VOLTAJE DE OPERACION 5V
VOLTAJE DE ENTRADA
RECOMENDADO7V A 12V
VOLTAJE DE ENTRADA
LIMITE6V A 20V
PINES PARA
ENTRADA/SALIDA DIGITAL
14
(6 POSIBLE COMO PWM)
PINES DE ENTRADA
ANALOGICA6
CORRIENTE CONTINUA
POR PIN I/O40mA
CORRIENTE CONTINUA
EN EL PIN 3.3V50mA
MEMORIA FLASH32KB
(0.5 KB para el Bootloader)
SRAM 2KB
EEPROM 1KB
FRECUENCIA DE RELOJ 16MHz
1.2.2. MATLAB R2015a
Figura 1.2: MATLAB R2015a
MATLAB (abreviatura de MATrix LABoratory (laboratorio de matrices) es
una herramienta de software matematico que ofrece un entorno de desarrollo inte-
3

CAPITULO 1. INTRODUCCION
grado (IDE Integrated Development Environment ) con un lenguaje de programa-
cion propio (lenguaje M). Esta disponible para las plataformas Unix, Windows,
Mac OS X y GNU/Linux ([3]).
Entre sus prestaciones basicas se hallan: la manipulacion de matrices, la re-
presentacion de datos y funciones, la implementacion de algoritmos, la creacion
de interfaces de usuario (GUI) y la comunicacion con programas en otros len-
guajes y con otros dispositivos hardware. El paquete MATLAB dispone de dos
herramientas adicionales que expanden sus prestaciones, a saber, Simulink (pla-
taforma de simulacion multidominio) y GUIDE (editor de interfaces de usuario
- GUI). Ademas, se pueden ampliar las capacidades de MATLAB con las ca-
jas de herramientas (toolboxes); y las de Simulink con los paquetes de bloques
(blocksets).
Es un software muy usado en universidades y centros de investigacion y desa-
rrollo. En los ultimos anos ha aumentado el numero de prestaciones, como la de
programar directamente procesadores digitales de senal o crear codigo VHDL.
Para este proyecto, los principales usos que se le dara a esta herramienta son:
Creacion de un codigo para la recogida de datos por puerto serie proveniente
de la placa Arduino UNO. Dicho codigo es generico y se utiliza para todos
los sensores, aunque se ha de modificar segun el numero de variables que se
quiera leer (anexo B.1).
Generacion de graficas a partir de los datos almacenados
Uso de las herramientas de ajuste de curvas (Curve Fitting Tool)
1.2.3. Mutımetro PROMAX PD-185
Figura 1.3: Multımetro PROMAX PD-185
4

CAPITULO 1. INTRODUCCION
El multımetro digital PD-185 [4] reune las caracterısticas basicas de un ins-
trumento profesional, tales como alta precision, fiabilidad y una amplia escala
de medidas. El sistema de visualizacion con una pantalla LCD de gran tamano,
ası como facil manejo, permite su uso tanto en laboratorios como en cadenas de
produccion. Su fiabilidad de uso tambien los hace muy indicados para actividades
educativas (especificaciones en tabla 1.2).
Tabla 1.2: Principales especificaciones del multımetro PROMAX PD-185
VISUALIZACION 33/4 dıgitos (4000 cuentas)
RESOLUCION VDC
ESCALA(MIN/MAX)
400mV/1000V
100 µV/1V
PRECISION VDC
ESCALA 400mV/1000V±(0,1 % lect + 2 dıg)
RESOLUCION VAC
ESCALA(MIN/MAX)
400mV/750V
100 µV/1V
PRECISION VAC
ESCALA 400mV/750V±(1,2 % lect + 5 dıg)
RESOLUCION IDC
ESCALA(MIN/MAX)
400µA/20A
0,1µA/10mA
PRECISION IDC
ESCALA 400µA/20A
±(1,0 % lect + 1 dıg)/
±(2,0 % lect + 3 dıg)
RESOLUCION IAC
ESCALA(MIN/MAX)
400µA/20A
0,1µA/10mA
PRECISION IAC
ESCALA 400µA/20A
±(1,5 % lect + 4 dıg)/
±(2,5 % lect + 4 dıg)
RESOLUCION RESISTENCIA
ESCALA(MIN/MAX)
400Ω/40MΩ
0.1Ω/10KΩ
PRECISION RESISTENCIA
ESCALA 400Ω/40MΩ
±(0,5 % lect + 4 dıg)/
±(1,5 % lect + 4 dıg)
La precision en la tabla 1.2 se expresa como ± ([ % de lectura] + [numero del
dıgito menos significativos]).
5
CAPITULO 1. INTRODUCCION
Principales usos del multımetro en este proyecto:
Analisis y obtencion de los circuitos presentes en las PCB de los sensores.
Comprobacion de las tensiones de entrada y salida de los sensores.
Medicion y obtencion de datos de los diferentes elementos montados en las
PCB.
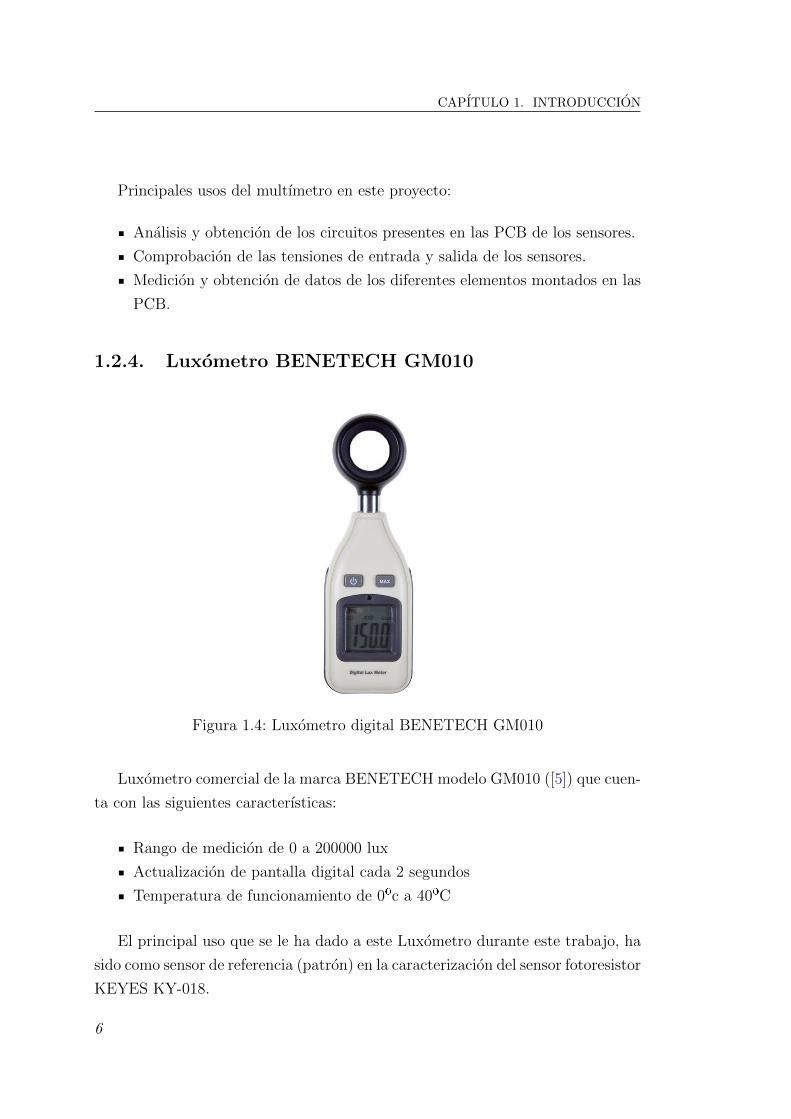
1.2.4. Luxometro BENETECH GM010
Figura 1.4: Luxometro digital BENETECH GM010
Luxometro comercial de la marca BENETECH modelo GM010 ([5]) que cuen-
ta con las siguientes caracterısticas:
Rango de medicion de 0 a 200000 lux
Actualizacion de pantalla digital cada 2 segundos
Temperatura de funcionamiento de 0ºc a 40ºC
El principal uso que se le ha dado a este Luxometro durante este trabajo, ha
sido como sensor de referencia (patron) en la caracterizacion del sensor fotoresistor
KEYES KY-018.
6
CAPITULO 1. INTRODUCCION
1.2.5. Editor de circuitos electronicos EasyEDA
Figura 1.5: Logo EasyEDA
EasyEDA [6] es una herramienta de diseno de esquemas electricos asistida
por ordenador. No requiere de instalacion pues se ejecuta desde el navegador
web. Permite ademas realizar simulaciones con circuitos analogicos o digitales.
Una gran ventaja de este software es que permite la exportacion de los esquemas
creados a multiples formatos (.pdf, .png, etc). El principal uso que se le ha dado a
esta herramienta es para general los esquemas electricos de los diferentes sensores
estudiados en esta memoria.
7

CAPITULO 2. SENSOR DE TEMPERATURA KEYES KY-001
2. Sensor de Temperatura KEYES
KY-001
El sensor KEYES KY-001 es capaz de medir la temperatura del entorno que
lo rodea, y generar un dato digital mediante el protocolo OneWire[7] conteniendo
dicho valor. Basa su funcionamiento en el sensor DS18B20 (elemento numero 1 de
la figura 2.1) [8] [9].El rango de temperaturas medibles por el sensor es de -10ºC
a 80ºC, con una precision de al menos ± 0.5ºC. La resolucion del valor de salida
del sensor es ajustable entre 9 y 12 bits (0.5V a 0.0625V), teniendo en cuenta que
a mayor resolucion, mayor sera el tiempo de respuesta del dispositivo (93.75ms a
750ms). Para mas informacion (anexo C.1 y tabla 2.2).
Figura 2.1: Sensor de Temperatura KEYES KY-001
Tabla 2.1: Componentes y patillaje del Sensor de Temperatura KEYES KY-001
NUMERO DE
IDENTIFICACIONDESCRIPCION DEL ELEMENTO
1 Sensor de Temperatura DS18B20 con un encapsulado tipo TO92
2 Resistencia de 1KΩ
3 Diodo Led
4 Patilla ”− ” ⇒ Tierra (GND)
5 Patilla central ⇒ Alimentacion (VCC)
6 Patilla ”S” ⇒ Cable de Datos (BUS OneWire)
Esquema electrico del sensor realizado mediante la ayuda del multımetro Pro-
8

CAPITULO 2. SENSOR DE TEMPERATURA KEYES KY-001
max PD-185 y la herramienta de diseno de circuitos en lınea EasyEda [6]:
A A
B B
C C
D D
1
1
2
2
3
3
4
4
5
5
TITLE:
New Schematic REV: 1.0
Date: 2018-08-22 Sheet: 1/1
EasyEDA V5.4.11 Drawn By: sawan.sgg
DS18B20
VD
D1
SIG
NA
L2
GN
D3
1kR1
LEDVCC SIGNAL
Figura 2.2: Esquema electrico de la PCB del Sensor de Temperatura KEYESKY-001
2.1. Principio de funcionamiento
El Sensor KEYES KY-001 basa la medicion de la temperatura en el encapsu-
lado sensor DS18B20. A continuacion se muestra un diagrama interno de funcio-
namiento del DS18B20:
Figura 2.3: Diagrama de bloques del Sensor de temperatura DS18B20
Como se puede observar, el DS18B20 contiene en su interior un sensor analogi-
9
CAPITULO 2. SENSOR DE TEMPERATURA KEYES KY-001
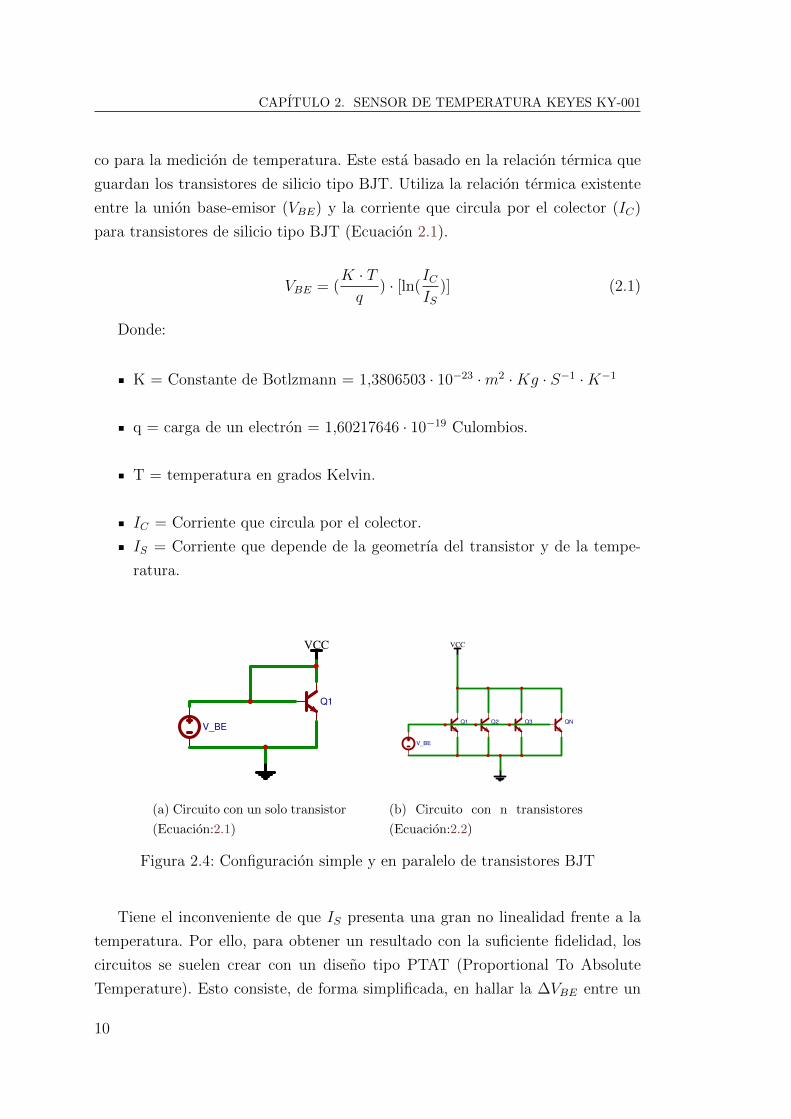
co para la medicion de temperatura. Este esta basado en la relacion termica que
guardan los transistores de silicio tipo BJT. Utiliza la relacion termica existente
entre la union base-emisor (VBE) y la corriente que circula por el colector (IC)
para transistores de silicio tipo BJT (Ecuacion 2.1).
VBE = (K · Tq
) · [ln(ICIS
)] (2.1)
Donde:
K = Constante de Botlzmann = 1,3806503 · 10−23 ·m2 ·Kg · S−1 ·K−1
q = carga de un electron = 1,60217646 · 10−19 Culombios.
T = temperatura en grados Kelvin.
IC = Corriente que circula por el colector.
IS = Corriente que depende de la geometrıa del transistor y de la tempe-
ratura.
A A
B B
C C
D D
1
1
2
2
3
3
4
4
5
5
TITLE:
New Schematic REV: 1.0
Date: 2018-08-26 Sheet: 1/1
EasyEDA V5.7.19 Drawn By: Your Name
Q1
VCC
V_BE
(a) Circuito con un solo transistor
(Ecuacion:2.1)
A A
B B
C C
D D
1
1
2
2
3
3
4
4
5
5
TITLE:
New Schematic REV: 1.0
Date: 2018-08-26 Sheet: 1/1
EasyEDA V5.7.19 Drawn By: Your Name
QNQ3Q2Q1
V_BE
VCC
(b) Circuito con n transistores
(Ecuacion:2.2)
Figura 2.4: Configuracion simple y en paralelo de transistores BJT
Tiene el inconveniente de que IS presenta una gran no linealidad frente a la
temperatura. Por ello, para obtener un resultado con la suficiente fidelidad, los
circuitos se suelen crear con un diseno tipo PTAT (Proportional To Absolute
Temperature). Esto consiste, de forma simplificada, en hallar la ∆VBE entre un
10
CAPITULO 2. SENSOR DE TEMPERATURA KEYES KY-001
transistor BJT (Q1) y varios transistores BJT dispuestos en paralelo (Qn) (Ver
figura 2.4). Con esto se consigue obtener un voltaje proporcional a la temperatura,
independiente de los valores de IS e IC .
VN = (K · Tq
) · [ln(ICn · IS
)] (2.2)
Hallando la variacion:
∆VBE = VBE − VN = T · K · ln(n)
q(2.3)
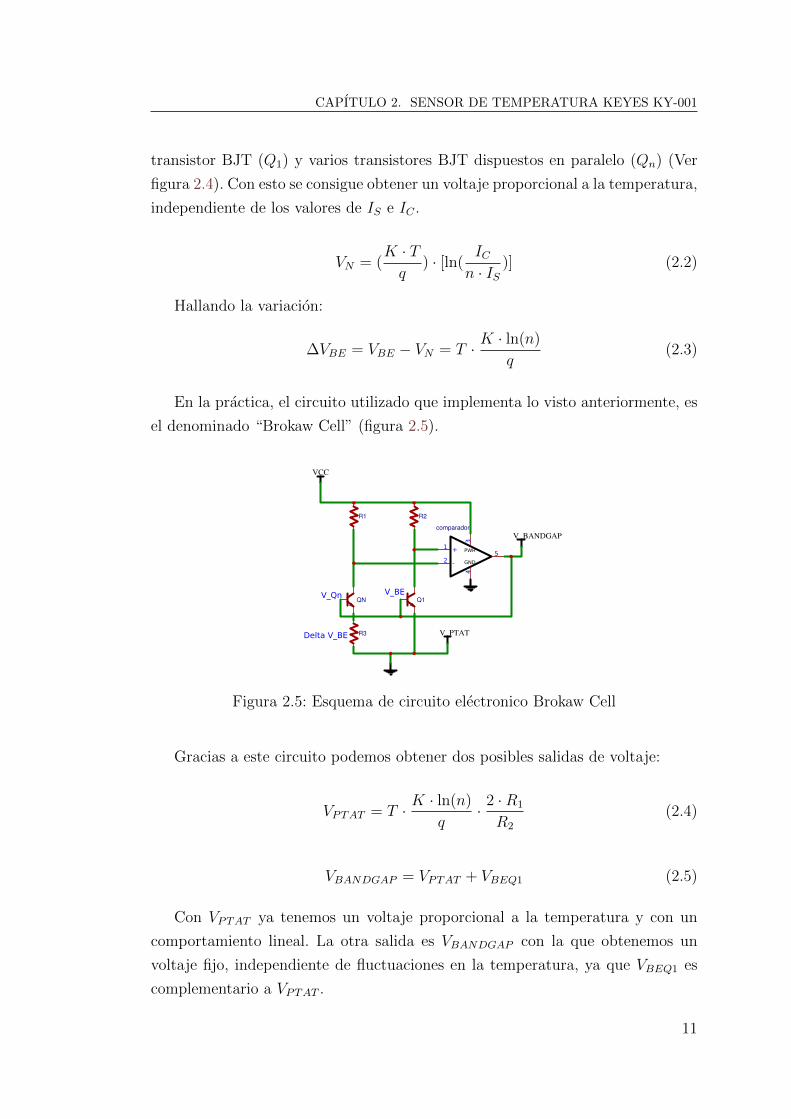
En la practica, el circuito utilizado que implementa lo visto anteriormente, es
el denominado “Brokaw Cell” (figura 2.5).
A A
B B
C C
D D
1
1
2
2
3
3
4
4
5
5
TITLE:
New Schematic REV: 1.0
Date: 2018-08-26 Sheet: 1/1
EasyEDA V5.7.19 Drawn By: Your Name
R1 R2
R3
Q1QN
V_PTAT
V_BANDGAPcomparador
+1
-2
34
PWR
GND
5
VCC
V_Qn V_BE
Delta V_BE
Figura 2.5: Esquema de circuito electronico Brokaw Cell
Gracias a este circuito podemos obtener dos posibles salidas de voltaje:
VPTAT = T · K · ln(n)
q· 2 ·R1
R2
(2.4)
VBANDGAP = VPTAT + VBEQ1 (2.5)
Con VPTAT ya tenemos un voltaje proporcional a la temperatura y con un
comportamiento lineal. La otra salida es VBANDGAP con la que obtenemos un
voltaje fijo, independiente de fluctuaciones en la temperatura, ya que VBEQ1 es
complementario a VPTAT .
11
CAPITULO 2. SENSOR DE TEMPERATURA KEYES KY-001
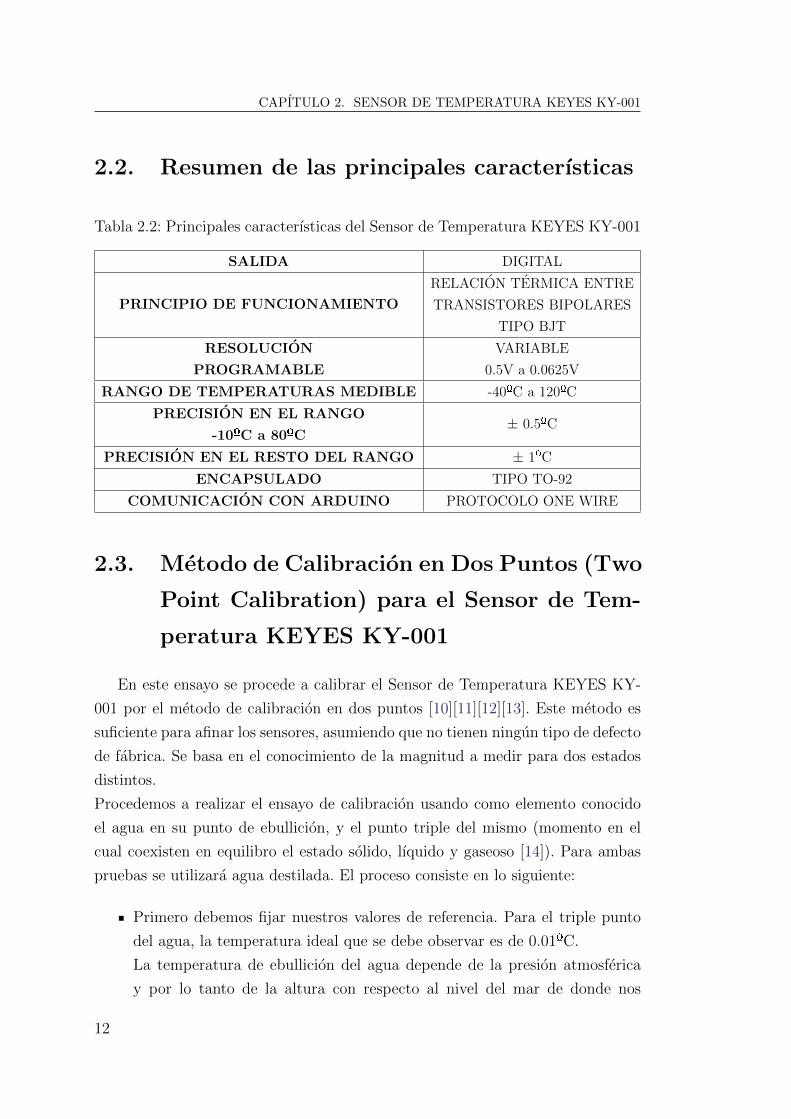
2.2. Resumen de las principales caracterısticas
Tabla 2.2: Principales caracterısticas del Sensor de Temperatura KEYES KY-001
SALIDA DIGITAL
PRINCIPIO DE FUNCIONAMIENTO
RELACION TERMICA ENTRE
TRANSISTORES BIPOLARES
TIPO BJT
RESOLUCION
PROGRAMABLE
VARIABLE
0.5V a 0.0625V
RANGO DE TEMPERATURAS MEDIBLE -40ºC a 120ºC
PRECISION EN EL RANGO
-10ºC a 80ºC± 0.5ºC
PRECISION EN EL RESTO DEL RANGO ± 1ºC
ENCAPSULADO TIPO TO-92
COMUNICACION CON ARDUINO PROTOCOLO ONE WIRE
2.3. Metodo de Calibracion en Dos Puntos (Two
Point Calibration) para el Sensor de Tem-
peratura KEYES KY-001
En este ensayo se procede a calibrar el Sensor de Temperatura KEYES KY-
001 por el metodo de calibracion en dos puntos [10][11][12][13]. Este metodo es
suficiente para afinar los sensores, asumiendo que no tienen ningun tipo de defecto
de fabrica. Se basa en el conocimiento de la magnitud a medir para dos estados
distintos.
Procedemos a realizar el ensayo de calibracion usando como elemento conocido
el agua en su punto de ebullicion, y el punto triple del mismo (momento en el
cual coexisten en equilibro el estado solido, lıquido y gaseoso [14]). Para ambas
pruebas se utilizara agua destilada. El proceso consiste en lo siguiente:
Primero debemos fijar nuestros valores de referencia. Para el triple punto
del agua, la temperatura ideal que se debe observar es de 0.01ºC.
La temperatura de ebullicion del agua depende de la presion atmosferica
y por lo tanto de la altura con respecto al nivel del mar de donde nos
12

CAPITULO 2. SENSOR DE TEMPERATURA KEYES KY-001
encontremos. La zona donde yo realizare estas pruebas (Playa Blanca, Lan-
zarote, Islas Canarias) se situa a 31m por encima del nivel de mar ([15])
con una presion atmosferica aproximada de 1016.1Hpa ([16]) y por lo tanto
la temperatura teorica de ebullicion es de 99.9ºC.
Nos referiremos a estos valores como:
TRefBaja ⇒ (0.01ºC).
TRefAlta ⇒ (99.9ºC).
El siguiente paso consiste en medir con nuestro sensor, los valores de tem-
peratura presentes en ambos procesos. Llamaremos a estos:
TMedBaja ⇒ Para la medicion en el triple punto.
TMedAlta ⇒ Para la medicion en el momento de ebullicion.
Una vez tenemos los valores de referencia y los valores medidos, podemos
ajustar el sensor para nuevas mediciones de temperatura. Por lo tanto te-
nemos que anadir dos valores mas:
TMEDIDA ⇒ Valor recogido por el sensor en una medicion dentro de
su rango de accion.
TCORREGIDA ⇒ Valor corregido mediante la ecuacion 2.6.
TCORREGIDA = [(TMEDIDA − TMedBaja) · (TRefAlta − TRefBaja)
TMedAlta − TMedBaja
] + TRefBaja (2.6)
2.3.1. Medicion en el punto triple del agua
Para obtener este equilibrio, se recomienda coger un recipiente y llenarlo de
cubitos de hielo picado hasta arriba. Luego, se vierte agua frıa hasta completar
el 80 % del mismo. Tras esto, volvemos a colocar algunos cubitos de hielo encima
(ver referencia [14]). Es muy importante que durante todo el proceso de medicion,
siempre haya hielo en la parte inferior del recipiente, evitando que se descongele
(figura 2.6a).
13

CAPITULO 2. SENSOR DE TEMPERATURA KEYES KY-001
En mi caso, el sensor de temperatura con el que cuento, no esta preparado
para ser sumergido directamente en lıquidos. Por eso, previamente he preparado
un revestimiento estanco utilizando un tubo termo-retractil (figura 2.6b). Este
es bastante robusto y una vez calentado y luego enfriado queda bien pegado al
sensor. La disipacion termica debido a dicho aislamiento es mınima y despreciable.
Una vez tenemos preparado ambos elementos, procedemos a realizar las me-
diciones:
(a) Medicion de la temperatura en hielo fundente
(b) DS18B20 con aislamiento
Figura 2.6: Medicion en el entorno del Triple Punto para calibracion en dos puntos
14

CAPITULO 2. SENSOR DE TEMPERATURA KEYES KY-001
2.3.2. Medicion en estado de ebullicion del agua
Al igual que en experimento anterior, la medicion se ha de realizar dentro de
un lıquido (agua destilada) y por lo tanto conservaremos el tubo termo-retractil
utilizado como aislante estanco. Antes de realizar cualquier medicion, se ha dejado
que el sensor vuelva a temperatura ambiente.
Se ha colocado un recipiente con agua destilada a hervir. Una vez adquirido el
punto de ebullicion, se introduce el sensor y se mantiene de esta manera el tiempo
necesario hasta que la medida es estable (figuras 2.7a y 2.7)[16].
(a) Preparacion del entorno de trabajo (reci-
piente con agua hirviendo)
(b) Introduccion del sensor en el entorno de
ebullicion
Figura 2.7: Medicion en el entorno de ebullicion para el metodo de calibracion endos puntos
15

CAPITULO 2. SENSOR DE TEMPERATURA KEYES KY-001
2.4. Resultados
2.4.1. Resultados para la medicion en el triple punto del
agua
Se recogen todos los datos mediante el software MATLAB, y con una sencilla
funcion, se genera una grafica con la que poder seguir este procedimiento de una
forma mas visual:
Figura 2.8: Grafica para la medicion de la temperatua en el entorno del triplepunto para el agua
Vemos que tras enfriarse dentro del entorno, alcanza un valor muy proximo
a cero. Como criterio para seleccionar un valor, se ha decidido realizar la moda
estadıstica (valor mas repetido dentro de un conjunto de valores) desde el primer
valor recogido tras descender de 0.5ºC hasta el primer valor superior a 0.5ºC tras
comenzar su recuperacion a temperatura ambiente (retirada del sensor).
El resultado obtenido ha sido: TMedBaja = -0.012ºC
16

CAPITULO 2. SENSOR DE TEMPERATURA KEYES KY-001
2.4.2. Resultados para la medicion en el punto de ebulli-
cion
Recogemos los datos en MATLAB y procedemos a realizar una grafica:
Figura 2.9: Grafica para la medicion de la temperatua en el entorno de ebulliciondel agua
Como valor representativo de la medida, se elige el mas repetido (moda es-
tadıstica) desde que el sensor alcanza 99ºC y sube, hasta que vuelve a alcanzar
el mismo valor (99ºC) cuando empieza a enfriarse (retirada del sensor a tempe-
ratura ambiente).
El resultado obtenido ha sido: TMedAlta = 99.12ºC
2.4.3. Ajuste del valor de salida
Tras haber realizado estas pruebas, se han obtenido todos los datos necesarios
para ajustar la salida del sensor. Ahora simplemente se debe introducir la ecuacion
2.6 en el codigo de ARDUINO para obtener el valor calibrado:
TCORREGIDA = [(TMEDIDA − (−0,012)) · (99,9− 0,01)
99,12− (−0,012)] + 0,01 (2.7)
17

CAPITULO 2. SENSOR DE TEMPERATURA KEYES KY-001
2.4.4. Discusion de los resultados
Segun los tecnicos de la empresa ThermoWorks (sector: fabricacion de senso-
res de temperatura)[17], si nuestros valores medidos en ambos entornos para la
calibracion en dos puntos (TMedBaja y TMedAlta), estan dentro del margen de error
que proporciona el fabricante (± 0.5ºC para el rango -10ºC a 80ºC y ±1ºC para
el resto) con respecto a sus valores teoricos (TRefBaja y TRefAlta), no se deberıa
ajustar el valor de salida, pues esto podrıa llevar a error:
TRefBaja-TMedBaja = 0.022ºC <±0.5ºC
TRefAlta-TMedAlta = 0.78ºC <±1ºC
Como los resultados obtenidos estan dentro de las especificaciones, se ha de-
cidido dejar el sensor sin ajustar.
18
CAPITULO 3. SENSOR DE TEMPERATURA KEYES KY-013
3. Sensor de Temperatura KEYES
KY-013
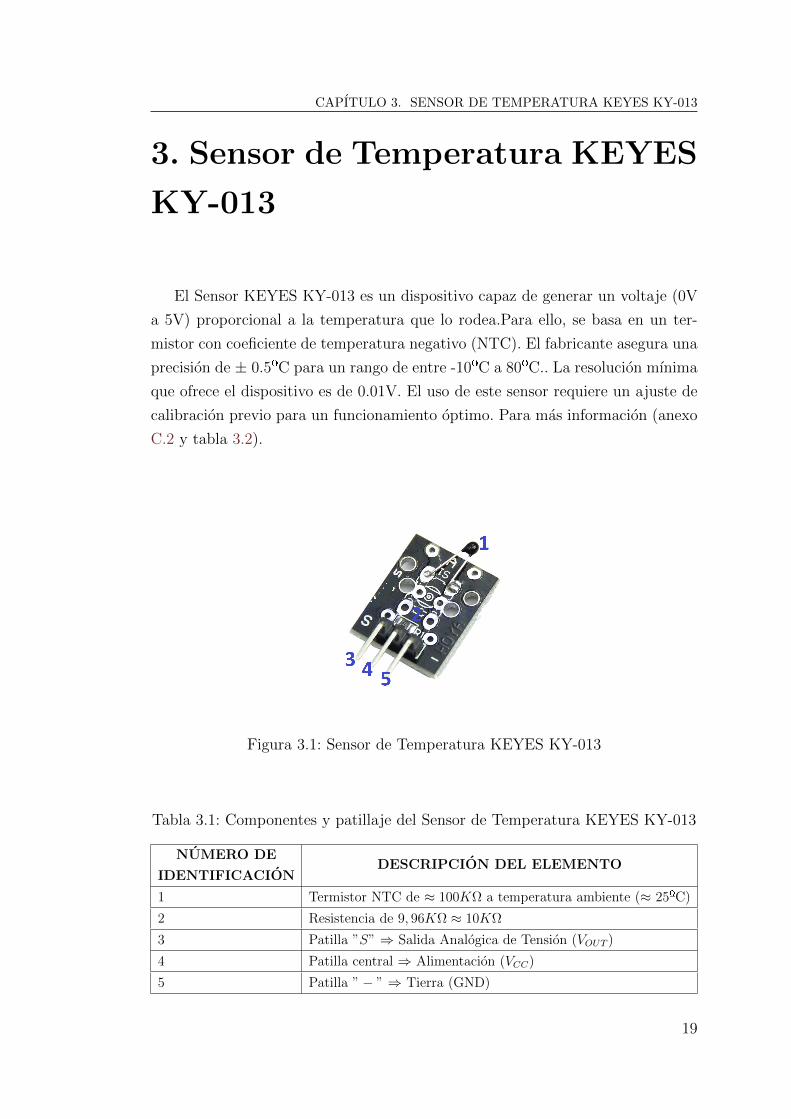
El Sensor KEYES KY-013 es un dispositivo capaz de generar un voltaje (0V
a 5V) proporcional a la temperatura que lo rodea.Para ello, se basa en un ter-
mistor con coeficiente de temperatura negativo (NTC). El fabricante asegura una
precision de ± 0.5ºC para un rango de entre -10ºC a 80ºC.. La resolucion mınima
que ofrece el dispositivo es de 0.01V. El uso de este sensor requiere un ajuste de
calibracion previo para un funcionamiento optimo. Para mas informacion (anexo
C.2 y tabla 3.2).
Figura 3.1: Sensor de Temperatura KEYES KY-013
Tabla 3.1: Componentes y patillaje del Sensor de Temperatura KEYES KY-013
NUMERO DE
IDENTIFICACIONDESCRIPCION DEL ELEMENTO
1 Termistor NTC de ≈ 100KΩ a temperatura ambiente (≈ 25ºC)
2 Resistencia de 9, 96KΩ ≈ 10KΩ
3 Patilla ”S” ⇒ Salida Analogica de Tension (VOUT )
4 Patilla central ⇒ Alimentacion (VCC)
5 Patilla ”− ” ⇒ Tierra (GND)
19

CAPITULO 3. SENSOR DE TEMPERATURA KEYES KY-013
3.1. Esquema electrico
Esquema electrico del sensor realizado mediante la ayuda del multımetro Pro-
max PD-185 y la herramienta de diseno de circuitos en lınea EasyEda [6]:
A A
B B
C C
D D
1
1
2
2
3
3
4
4
5
5
TITLE:
New Schematic REV: 1.0
Date: 2018-08-26 Sheet: 1/1
EasyEDA V5.7.19 Drawn By: Your Name
VCC 10kR V_OUT
100KΩNTC
Figura 3.2: Esquema electrico de la PCB del Sensor de Temperatura KEYESKY-013
3.2. Principio de funcionamiento
El Sensor de Temperatura KEYES KY-013 esta basado en un divisor de ten-
sion compuesto por dos resistencias: un termistor NTC de 100KΩ(valor aproxi-
mado a temperatura ambiente ≈ 25ºC) y una resistencia comun de 10KΩ. Al
variar la temperatura, variara el valor de la RNTC y por lo tanto, el voltaje de
salida VOUT (figura 3.2).
Si se conecta el circuito conforme al patillaje indicado en la PCB (figura
3.2), para una temperatura elevada el voltaje de salida (VOUT ) tendra valores
pequenos, mientras que para temperaturas bajas se observara un nivel de voltaje
(VOUT ) alto. Para invertir este comportamiento se han intercambiado las patillas
de Tierra y Alimentacion (figura 3.3).
20
CAPITULO 3. SENSOR DE TEMPERATURA KEYES KY-013
A A
B B
C C
D D
1
1
2
2
3
3
4
4
5
5
TITLE:
New Schematic REV: 1.0
Date: 2018-08-26 Sheet: 1/1
EasyEDA V5.7.19 Drawn By: Your Name
VCC
10kR
V_OUT100KΩNTC
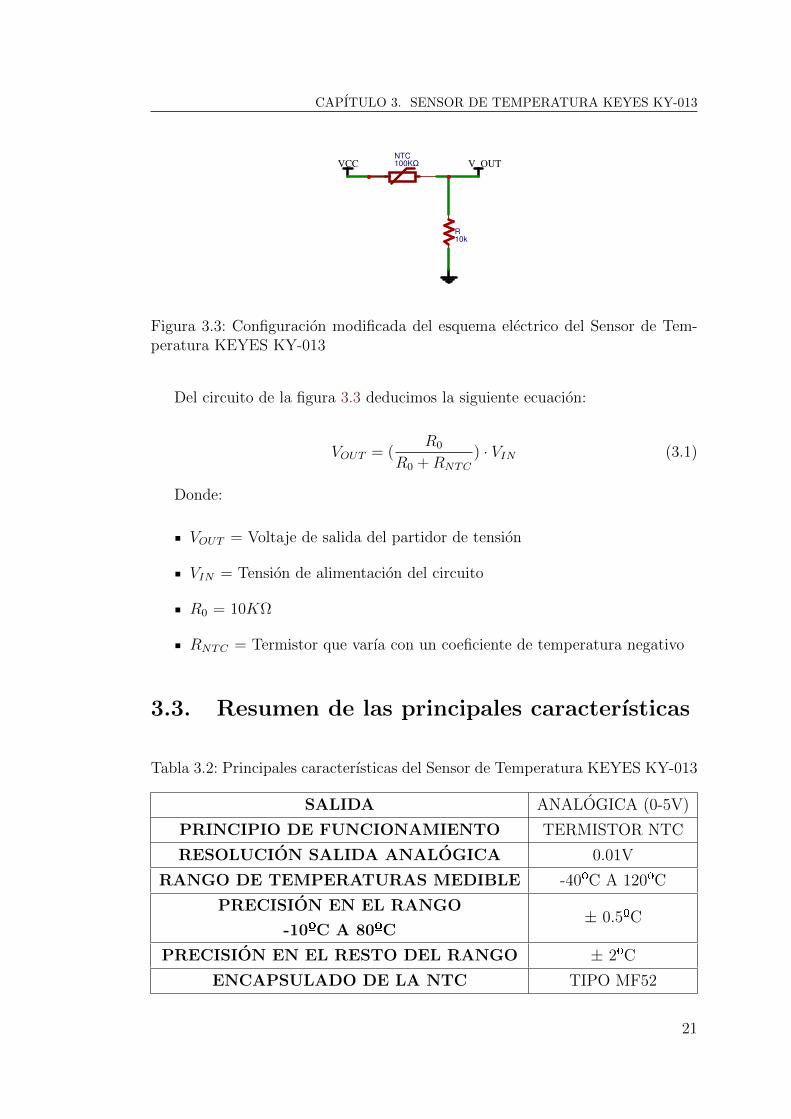
Figura 3.3: Configuracion modificada del esquema electrico del Sensor de Tem-peratura KEYES KY-013
Del circuito de la figura 3.3 deducimos la siguiente ecuacion:
VOUT = (R0
R0 +RNTC
) · VIN (3.1)
Donde:
VOUT = Voltaje de salida del partidor de tension
VIN = Tension de alimentacion del circuito
R0 = 10KΩ
RNTC = Termistor que varıa con un coeficiente de temperatura negativo
3.3. Resumen de las principales caracterısticas
Tabla 3.2: Principales caracterısticas del Sensor de Temperatura KEYES KY-013
SALIDA ANALOGICA (0-5V)
PRINCIPIO DE FUNCIONAMIENTO TERMISTOR NTC
RESOLUCION SALIDA ANALOGICA 0.01V
RANGO DE TEMPERATURAS MEDIBLE -40ºC A 120ºC
PRECISION EN EL RANGO
-10ºC A 80ºC± 0.5ºC
PRECISION EN EL RESTO DEL RANGO ± 2ºC
ENCAPSULADO DE LA NTC TIPO MF52
21

CAPITULO 3. SENSOR DE TEMPERATURA KEYES KY-013
3.4. Metodo de Calibracion mediante el ajuste
la ecuacion de SteinHart-Hart para el sen-
sor de Temperatura KEYES KY-013
Para la calibracion de los Sensores de Temperatura KEYES KY-013 (y KE-
YES KY-028) utilizaremos la ecuacion de Steinhart-Hart (4.2)[18][19][20], que
proporciona el mejor ajuste para el comportamiento de la RNTC (figura 3.3) con
respecto a la temperatura (caracterizacion).
1
T= A+ (B · lnRNTC) + [C · (lnRNTC)3] (3.2)
Dicha ecuacion (4.2) viene determinada por tres parametros: A, B y C. Es-
tos parametros estan directamente relacionados con el valor de la RNTC y para
conocer su magnitud se procede de la siguiente manera:
En primer lugar se debe conocer el valor de la RNTC a tres temperaturas
diferentes, espaciadas entre sı, al menos 10ºC (RNTCT1, RNTCT2
y RNTCT3). Para
registrar el valor de dichas temperaturas, se usa un sensor previamente calibrado
como referencia, que en este caso sera el sensor de temperatura KEYES KY-001.
El valor de la NTC para el Sensor de Temperatura KEYES KY-013 se deduce
del circuito de la figura 3.1:
RNTC = (VIN ·R0
VOUT
)−R0 (3.3)
El valor de la RNTC para el Sensor de Temperatura KEYES KY-028 se deduce
del circuito 4.2:
RNTC =VOUT ·RPOTENCIOMETRO
VIN − VOUT
(3.4)
Fijaremos tres entornos de medicion:
Vaso con agua y hielo (RNTCT1)
22

CAPITULO 3. SENSOR DE TEMPERATURA KEYES KY-013
Habitacion a temperatura ambiente (RNTCT2)
Recipiente con agua hirviendo (RNTCT3)
En cada medio se tomaron como mınimo 190 muestras de ambas magnitudes
(temperatura y resistencia) y se establecio como valor relevante la media de las
mismas (Son los mismos entornos que para las pruebas del Sensor de Temperatura
KEYES KY-001, ver figuras 2.7 y 2.6a).
Para todas las mediciones, se ha de intentar mantener todos los sensores im-
plicados (KEYES KY-013, KEYES KY-028 y KEYES KY-001) lo mas proximos
posibles el uno del otro, y dotarlos de aislamiento estanco. Para ello, utilizare-
mos el mismo aislante que en el ensayo anterior (ver sensores KEYES-KY001 y
KEYES Ky-013 2.6b , 3.4).
Figura 3.4: Aislamiento del Sensor de Temperatura KEYES KY013
Una vez obtenidos los valores de RNTCT1, RNTCT2
y RNTCT3, debemos resolver
e siguiente sistema de ecuaciones para obtener los parametros A, B y C:
1
T1
= A+ (B · lnRNTCT1) + [C · (lnRNTCT1
)3]
1
T2
= A+ (B · lnRNTCT2) + [C · (lnRNTCT2
)3]
1
T3
= A+ (B · lnRNTCT3) + [C · (lnRNTCT3
)3]
(3.5)
Para la obtencion de los parametros de Steinhart Hart se ha recurrido a una
calculadora on-line ( [21]) que se encarga de resolver las ecuaciones caracterısticas
(ecuaciones 4.4). Esta calculadora nos proporciona ademas, datos como pueden
ser el coeficiente β caracterıstico para cada Termistor NTC
23

CAPITULO 3. SENSOR DE TEMPERATURA KEYES KY-013
3.4.1. caracterizacion del sensor de Temperatura KEYES
KY-013
En este procedimiento se quieren obtener los siguientes parametros:
Curva caracterıstica del Voltaje de salida VOUT frente a la temperatura.
Curva de la potencia disipada por la resistencia RNTC frente a la tempera-
tura.
Ademas, se pretende estudiar el comportamiento del sensor de temperatura
KEYES KY-013 (ya calibrado mediante el ajuste de la ecuacion de Steinhart-
Hart (apartado 3.4)), frente a otro sensor de referencia, en este caso el KEYES
KY-001. Para ello,Se han situado los sensores en 3 entornos diferentes (agua frıa,
habitacion a temperatura ambiente y recipiente con agua hirviendo).
Las mediciones se han llevado de la siguiente manera:
Se han dejado los sensores a reposar a temperatura ambiente.
Una vez estabilizado el valor de temperatura ambiente, se introducen el el
primer medio, en este caso agua hirviendo. Se dejan en el recipiente hasta
que ambos alcanzan una temperatura uniforme.
Se retiran del recipiente con agua hirviendo y se vuelven a dejar reposar
hasta que alcanzan temperatura ambiente.
Tras reposar a temperatura ambiente, se introducen en un vaso con agua
frıa y hielo. Se dejan en este medio hasta que se estabilizan en ciertos valores
de temperatura.
Como paso final, se vuelven a dejar a temperatura ambiente hasta que
alcanzan un valor estacionario.
24

CAPITULO 3. SENSOR DE TEMPERATURA KEYES KY-013
3.5. Resultados
3.5.1. Obtencion de los parametros A, B y C de la ecua-
cion de SteinHart-Hart para el sensor KEYES KY-
013
Para poder utilizar la calculadora online se han de introducir los datos de
temperatura y resistencia requeridos. Son los siguientes:
T1 = 0.53ºC ⇒ RNTCT1= 350370Ω
T2 = 26.4ºC ⇒ RNTCT1= 95463Ω
T3 = 98.98ºC ⇒ RNTCT1= 6651Ω
Los resultados han sido estos:
A = 0,5089218645 · 10−3
B = 2,484818972 · 10−4
C = 0,1313142875 · 10−7
25

CAPITULO 3. SENSOR DE TEMPERATURA KEYES KY-013
Figura 3.5: Calculadora online [21] de los parametros A, B y C de la ecuacion deSteinhart-Hart para el Sensor de Temperatura KEYES KY-013
En la figura 3.5 podemos apreciar la curva de calibracion generada por el
software de la calculadora online.
3.5.1.1. Curva caracterıstica
A continuacion se muestra la grafica con la curva caracterıstica del voltaje de
salida VOUT que se tiene en el divisor de tension del circuito de la figura 3.3 frente
a la variacion de temperatura en el entorno:
26

CAPITULO 3. SENSOR DE TEMPERATURA KEYES KY-013
Figura 3.6: Voltaje de salida frente a Temperatura para el Sensor de TemperaturaKEYES KY-013
3.5.1.2. Disipacion de Potencia del Sensor de Temperatura KEYES
KY-013
La potencia que disipa la Resistencia RNTC viene definida por la siguiente
ecuacion:
PDISIPADA = I2 ·RNTC (3.6)
Si despejamos la intensidad que circula por la RNTC del circuito de la figura
3.3 queda definida de la siguiente manera:
INTC =VCC − VOUT
RNTC
(3.7)
Si sustituimos este termino en la ecuacion 3.6 el resultado es el siguiente:
PDISIPADA =(VCC − VOUT )2
RNTC
(3.8)
A continuacion se muestra una grafica en la cual se puede visualizar la potencia
disipada por la resistencia RNTC con respecto a la temperatura del entorno:
27

CAPITULO 3. SENSOR DE TEMPERATURA KEYES KY-013
Figura 3.7: Potencia disipada por la resistencia RNTC del Sensor de TemperaturaKEYES KY-013
Como se puede observar, la resistencia disipa mucha mas potencia cuando se
encuentra a temperaturas elevadas. Esto es debido a que se trata de un termistor
tipo NTC (a bajas temperaturas RNTC tiene un valor alto y a altas temperaturas
un valor bajo, sustituir en la ecuacion 3.8).
3.5.1.3. Prueba simultanea de los sensores de Temperatura KEYES
KY-013 y KEYES KY-001
A continuacion se muestra la grafica en la que se puede observar el comporta-
miento de los Sensores de Temperatura KEYES KY-013 y KEYES KY-001 para
diferentes entornos.
Figura 3.8: Prueba simultanea de los Sensores de Temperatura KEYES KY-001y KEYES KY-013
28

CAPITULO 3. SENSOR DE TEMPERATURA KEYES KY-013
3.5.2. Discusion de los resultados
De los resultados obtenidos en los aparatados anteriores podemos deducir lo
siguiente:
De la grafica generada por la calculadora on-line (figura 3.5), se deduce que
el sensor KEYES KY-013 varıa mas el valor de su resistencia (RNTC) ante
pequenas variaciones de temperatura en un rango de -10ºC a 10ºC que con
respecto a valores altos de temperatura (resto de rango). Esto se entiende
por el grado polinomico de la ecuacion que define esta curva (ecuacion 4.2).
De la grafica figura 3.8 para la prueba simultanea del sensor KEYES KY-013
y KEYES KY-001 podemos concluir que:
El sensor KEYES KY-013 presenta tiempo de respuesta menor que el
KEYES KY-001 con respecto a cambios de temperatura en su entorno.
la repetibilidad en las mediciones del KEYES KY-001 es menor que la
del KEYES KY-001
29

CAPITULO 4. SENSOR DE TEMPERATURA KEYES KY-028
4. Sensor de Temperatura KEYES
KY-028
El sensor KEYES KY-028 es capaz de generar un voltaje (0V a 5V) propor-
cional a la temperatura que lo rodea. Cuenta con una salida digital del tipo todo
o nada (HIGH or LOW) ajustable mediante un potenciometro Bourns 3296 [22]
y un comparador LM393 [23]. Su funcionamiento se basa, al igual que el Sensor
de Temperatura KEYES KY-013 en un termistor tipo NTC (Capıtulo 3). El fa-
bricante asegura una precision de ± 0.5ºC para el rango de temperaturas entre
-10ºC a 80ºC. Para mas informacion (anexo C.2 y tabla 4.2)
Figura 4.1: Sensor de Temperatura KEYES KY-028
Tabla 4.1: Componentes y patillaje del Sensor de Temperatura KEYES KY-028
NUMERO DE
IDENTIFICACION
DESCRIPCION
DEL ELEMENTO
1Termistor NTC de ≈50KΩ
temperatura ambiente (≈25ºC)
2 Comparador LM393
3 Potenciometro Bourns 3296 (10Ω-2MΩ)
4 Resistencias R3 y R5 de 68, 5KΩ
5 Resistencias R1 y R6 de 1KΩ
6 Resistencia R2 de 10KΩ
7 Resistencias R4 de 150Ω
30
CAPITULO 4. SENSOR DE TEMPERATURA KEYES KY-028
8 LED 1
9 LED 2
10 Patilla AO → Analogical Output (Salida Analogica)
11 Patilla GND → Tierra
12 Patilla + → Alimentacion (VCC)
13 Patilla DO → Digital Output (Salida Digital)
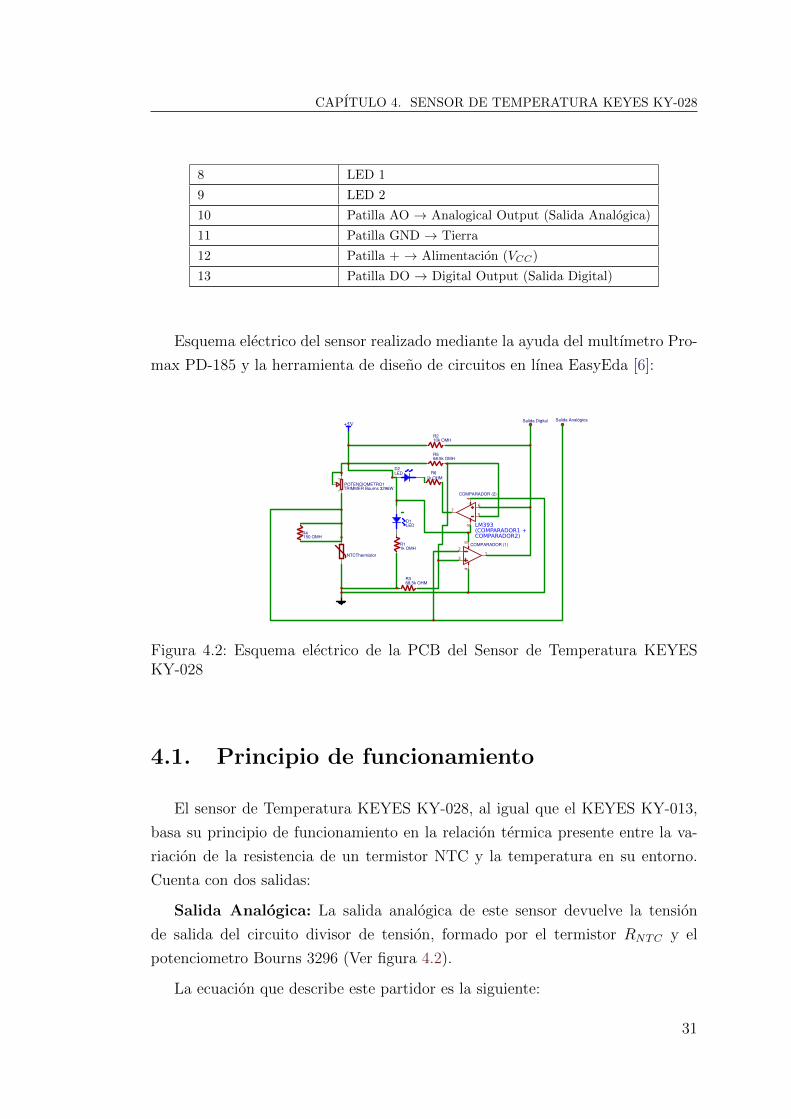
Esquema electrico del sensor realizado mediante la ayuda del multımetro Pro-
max PD-185 y la herramienta de diseno de circuitos en lınea EasyEda [6]:A A
B B
C C
D D
1
1
2
2
3
3
4
4
5
5
TITLE:
New Schematic REV: 1.0
Date: 2018-08-22 Sheet: 1/1
EasyEDA V5.4.11 Drawn By: sawan.sgg
NTCThermistor
TRIMMER Bourns 3296WPOTENCIOMETRO1
1
2
3
10k OMHR2
68.5k OMHR5
1k OHMR6
1k OMHR1
68.5k OHMR3
150 OMHR4
LEDD1
+5VSalida AnalógicaSalida Digital
LEDD2
COMPARADOR (1)
3
21
84
V+
V-
COMPARADOR (2)
6
57
84
V+
V-
LM393(COMPARADOR1 +COMPARADOR2)
Figura 4.2: Esquema electrico de la PCB del Sensor de Temperatura KEYESKY-028
4.1. Principio de funcionamiento
El sensor de Temperatura KEYES KY-028, al igual que el KEYES KY-013,
basa su principio de funcionamiento en la relacion termica presente entre la va-
riacion de la resistencia de un termistor NTC y la temperatura en su entorno.
Cuenta con dos salidas:
Salida Analogica: La salida analogica de este sensor devuelve la tension
de salida del circuito divisor de tension, formado por el termistor RNTC y el
potenciometro Bourns 3296 (Ver figura 4.2).
La ecuacion que describe este partidor es la siguiente:
31

CAPITULO 4. SENSOR DE TEMPERATURA KEYES KY-028
VOUT = (RNTC
RPOTENCIOMETRO +RNTC
) · VIN (4.1)
Salida Digital: Hace la funcion de alarma de nivel. Cuando se supera cierto
valor de temperatura, la salida digital devuelve un 1 logico. Mientras no se supere
el valor de temperatura deseado, la salida digital se mantendra a 0. A continuacion
se describen los elementos que hacen posible este funcionamiento:
Comparador de tension LM393: Se trata de un circuito integrado con dos
comparadores en su interior. Cada uno es capaz de comparar dos voltajes.
Normalmente uno suele ser un voltaje fijo de referencia y el otro un voltaje
variable. El comparador es capaz de discernir cuando el voltaje de referencia
es superado por el voltaje variable, y enviar una senal digital HIGH (1
logico) por su patilla numero 1.
Partidor de tension formado porR3 yR5 (Ver figura 4.2). Ambas resistencias
tienen el mismo valor (68,5KΩ) para ası entregar como voltaje de salida
(VOUTR5/R6) la mitad del voltaje de entrada (VIN). Para una entrada de
5V, el partidor entregarıa un voltaje fijo de 2.5V. Este sera el voltaje de
referencia para el comparador LM393.
Partidor de tension formado por la RNTC y el potenciometro Bourns 3296.
El voltaje de salida de este partidor sera el voltaje variable a comparar en
el comparador LM393.
Por lo tanto, cuando estamos cerca de una fuente calorıfica, la cual queramos
usar como temperatura de disparo de la alarma, se ha de regular el potencio-
metro para que la salida VOUT del partidor de tension (formado por el propio
potenciometro y RNTC este lo mas proximo posible al valor de 2.5V. Se ha de
tener en cuenta el funcionamiento inverso del sensor donde, para temperaturas
en aumento, disminuira el voltaje de salida del partidor (VOUT ) y viceversa.
32

CAPITULO 4. SENSOR DE TEMPERATURA KEYES KY-028
4.2. Resumen de las principales caracterısticas
Tabla 4.2: Principales caracterısticas del Sensor de Temperatura KEYES KY-028
SALIDA ANALOGICA 0-5V
SALIDA DIGITAL TODO O NADA (0-5V)
PRINCIPIO DE FUNCIONAMIENTO TERMISTOR NTC
RESOLUCION SALIDA ANALOGICA 0.01V
RESOLUCION SALIDA DIGITAL DOS ESTADOS: HIGH(1) Y LOW(0)
RANGO DE TEMPERATURAS MEDIBLE -40ºC A 120ºC
PRECISION EN EL RANGO
-10ºC A 80ºC± 0.5ºC
PRECISION EN EL RESTO DEL RANGO ± 2ºC
SENSIBILIDAD DE SALIDA DIGITAL AJUSTABLE MEDIANTE POTENCIOMETRO
ENCAPSULADO DE LA NTC TIPO MF52
4.3. Metodo de Calibracion mediante el ajuste
la ecuacion de SteinHart-Hart para el sen-
sor de Temperatura KEYES-KY028
Para la calibracion de los Sensores de Temperatura KEYES KY-028 se utiliza
el mismo metodo que para el Sensor de Temperatura KEYES KY-013 (seccion
3.4), la Ecuacion de Steinhart-Hart ((4.2).
1
T= A+ (B · lnRNTC) + [C · (lnRNTC)3] (4.2)
El valor de la RNTC para el Sensor de Temperatura KEYES KY-028 se deduce
del circuito 4.2:
RNTC =VOUT ·RPOTENCIOMETRO
VCC − VOUT
(4.3)
Una vez obtenidos los valores de RNTCT1, RNTCT2
y RNTCT3, debemos resolver
e siguiente sistema de ecuaciones para obtener los parametros A, B y C:
33

CAPITULO 4. SENSOR DE TEMPERATURA KEYES KY-028
1
T1
= A+ (B · lnRNTCT1) + [C · (lnRNTCT1
)3]
1
T2
= A+ (B · lnRNTCT2) + [C · (lnRNTCT2
)3]
1
T3
= A+ (B · lnRNTCT3) + [C · (lnRNTCT3
)3]
(4.4)
Para la obtencion de los parametros de Steinhart Hart se ha recurrido a una
calculadora on-line [21] que se encarga de resolver las ecuaciones caracterısticas
(ecuaciones 4.4). Esta calculadora nos proporciona ademas, datos como pueden
ser el coeficiente β caracterıstico para cada Termistor NTC
4.4. Resultados
4.4.1. Obtencion de los parametros A, B y C de la ecua-
cion de SteinHart Hart para el sensor KEYES KY-
028
Para poder utilizar la calculadora online se han de introducir los datos de
temperatura y resistencia requeridos. Son los siguientes:
T1 = 0.53ºC ⇒ RNTCT1= 164874Ω
T2 = 26.4ºC ⇒ RNTCT1= 47321Ω
T3 = 98.98ºC ⇒ RNTCT1= 3420Ω
Los resultados han sido estos:
A = 0,7394932093 · 10−3
B = 2,366015369 · 10−4
C = 0,4160709595 · 10−7
34

CAPITULO 4. SENSOR DE TEMPERATURA KEYES KY-028
Figura 4.3: Calculadora online de los parametros A, B y C de la ecuacion deSteinhart-Hart para el Sensor de Temperatura KEYES KY-028 [21]
4.4.2. Discusion de los resultados
Para hallar la temperatura mediante la ecuacion de Steinhart-Hart (4.2) de-
bemos conocer el valor de RNTC . Como observamos en la ecuacion 4.3, RNTC
viene definida por tres variables:
Voltaje de la salida analogica VOUT
Voltaje de entrada VCC
Resistencia del potenciometro RPOTENCIOMETRO
El valor de VCC al igual que el de VOUT son conocidos. El valor del potenciometro
puede ser medido mediante un multımetro. La salida digital todo o nada (alarma)
se ajusta mediante la variacion de la resistencia del potenciometro. Por lo tanto,
surge el inconveniente de que no se puede medir la temperatura a la misma vez que
35

CAPITULO 4. SENSOR DE TEMPERATURA KEYES KY-028
se trata de ajustar la salida digital, pues no hay manera de sustituir la variacion
de RPOTENCIOMETRO en la ecuacion 4.3 utilizada en el codigo de Arduino.
Por lo tanto, si queremos usar el sensor para medir temperatura, debemos fijar
el potenciometro en un valor conocido. Si en cambio queremos usarlo como alarma
de temperatura de una fuente calorıfica se debe ajustar el valor del potenciometro
como se ha indicado anteriormente. En este aspecto, el Sensor de Temperatura
KEYES KY-001 permite realizar ambas funciones (alarma y medicion) de forma
mucho mas eficiente.
Si finalmente decidimos utilizarlo para mediciones de temperatura, debemos
asegurar que el potenciometro que incorpora este completamente inmovilizado
pues hasta el mas pequeno desajuste del mismo hace que la ecuacion de salida
de la Temperatura varıe. Ademas, su tamano es bastante mayor a los otros dos,
tanto en superficie como en altura debido a los componentes que monta en su
PCB.
36

CAPITULO 5. SENSOR FOTORESISTOR KEYES KY-018
5. Sensor Fotoresistor KEYES KY-
018
El sensor Fotoresistor KEYES KY-018 es un dispositivo capaz de generar
un voltaje (0V a 5V) proporcional a la luz que incide sobre el. Esto se basa
en las propiedades de una resistencia fotodependiente (LDR)([? ]). La relacion
que guarda el valor de resistencia con la incidencia de luz en su superficie es
inversamente proporcional, es decir, cuanta mas luz incida, menor sera el valor
de la resistencia y viceversa. Para mas informacion (anexo C.4 y tabla 5.2).
Figura 5.1: Sensor Fotoresistor KEYES KY-018
Tabla 5.1: Componentes y patillaje del Sensor Fotoresistor KEYES KY-018
NUMERO DE
IDENTIFICACIONDESCRIPCION DEL ELEMENTO
1 Fotoresistencia LDR
2 Resistencia de 10KΩ
3 Patilla ”− ” ⇒ Tierra (GND)
4 Patilla Central ⇒ Alimentacion (VCC)
5 Patilla ”S” ⇒ Salida Analogica de Tension VOUT
Esquema electrico del sensor realizado mediante la ayuda del multımetro Pro-
37
CAPITULO 5. SENSOR FOTORESISTOR KEYES KY-018
max PD-185 y la herramienta de diseno de circuitos en lınea EasyEda [6]:A A
B B
C C
D D
1
1
2
2
3
3
4
4
5
5
TITLE:
New Schematic REV: 1.0
Date: 2018-08-26 Sheet: 1/1
EasyEDA V5.7.19 Drawn By: Your Name
VCC 10kR V_OUT
Fotoresistencia
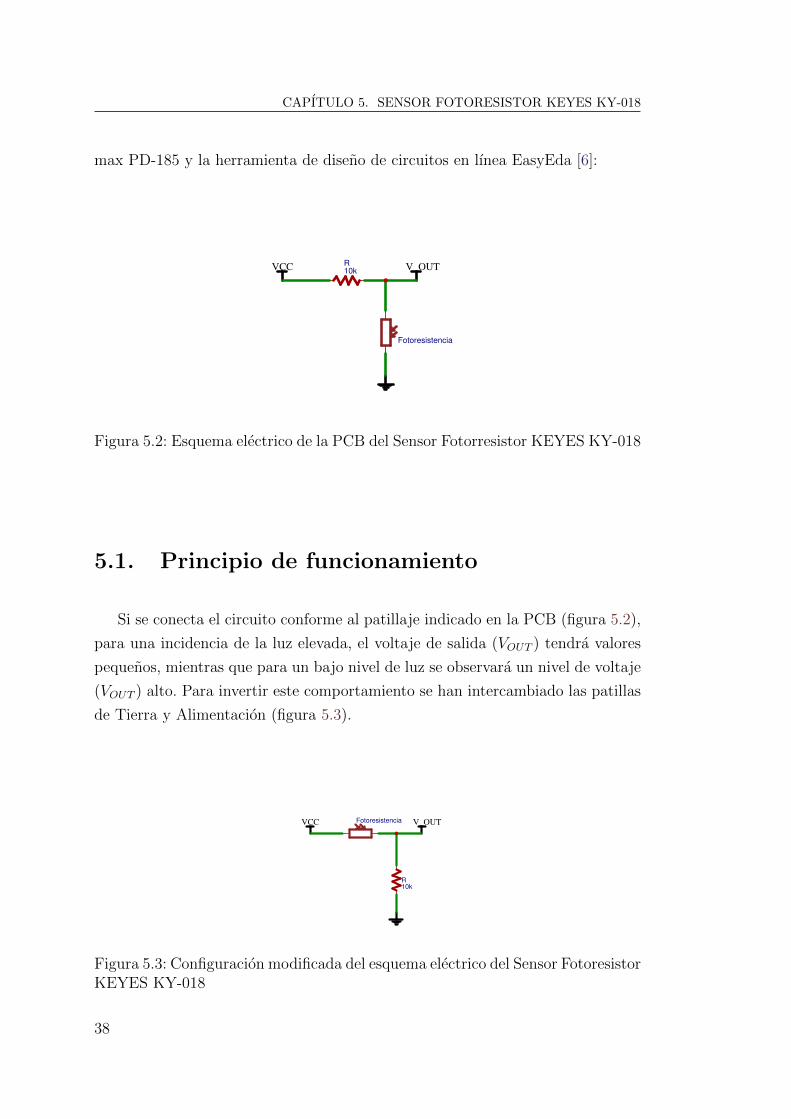
Figura 5.2: Esquema electrico de la PCB del Sensor Fotorresistor KEYES KY-018
5.1. Principio de funcionamiento
Si se conecta el circuito conforme al patillaje indicado en la PCB (figura 5.2),
para una incidencia de la luz elevada, el voltaje de salida (VOUT ) tendra valores
pequenos, mientras que para un bajo nivel de luz se observara un nivel de voltaje
(VOUT ) alto. Para invertir este comportamiento se han intercambiado las patillas
de Tierra y Alimentacion (figura 5.3).A A
B B
C C
D D
1
1
2
2
3
3
4
4
5
5
TITLE:
New Schematic REV: 1.0
Date: 2018-08-26 Sheet: 1/1
EasyEDA V5.7.19 Drawn By: Your Name
VCC
10kR
V_OUTFotoresistencia
Figura 5.3: Configuracion modificada del esquema electrico del Sensor FotoresistorKEYES KY-018
38
CAPITULO 5. SENSOR FOTORESISTOR KEYES KY-018
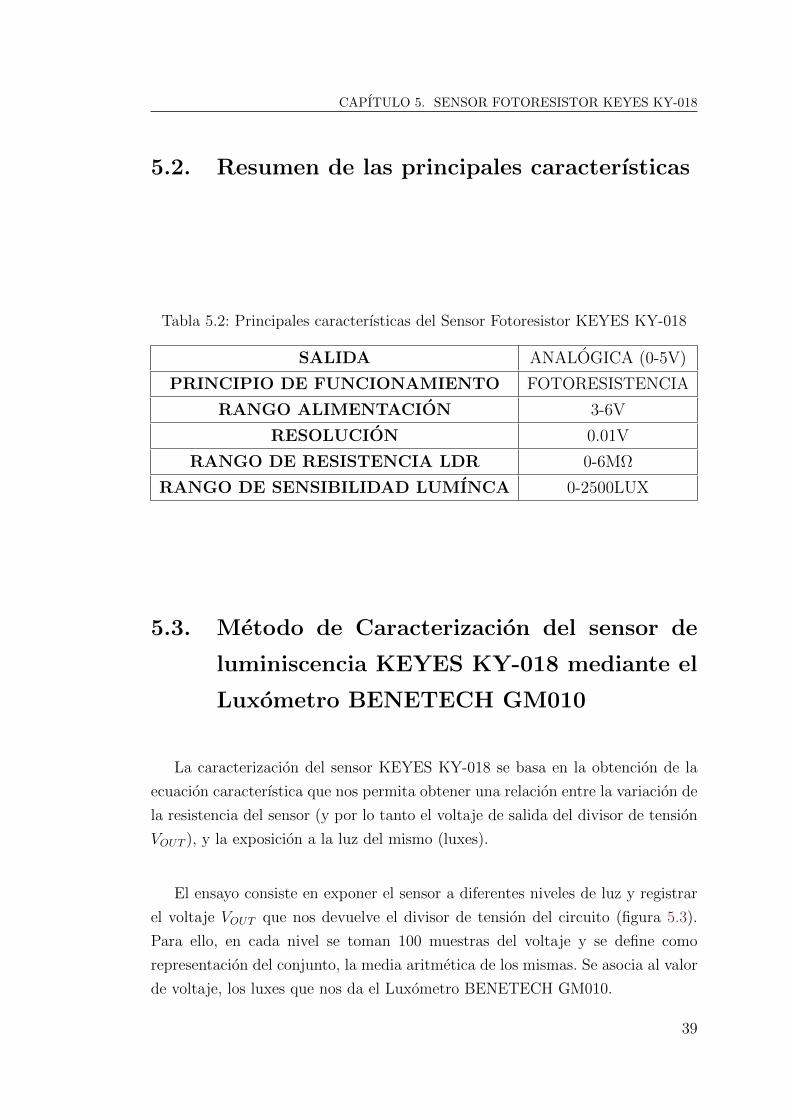
5.2. Resumen de las principales caracterısticas
Tabla 5.2: Principales caracterısticas del Sensor Fotoresistor KEYES KY-018
SALIDA ANALOGICA (0-5V)
PRINCIPIO DE FUNCIONAMIENTO FOTORESISTENCIA
RANGO ALIMENTACION 3-6V
RESOLUCION 0.01V
RANGO DE RESISTENCIA LDR 0-6MΩ
RANGO DE SENSIBILIDAD LUMINCA 0-2500LUX
5.3. Metodo de Caracterizacion del sensor de
luminiscencia KEYES KY-018 mediante el
Luxometro BENETECH GM010
La caracterizacion del sensor KEYES KY-018 se basa en la obtencion de la
ecuacion caracterıstica que nos permita obtener una relacion entre la variacion de
la resistencia del sensor (y por lo tanto el voltaje de salida del divisor de tension
VOUT ), y la exposicion a la luz del mismo (luxes).
El ensayo consiste en exponer el sensor a diferentes niveles de luz y registrar
el voltaje VOUT que nos devuelve el divisor de tension del circuito (figura 5.3).
Para ello, en cada nivel se toman 100 muestras del voltaje y se define como
representacion del conjunto, la media aritmetica de los mismas. Se asocia al valor
de voltaje, los luxes que nos da el Luxometro BENETECH GM010.
39

CAPITULO 5. SENSOR FOTORESISTOR KEYES KY-018
Figura 5.4: Disposicion conjunta de Sensor Fotoresistor KEYES KY-018 yLuxometro BENETECH GM010
Para generar los distintos niveles de luz, se utiliza una lampara con cuello
flexible, ajustando su posicion segun se requiera de mayor o menor exposicion al
sensor.
Una vez se han recogido todas las muestras en el software MATLAB, se gra-
fican los datos para una mejor visualizacion del ensayo. Tras esto, procedemos a
utilizar la herramienta de ajuste de curvas del sofware (Curve Fitting Tool) para
obtener una ecuacion que se ajuste lo mejor posible a los datos obtenidos. Para
ello, se ha de probar distintas configuraciones y elegir la que a nuestro criterio se
ajuste mejor.
Una vez obtenida la ecuacion que defina la relacion entre la exposicion a la
luz del sensor KEYES KY-018 y el voltaje obtenido, ajustamos el codigo de AR-
DUINO para incluir dicha expresion matematica. Como ultimo paso, realizamos
una prueba para comprobar la funcionalidad del ajuste realizado.
5.4. Resultados
5.4.0.1. Curva y ecuacion caracterıstica
De la tabla A.2 podemos obtener las siguiente grafica del comportamiento del
voltaje del divisor de tension (Ver figura 5.3) frente a los luxes recogidos por el
Luxometro BENTECH GM010.
40

CAPITULO 5. SENSOR FOTORESISTOR KEYES KY-018
Figura 5.5: Luxes frente a voltaje del divisor de tension para el Sensor FotoresistorKEYES KY-018
Se puede deducir que el comportamiento del Sensor KEYES KY-018 frente
a la luz sigue una distribucion exponencial, siendo el sensor mucho mas sensible
para bajos niveles de luxes.
Para la obtencion de la expresion matematica que nos de la relacion entre la
incidencia de luz sobre la superficie del sensor, y el voltaje generado por el mismo,
se ha utilizado la herramienta de ajuste de curvas de MATLAB (Curve Fitting
Tool). Probando varios modelos de aproximacion sobre la curva de la figura 5.5,
al final se ha decidido optar por una expresion exponencial de 4 terminos:
LUXES = A · eVOUT ·B + C · eVOUT ·D (5.1)
Donde:
A = 6.036
B = 0.7642
C = 1,332 · 10−13
D = 7.702
41

CAPITULO 5. SENSOR FOTORESISTOR KEYES KY-018
Figura 5.6: Herramienta de ajuste de curvas (Curve Fitting Tool) de MATLABpara la obtencion de la ecuacion caracterıstica del sensor KEYES KY-018
5.4.1. Discusion de los resultados
El Sensor Fotoresistor KEYES KY-018 ha sido utilizado comunmente para
conocer la ausencia o presencia de luz en el entorno del mismo. Tras la caracteri-
zacion que se ha realizado en este proyecto, se amplia su uso para mas situaciones,
ya que permite una estimacion del nivel de luxes presente, aunque su precision
siga siendo ciertamente inferior a la herramienta utilizada como elemento de re-
ferencia en los ensayos (Luxometro BENETECH GM010).
Ya que su costo (> 0.10e) es mucho menor que otros luxometros en el merca-
do (6 10e), depende de la precision que requiramos (y tras realizar los ajustes
propuestos en este documento), puede suponer una alternativa mas viable para
cierto tipo de proyectos (automatizacion, domotica, etc).
Para mejorar aun mas la precision del mismo, se propone repetir el ensayo de
caracterizacion aumentando el numero de puntos de luz estudiados. A su vez, se
entiende que una posible aproximacion logarıtmica de la curva exponencial de
luxes frente a voltaje (figura 5.5) podrıa llevar a un modelo mas lineal y por lo
tanto a una ecuacion caracterıstica mas precisa.
42
CAPITULO 6. SENSOR DE ULTRASONIDOS HC-SR04
6. Sensor de Ultrasonidos HC-SR04
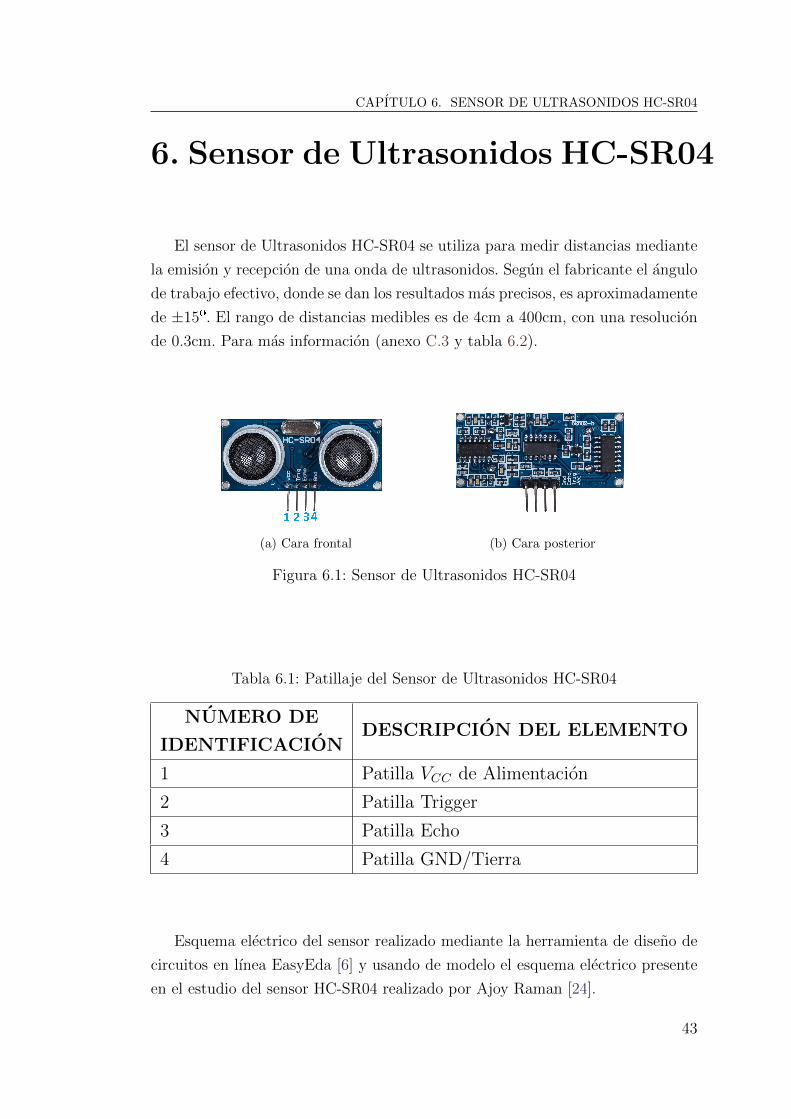
El sensor de Ultrasonidos HC-SR04 se utiliza para medir distancias mediante
la emision y recepcion de una onda de ultrasonidos. Segun el fabricante el angulo
de trabajo efectivo, donde se dan los resultados mas precisos, es aproximadamente
de ±15º. El rango de distancias medibles es de 4cm a 400cm, con una resolucion
de 0.3cm. Para mas informacion (anexo C.3 y tabla 6.2).
(a) Cara frontal (b) Cara posterior
Figura 6.1: Sensor de Ultrasonidos HC-SR04
Tabla 6.1: Patillaje del Sensor de Ultrasonidos HC-SR04
NUMERO DE
IDENTIFICACIONDESCRIPCION DEL ELEMENTO
1 Patilla VCC de Alimentacion
2 Patilla Trigger
3 Patilla Echo
4 Patilla GND/Tierra
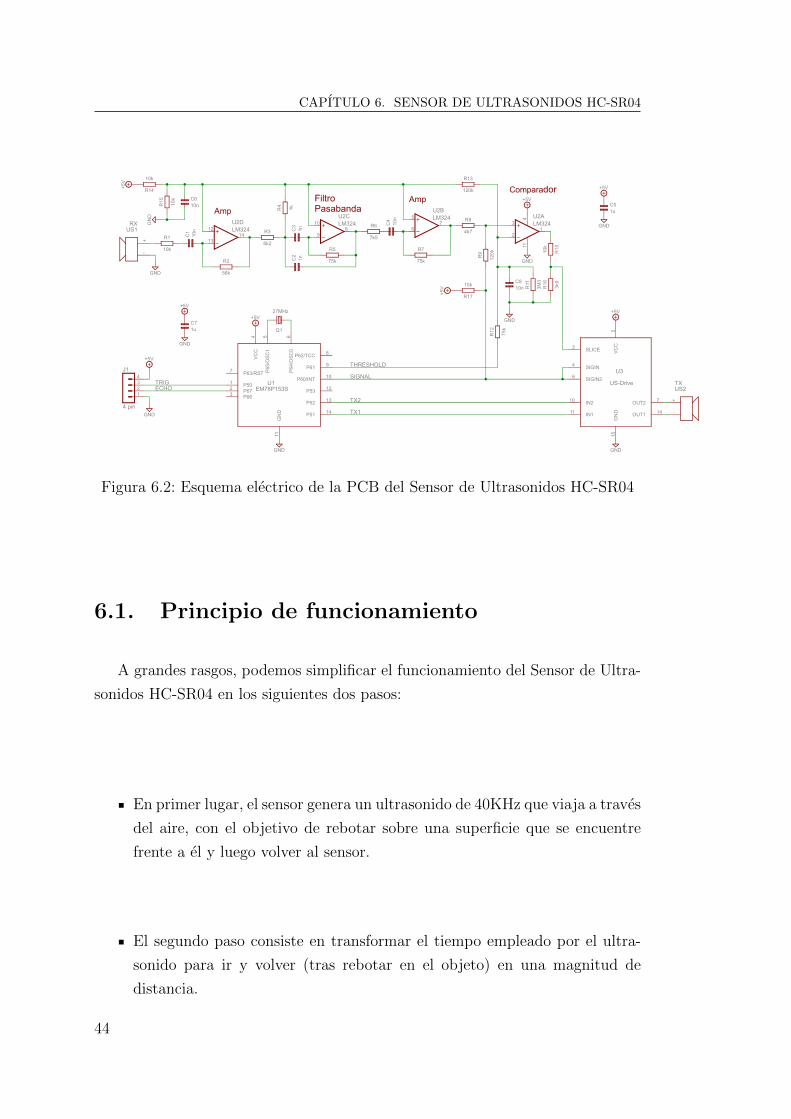
Esquema electrico del sensor realizado mediante la herramienta de diseno de
circuitos en lınea EasyEda [6] y usando de modelo el esquema electrico presente
en el estudio del sensor HC-SR04 realizado por Ajoy Raman [24].
43
CAPITULO 6. SENSOR DE ULTRASONIDOS HC-SR04
RX
TX
4 pin
10k
56k
6k2
1k
75k
7k5
75k
4k7
120k 10
k3M
3
10n
1n1n
10n
1u10n
1u
10n
+5V
+5V
+5V
+5V
+5V
+5V27MHz
LM324LM324
LM324LM324
75k
120k
10k10
k
3k910k
+5V
EM78P153S
+5V
US-Drive
+
-
US1
US2
+
-GND
GND
GND
GND
J1
1234
R1
R2
R3
R4
R5
R6
R7
R8
R9 R
10
R11
C1
C2
C3 C
4
C5C6
C7
C8
Q1
U2A
2
31
411
U2B
6
57
U2C
9
108
U2D
13
1214
GN
D
GND
GNDGND
GND
R12
R13
R14
R15
R16
R17
VCC
4
P65/
OSC
15
P64/
OSC
06
P62/TCC 8
P61 9
P60/INT 10
P53 12
P52 13
P51 14
GN
D11
P63/RST7
P501
P672
P663
U1
VCC
5G
ND
15
OUT2 7
OUT1 14
IN210
IN111
SIGIN26
SIGIN4
SLICE3
U3THRESHOLD
SIGNALTRIGECHO
TX2
TX1
AmpAmpFiltro
Pasabanda
Comparador
Figura 6.2: Esquema electrico de la PCB del Sensor de Ultrasonidos HC-SR04
6.1. Principio de funcionamiento
A grandes rasgos, podemos simplificar el funcionamiento del Sensor de Ultra-
sonidos HC-SR04 en los siguientes dos pasos:
En primer lugar, el sensor genera un ultrasonido de 40KHz que viaja a traves
del aire, con el objetivo de rebotar sobre una superficie que se encuentre
frente a el y luego volver al sensor.
El segundo paso consiste en transformar el tiempo empleado por el ultra-
sonido para ir y volver (tras rebotar en el objeto) en una magnitud de
distancia.
44

CAPITULO 6. SENSOR DE ULTRASONIDOS HC-SR04
Figura 6.3: Principio de funcionamiento del Sensor de Ultrasonidos HC-SR04
Para realizar el proceso descrito anteriormente, debemos tener en cuenta los
siguientes elementos:
Trigger Pin: Se trata de entrada digital del sensor, la cual debemos mantener
activa (HIGH) durante 10µs para que se genere el ultrasonido de 40000Hz.
Echo Pin: Es una salida digital del sensor. Su funcion consiste en esperar a
que el ultrasonido generado vuelva al dispositivo tras rebotar en un objeto
y luego, mantenerse activo (HIGH) el tiempo que tardo dicho ultrasonido
en realizar el recorrido de ida y vuelta.
Para transformar el tiempo que devuelve el Echo Pin a una unidad de distan-
cia, simplemente se debe conocer la velocidad de una onda en el aire:
DISTANCIA = VELOCIDAD · TIEMPO (6.1)
En la practica, debemos dividir el resultado de la ecuacion anterior entre 2,
ya que el tiempo utilizado en la formula es un recorrido de ida y vuelta. Tambien
debemos tener en cuenta que la velocidad del sonido depende de la temperatura
ambiente.
45

CAPITULO 6. SENSOR DE ULTRASONIDOS HC-SR04
6.2. Resumen de las principales caracterısticas
Tabla 6.2: Principales caracterısticas del Sensor de Ultrasonidos HC-SR04
SALIDA DIGITAL
PRINCIPIO DE FUNCIONAMIENTO EMISION Y RECEPCION DE ONDA DE ULTRASONIDOS
FRECUENCIA ULTRASONIDO 40KHz
ALIMENTACION 5V
ANGULO DE TRABAJO EFECTIVO 15º
RANGO DE DISTANCIAS MEDIBLE 4-400CM
RESOLUCION 0.3CM
6.3. Metodo de calibracion del Sensor de Ultra-
sonidos HC-SR04
Para poder determinar la exactitud y precision del Sensor de Ultrasonidos
HC-SR04 se ha realizado el siguiente ensayo:
Se han dispuesto unas tablas de madera sobre una superficie plana (suelo)
a modo de plataforma, y se han fijado unas cintas metricas a su superficie
como medida correspondiente de un patron de referencia. Dichas cintas
suman una distancia total de 400cm y tienen una resolucion mınima de
1mm.
Se ha centrado y fijado el Sensor de Ultrasonidos en un extremo de la
plataforma mediante pegamento y cinta adhesiva.
Se ha colocado una tabla de madera negra delante del sensor como elemento
sobre el que debe rebotar la onda emitida por el mismo. Esta tabla ha de
estar paralela al sensor.
Empezando por 4cm (fondo de escala inferior del sensor), se ha ido moviendo
la tabla negra a razon de un centımetro por medicion. Por lo tanto se han
realizado 397 mediciones espaciadas entre sı 1cm. En cada punto a medir
se toman 50 muestras, estableciendo como medida representativa la media
estadıstica de las mismas.
46

CAPITULO 6. SENSOR DE ULTRASONIDOS HC-SR04
Las condiciones del ensayo han sido las siguientes:
Temperatura ambiente: 26.8ºC (+/- 0.5ºC)
Humedad Relativa: 60 %
Altitud: 29m
Resolucion: 1cm
Tiempo de muestreo: muestras recogidas cada 100 milisegundos (50 mues-
tras para cada medicion)
Rango de calibracion: 4cm a 400cm
Tras obtener todos los datos, se han procesado en el software MATLAB para
poder generar diferentes graficas y ecuaciones que describan el comportamiento
del sensor.
(a) Sensor de Ultrasonidos HC-
SR04 en la plataforma
(b) Sensor de Ultrasonidos HC-
SR04 en la plataforma desde otro
angulo
(c) Plataforma con cintas metricas y tabla utilizada como objeto
contra el que rebotar
Figura 6.4: Entorno de calibracion del Sensor de Ultrasonidos HC-SR04
47

CAPITULO 6. SENSOR DE ULTRASONIDOS HC-SR04
6.4. Resultados
Tras haber realizado las mediciones correspondientes con el Sensor de Ultra-
sonidos HC-SR04, se han recogido todos los datos en una tabla (anexo A.1). De
dicha tabla podemos obtener las siguientes graficas que caracterizan el compor-
tamiento del sensor:
6.4.1. Recta de Calibracion
Despejamos de la ecuacion 6.2 la t, siendo esta el tiempo que tarda la onda
de ultrasonidos en ir hasta el objeto, rebotar y volver al sensor:
t =Distancia · 20000
υ(6.2)
donde: υ(m/s) = 331,3 + (0,606 · TAIRE)
Como podemos ver, la velocidad del sonido es dependiente de la temperatura
del aire (ambiente), por lo que siempre se ha de ajustar este parametro antes de
realizar cualquier medicion.
Figura 6.5: Recta de calibracion para el Sensor de Ultrasonidos HC-SR04
6.4.2. Desviacion Tıpica
A continuacion se muestra las grafica de la Desviacion Tıpica presente para
cada grupo de 50 muestras (tomadas cada centımetro en un rango de 4cm a 4m):
48
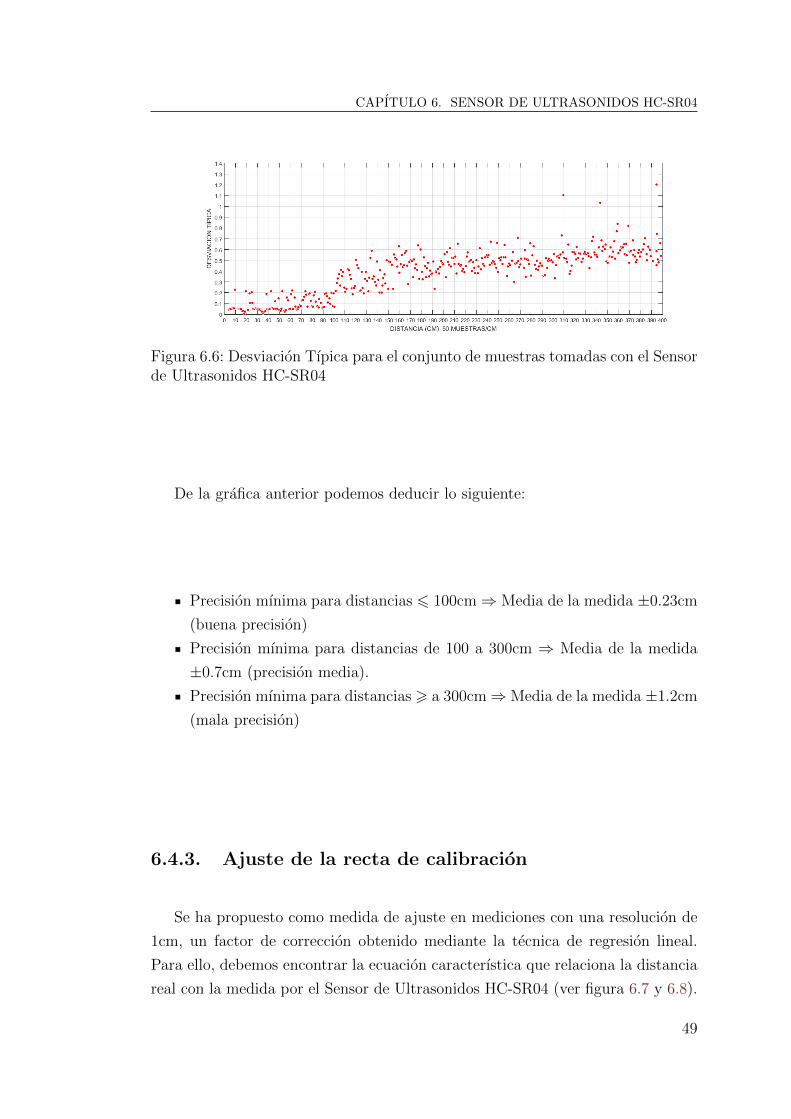
CAPITULO 6. SENSOR DE ULTRASONIDOS HC-SR04
Figura 6.6: Desviacion Tıpica para el conjunto de muestras tomadas con el Sensorde Ultrasonidos HC-SR04
De la grafica anterior podemos deducir lo siguiente:
Precision mınima para distancias 6 100cm⇒ Media de la medida ±0.23cm
(buena precision)
Precision mınima para distancias de 100 a 300cm ⇒ Media de la medida
±0.7cm (precision media).
Precision mınima para distancias > a 300cm⇒Media de la medida ±1.2cm
(mala precision)
6.4.3. Ajuste de la recta de calibracion
Se ha propuesto como medida de ajuste en mediciones con una resolucion de
1cm, un factor de correccion obtenido mediante la tecnica de regresion lineal.
Para ello, debemos encontrar la ecuacion caracterıstica que relaciona la distancia
real con la medida por el Sensor de Ultrasonidos HC-SR04 (ver figura 6.7 y 6.8).
49
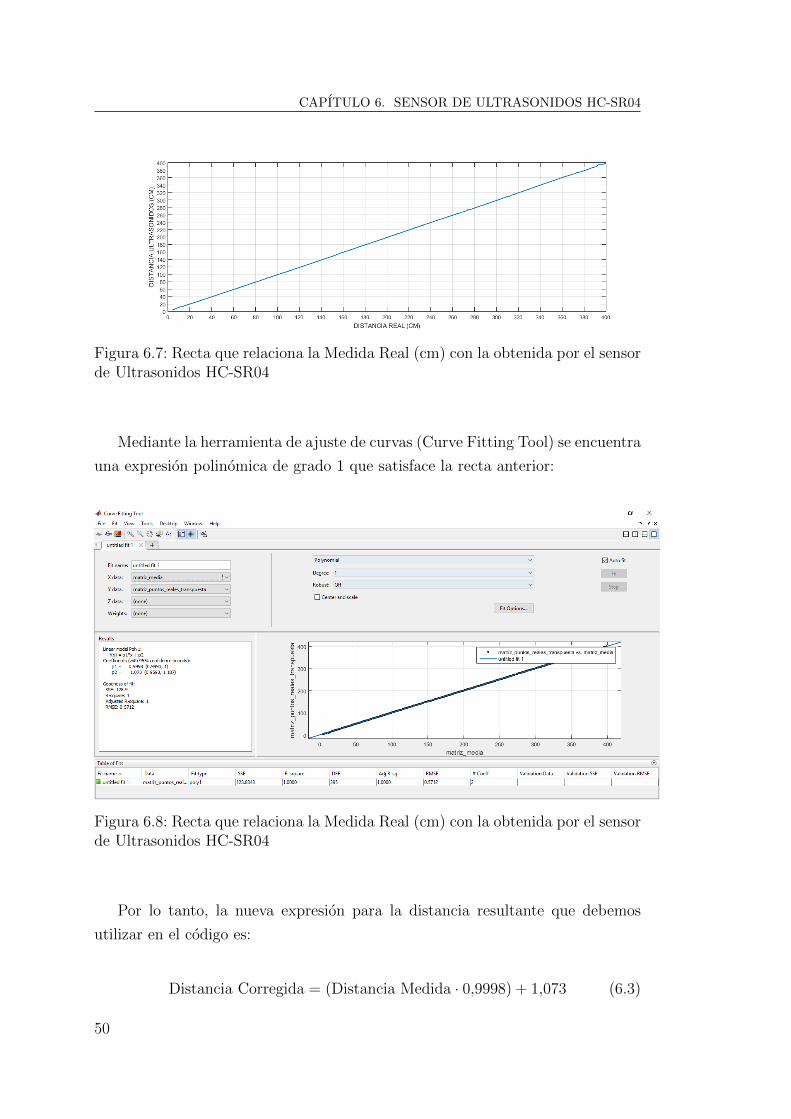
CAPITULO 6. SENSOR DE ULTRASONIDOS HC-SR04
Figura 6.7: Recta que relaciona la Medida Real (cm) con la obtenida por el sensorde Ultrasonidos HC-SR04
Mediante la herramienta de ajuste de curvas (Curve Fitting Tool) se encuentra
una expresion polinomica de grado 1 que satisface la recta anterior:
Figura 6.8: Recta que relaciona la Medida Real (cm) con la obtenida por el sensorde Ultrasonidos HC-SR04
Por lo tanto, la nueva expresion para la distancia resultante que debemos
utilizar en el codigo es:
Distancia Corregida = (Distancia Medida · 0,9998) + 1,073 (6.3)
50
CAPITULO 6. SENSOR DE ULTRASONIDOS HC-SR04
6.4.4. Discusion de los resultados
En el apartado de resultados de la calibracion del Sensor de Ultrasonidos HC-
SR04 se ha obtenido una ecuacion para redefinir el resultado de la distancia que
nos devuelve el dicho sensor (Ver ecuacion 6.3). Dependiendo del uso (rango de
distancias a medir) que se le quiera dar al sensor, se recomienda o no utilizar este
ajuste:
Si el objeto que queremos medir se encuentra en un rango de entre 4cm y
≈ 25cm, se recomienda no utilizar el ajuste, pues los datos que devuelve el
sensor en este rango tienen una precision suficiente, y el uso de la ecuacion
6.3 solo empeorarıa el dicha precision.
Si el objeto a medir esta situado en un rango de entre 25cm y 400cm, se
recomienda utilizar la ecuacion 6.3 como factor de ajuste para mejorar la
precision.
51

CAPITULO 7. SENSOR DE HUMEDAD KEYES KY-015
7. Sensor de Humedad KEYES KY-
015
El Sensor de Humedad KEYES KY-015 es capaz de medir la humedad rela-
tiva presente en su entorno y generar un dato digital en un valor de tanto por
ciento ( %). Se basa en las propiedades de absorcion de la humedad con las que
cuentan ciertos compuestos salinos, haciendo variar el voltaje entre dos electros
en contacto con su superficie. El fabricante asegura una precision de ± 5 % HR,
con una resolucion de 1 % HR. Para mas informacion (anexo C.5 y tabla 7.2).
Figura 7.1: Sensor de Humedad y Temperatura KEYES KY-015
Tabla 7.1: Componentes y patillaje del Sensor de Humedad y Temperatura KE-YES KY-015
NUMERO DE
IDENTIFICACIONDESCRIPCION DEL ELEMENTO
1 Modulo DHT11 para la medicion de temperatura y humedad
2 Resistencia de 10KΩ
3 Resistencia de 1KΩ
4 Diodo LED
5 Patilla GND ⇒ Tierra
6 Patilla central DATA ⇒ Salida Digital VD (16Bit)
7 Patilla VCC ⇒ Alimentacion (VIN)
Esquema electrico del sensor realizado mediante la ayuda del multımetro Pro-
52
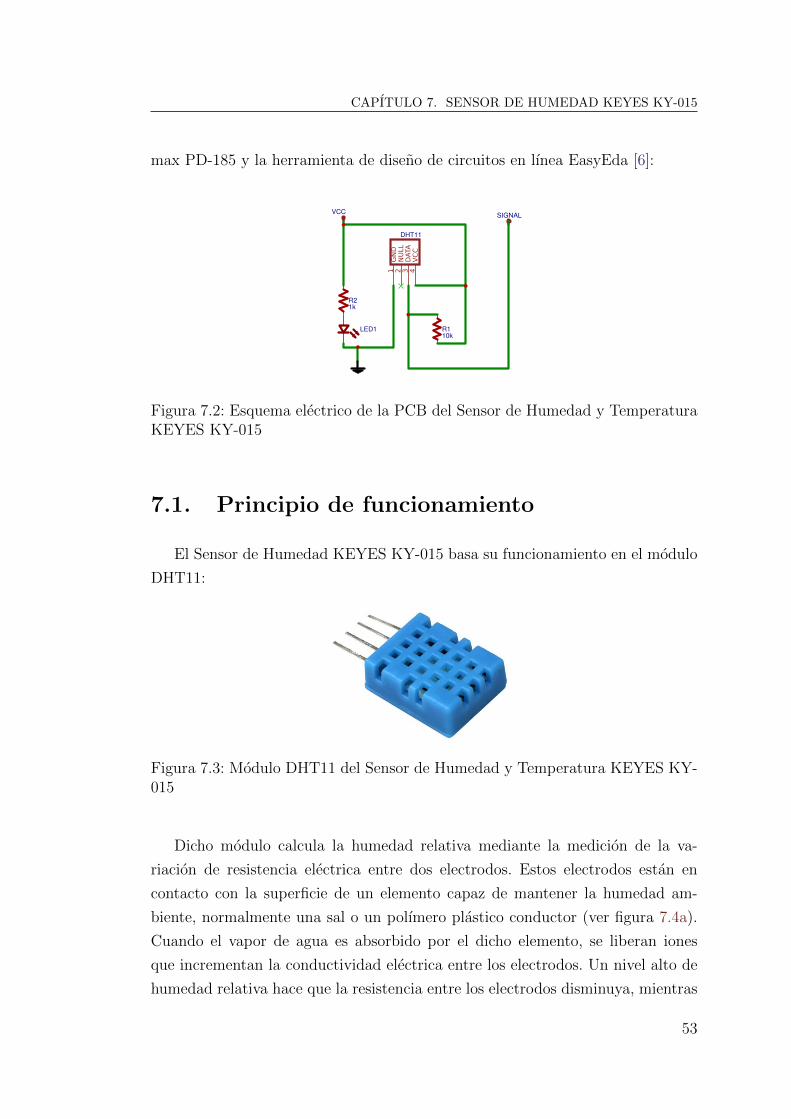
CAPITULO 7. SENSOR DE HUMEDAD KEYES KY-015
max PD-185 y la herramienta de diseno de circuitos en lınea EasyEda [6]:A A
B B
C C
D D
1
1
2
2
3
3
4
4
5
5
TITLE:
New Schematic REV: 1.0
Date: 2018-08-22 Sheet: 1/1
EasyEDA V5.4.11 Drawn By: sawan.sgg
DHT11
GN
D1
NU
LL2
DATA
3
VC
C4
10kR1
1kR2
VCC SIGNAL
LED1
Figura 7.2: Esquema electrico de la PCB del Sensor de Humedad y TemperaturaKEYES KY-015
7.1. Principio de funcionamiento
El Sensor de Humedad KEYES KY-015 basa su funcionamiento en el modulo
DHT11:
Figura 7.3: Modulo DHT11 del Sensor de Humedad y Temperatura KEYES KY-015
Dicho modulo calcula la humedad relativa mediante la medicion de la va-
riacion de resistencia electrica entre dos electrodos. Estos electrodos estan en
contacto con la superficie de un elemento capaz de mantener la humedad am-
biente, normalmente una sal o un polımero plastico conductor (ver figura 7.4a).
Cuando el vapor de agua es absorbido por el dicho elemento, se liberan iones
que incrementan la conductividad electrica entre los electrodos. Un nivel alto de
humedad relativa hace que la resistencia entre los electrodos disminuya, mientras
53
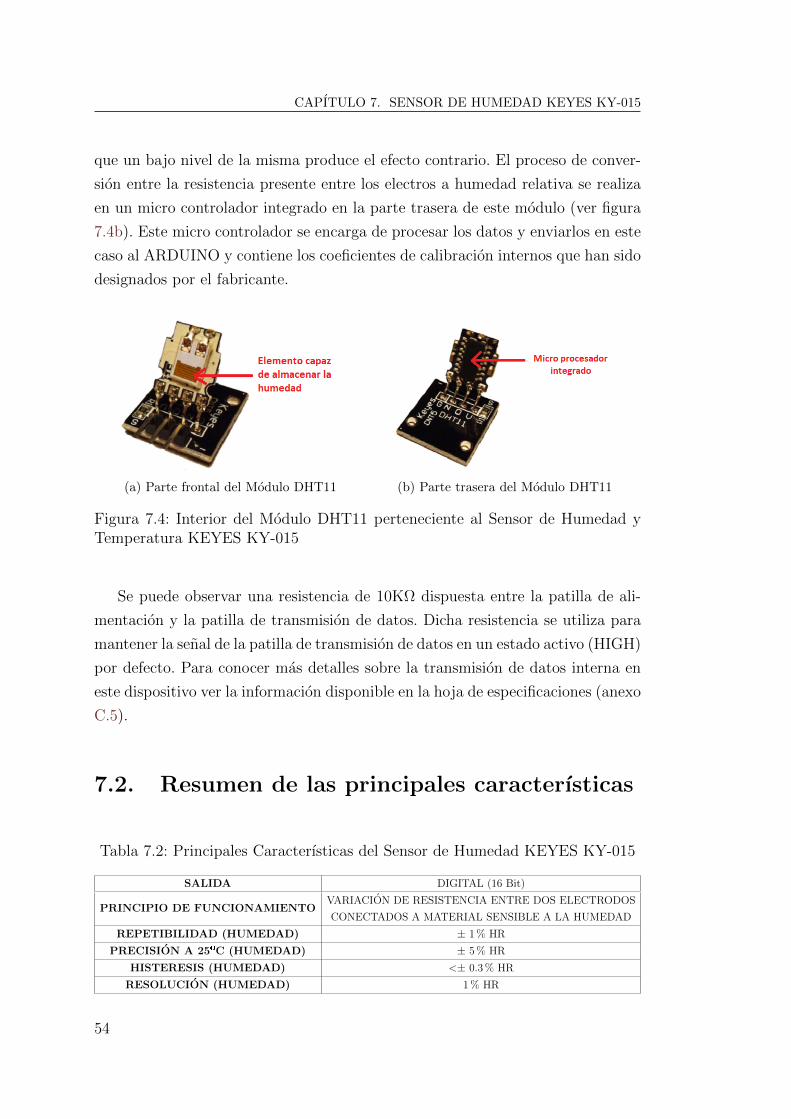
CAPITULO 7. SENSOR DE HUMEDAD KEYES KY-015
que un bajo nivel de la misma produce el efecto contrario. El proceso de conver-
sion entre la resistencia presente entre los electros a humedad relativa se realiza
en un micro controlador integrado en la parte trasera de este modulo (ver figura
7.4b). Este micro controlador se encarga de procesar los datos y enviarlos en este
caso al ARDUINO y contiene los coeficientes de calibracion internos que han sido
designados por el fabricante.
(a) Parte frontal del Modulo DHT11 (b) Parte trasera del Modulo DHT11
Figura 7.4: Interior del Modulo DHT11 perteneciente al Sensor de Humedad yTemperatura KEYES KY-015
Se puede observar una resistencia de 10KΩ dispuesta entre la patilla de ali-
mentacion y la patilla de transmision de datos. Dicha resistencia se utiliza para
mantener la senal de la patilla de transmision de datos en un estado activo (HIGH)
por defecto. Para conocer mas detalles sobre la transmision de datos interna en
este dispositivo ver la informacion disponible en la hoja de especificaciones (anexo
C.5).
7.2. Resumen de las principales caracterısticas
Tabla 7.2: Principales Caracterısticas del Sensor de Humedad KEYES KY-015
SALIDA DIGITAL (16 Bit)
PRINCIPIO DE FUNCIONAMIENTOVARIACION DE RESISTENCIA ENTRE DOS ELECTRODOS
CONECTADOS A MATERIAL SENSIBLE A LA HUMEDAD
REPETIBILIDAD (HUMEDAD) ± 1 % HR
PRECISION A 25ºC (HUMEDAD) ± 5 % HR
HISTERESIS (HUMEDAD) <± 0.3 % HR
RESOLUCION (HUMEDAD) 1 % HR
54
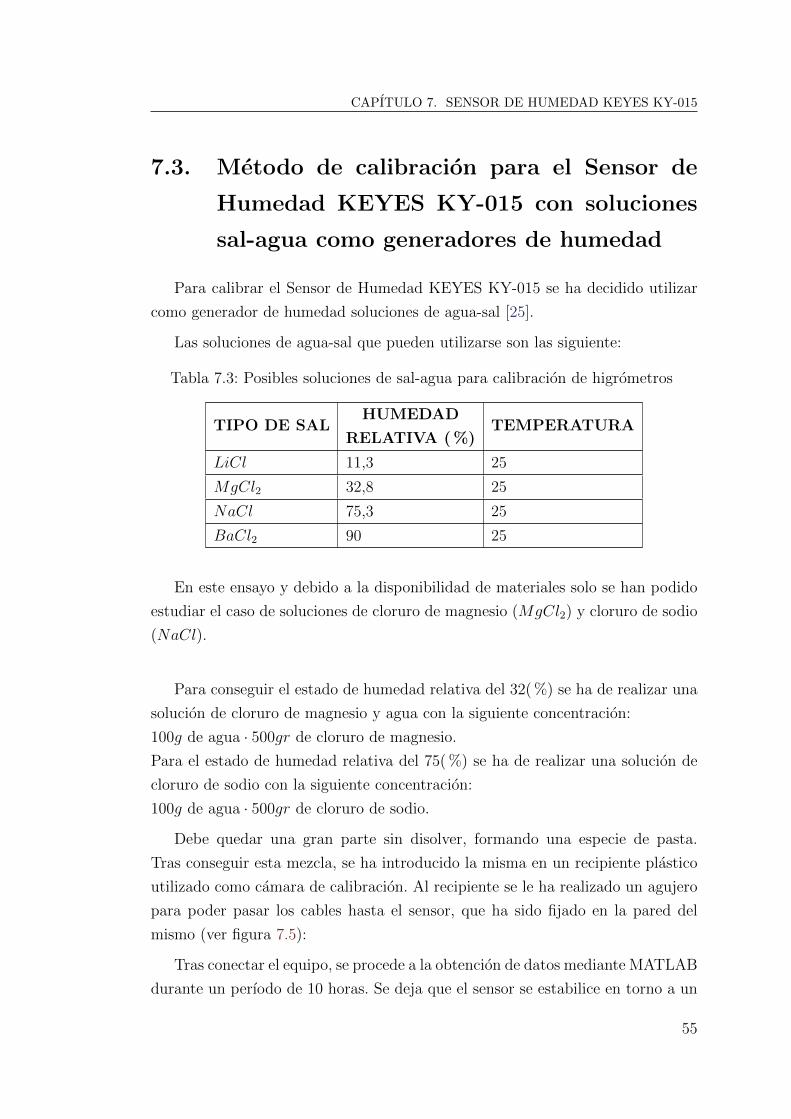
CAPITULO 7. SENSOR DE HUMEDAD KEYES KY-015
7.3. Metodo de calibracion para el Sensor de
Humedad KEYES KY-015 con soluciones
sal-agua como generadores de humedad
Para calibrar el Sensor de Humedad KEYES KY-015 se ha decidido utilizar
como generador de humedad soluciones de agua-sal [25].
Las soluciones de agua-sal que pueden utilizarse son las siguiente:
Tabla 7.3: Posibles soluciones de sal-agua para calibracion de higrometros
TIPO DE SALHUMEDAD
RELATIVA ( %)TEMPERATURA
LiCl 11,3 25
MgCl2 32,8 25
NaCl 75,3 25
BaCl2 90 25
En este ensayo y debido a la disponibilidad de materiales solo se han podido
estudiar el caso de soluciones de cloruro de magnesio (MgCl2) y cloruro de sodio
(NaCl).
Para conseguir el estado de humedad relativa del 32( %) se ha de realizar una
solucion de cloruro de magnesio y agua con la siguiente concentracion:
100g de agua · 500gr de cloruro de magnesio.
Para el estado de humedad relativa del 75( %) se ha de realizar una solucion de
cloruro de sodio con la siguiente concentracion:
100g de agua · 500gr de cloruro de sodio.
Debe quedar una gran parte sin disolver, formando una especie de pasta.
Tras conseguir esta mezcla, se ha introducido la misma en un recipiente plastico
utilizado como camara de calibracion. Al recipiente se le ha realizado un agujero
para poder pasar los cables hasta el sensor, que ha sido fijado en la pared del
mismo (ver figura 7.5):
Tras conectar el equipo, se procede a la obtencion de datos mediante MATLAB
durante un perıodo de 10 horas. Se deja que el sensor se estabilice en torno a un
55
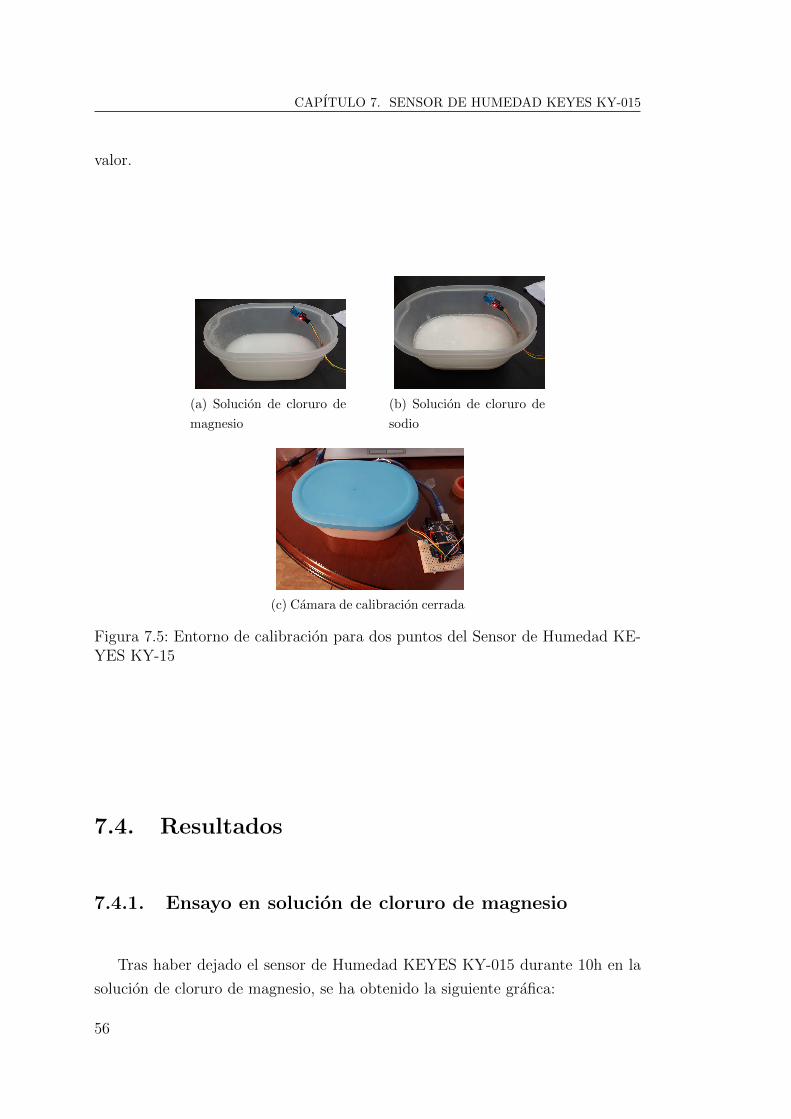
CAPITULO 7. SENSOR DE HUMEDAD KEYES KY-015
valor.
(a) Solucion de cloruro de
magnesio
(b) Solucion de cloruro de
sodio
(c) Camara de calibracion cerrada
Figura 7.5: Entorno de calibracion para dos puntos del Sensor de Humedad KE-YES KY-15
7.4. Resultados
7.4.1. Ensayo en solucion de cloruro de magnesio
Tras haber dejado el sensor de Humedad KEYES KY-015 durante 10h en la
solucion de cloruro de magnesio, se ha obtenido la siguiente grafica:
56
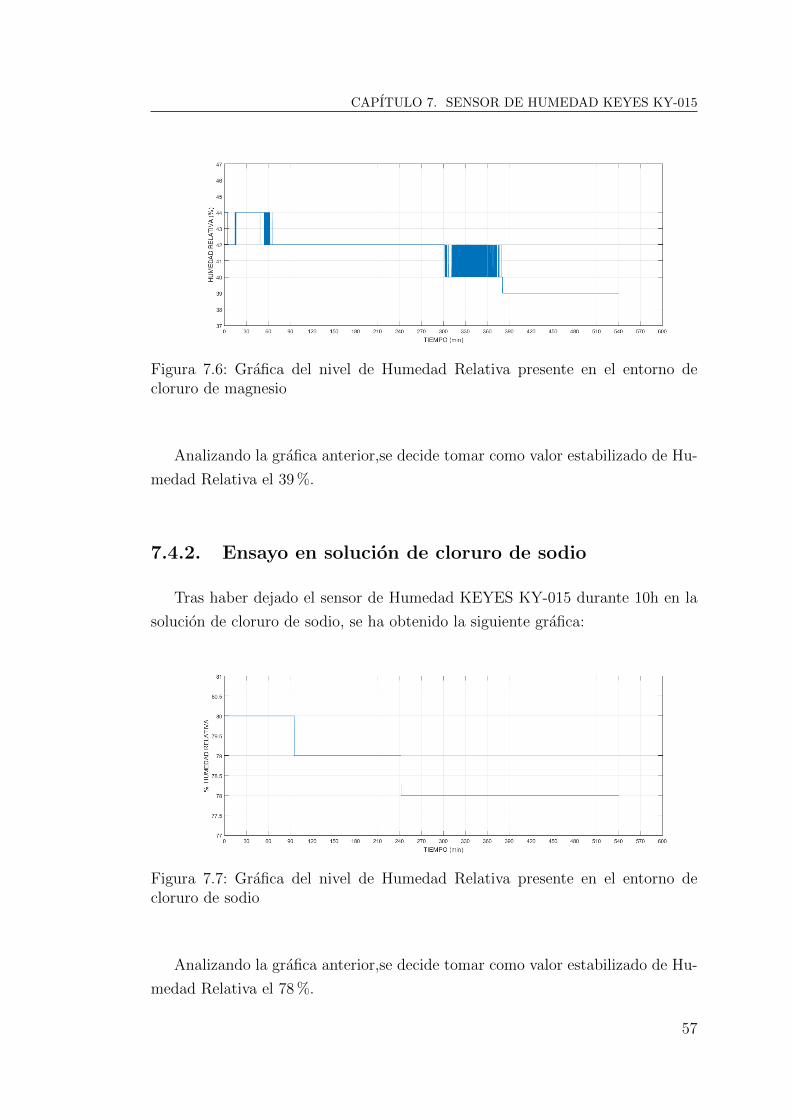
CAPITULO 7. SENSOR DE HUMEDAD KEYES KY-015
Figura 7.6: Grafica del nivel de Humedad Relativa presente en el entorno decloruro de magnesio
Analizando la grafica anterior,se decide tomar como valor estabilizado de Hu-
medad Relativa el 39 %.
7.4.2. Ensayo en solucion de cloruro de sodio
Tras haber dejado el sensor de Humedad KEYES KY-015 durante 10h en la
solucion de cloruro de sodio, se ha obtenido la siguiente grafica:
Figura 7.7: Grafica del nivel de Humedad Relativa presente en el entorno decloruro de sodio
Analizando la grafica anterior,se decide tomar como valor estabilizado de Hu-
medad Relativa el 78 %.
57

CAPITULO 7. SENSOR DE HUMEDAD KEYES KY-015
7.4.3. Ajuste de la ecuacion de salida
Como proceso final en la calibracion del Sensor de Humedad KEYES KY-015
y asumiendo un comportamiento lineal dentro del rango estudiado, se propone
crear un factor de correccion que ajuste mejor los resultados practicos con los
teoricos.
En primer lugar visualizamos graficamente el ajuste que deseamos:
Figura 7.8: Grafica del nivel de humedad relativa ( %) teorico frente al recogidopor el Sensor de Humedad KEYES KY-015
Utilizando la herramienta de ajuste de curvas de MATLAB (Curve Fitting
Tool) obtenemos la ecuacion de la recta caracterıstica, procediendo a corregir el
valor de salida del sensor:
HR Corregida = HR Medida · 1,103− 11 (7.1)
58
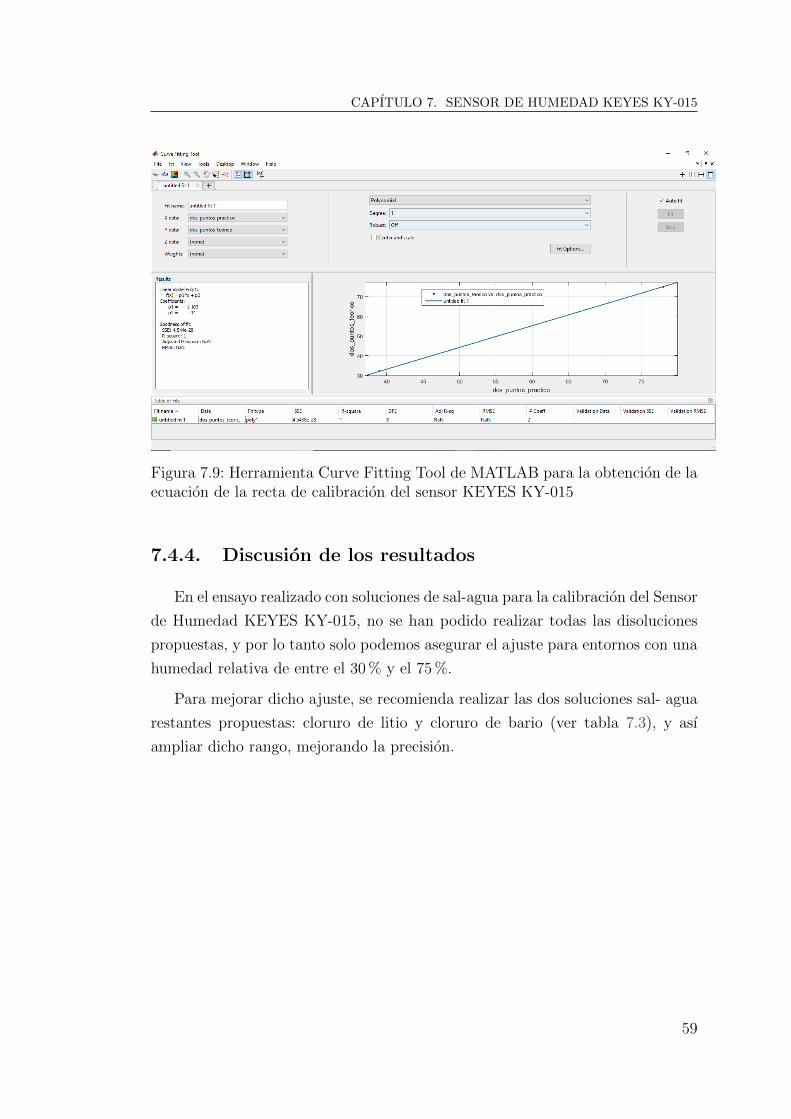
CAPITULO 7. SENSOR DE HUMEDAD KEYES KY-015
Figura 7.9: Herramienta Curve Fitting Tool de MATLAB para la obtencion de laecuacion de la recta de calibracion del sensor KEYES KY-015
7.4.4. Discusion de los resultados
En el ensayo realizado con soluciones de sal-agua para la calibracion del Sensor
de Humedad KEYES KY-015, no se han podido realizar todas las disoluciones
propuestas, y por lo tanto solo podemos asegurar el ajuste para entornos con una
humedad relativa de entre el 30 % y el 75 %.
Para mejorar dicho ajuste, se recomienda realizar las dos soluciones sal- agua
restantes propuestas: cloruro de litio y cloruro de bario (ver tabla 7.3), y ası
ampliar dicho rango, mejorando la precision.
59

CAPITULO 8. SENSOR DE CAMPO MAGNETICO KEYES KY-035
8. Sensor de Campo Magnetico KE-
YES KY-035
El Sensor de Campo Magnetico KEYES KY-035 es capaz de devolver un vol-
taje (0V a 5V) proporcional a la intensidad de campo magnetico en su superficie.
El principio de funcionamiento de este sensor esta basado en el efecto hall. El
fabricante nos asegura un comportamiento lineal para todo su rango de medida
(-100mT a 100mT). Para mas informacion (anexo C.6 y tabla 8.2).
Figura 8.1: Sensor de Campo Magnetico KEYES KY-035
Tabla 8.1: Componentes y patillaje del Sensor de Campo Magnetico KEYESKY-035
NUMERO DE
IDENTIFICACIONDESCRIPCION DEL ELEMENTO
1 Modulo sensor de campo magnetico SS49E
2 Patilla con el sımbolo ”− ” ⇒ Tierra (GND)
3 Patilla central ⇒ Alimentacion VCC
4 Patilla con el sımbolo ”S”⇒ Tension de salida VOUT
Esquema electrico del sensor realizado mediante la ayuda del multımetro Pro-
60

CAPITULO 8. SENSOR DE CAMPO MAGNETICO KEYES KY-035
max PD-185 y la herramienta de diseno de circuitos en lınea EasyEda [6]:
A A
B B
C C
D D
1
1
2
2
3
3
4
4
5
5
TITLE:
New Schematic REV: 1.0
Date: 2018-08-22 Sheet: 1/1
EasyEDA V5.4.11 Drawn By: sawan.sgg
E49 Hall sensor
VCC1
GN
D2
SIGNAL 3
VCC SIGNAL
Figura 8.2: Esquema electrico de la PCB del Sensor de Campo Magnetico KEYESKY-035
8.1. Principio de funcionamiento
El componente principal del Sensor de Campo Magnetico KEYES KY-015 es
el encapsulado SS49E. Este componente utiliza como principio fısico las carac-
terısticas del Efecto Hall. El sensor cuenta con tres patillas: una de alimentacion,
una de tierra y una de salida analogica de voltaje. Esta ultima es la que nos
proporciona la relacion con el campo magnetico a medir y tiene las siguientes
caracterısticas:
En ausencia de campo magnetico, por la patilla de salida analogica obten-
dremos aproximadamente la mitad del voltaje suministrado por la fuente
de alimentacion.
Si aproximamos el polo sur de un iman al encapsulado SS49E por la cara
donde tiene los grabados que lo identifican, el voltaje proporcionado por
el sensor aumentara de forma proporcional a la intensidad de dicho campo
magnetico.
Si aproximamos el polo norte de un iman al encapsulado SS49E por la cara
donde tiene los grabados que lo identifican, el voltaje proporcioando por
el sensor disminuira de forma proporcional a la intensidad de dicho campo
magnetico.
61

CAPITULO 8. SENSOR DE CAMPO MAGNETICO KEYES KY-035
El comportamiento explicado en los dos puntos anteriores invierte su fun-
cionamiento si en vez de aproximar el iman a la superficie con grabados, lo
aproximamos a la otra cara del sensor (sin grabados).
8.1.1. Efecto Hall
Si una corriente electrica fluye a traves de un conductor situado en un cam-
po magnetico, este campo ejerce una fuerza transversal sobre los portadores de
cargas moviles, que tiende a empujarlas hacia un lado del conductor. Esto es
mas evidente en un conductor plano delgado como el mostrado en la figura 8.3.
La acumulacion de cargas en los lados del conductor, equilibrara esta influencia
magnetica, produciendo un voltaje medible entre los dos lados del conductor. La
presencia de este voltaje transversal medible se llama efecto Hall en honor de
Edwin Herbert Hall que lo descubrio en 1879.
El voltaje Hall esta dado por:
VHALL = I · B
(n · e · d)(8.1)
Donde:
VH = Voltaje de Efecto Hall
I = Corriente electrica que atraviesa el conductor
B = Campo magnetico
n = Densidad de los portadores de carga
e = Carga de un electron
d = Grosor del conductor
Figura 8.3: Efecto Hall sobre un conductor
62

CAPITULO 8. SENSOR DE CAMPO MAGNETICO KEYES KY-035
8.2. Resumen de las principales caracterısticas
Tabla 8.2: Principales caracterısticas del Sensor de Campo Magnetico KEYESKY-035
SALIDA ANALOGICA
PRINCIPIO DE FUNCIONAMIENTO EFECTO HALL
ALIMENTACION (MIN/MAX) 3V A 6V
RANGO VOLTAJE DE SALIDA (MIN/MAX) 1V A 5V
RESOLUCION VOLTAJE DE SALIDA 0.01V
RANGO DE INTENSIDAD DE
CAMPO MAGNETICO MEDIBLE (MIN/MAX)-100mT a 100mT
RANGO DE TEMPERATURA DE TRABAJO (MIN/MAX) -40ºC a 150ºC
TIPO DE ENCAPSULADO TO-92
8.3. Metodo de Caracterizacion del Sensor de
Campo Magnetico KEYES KY-035
En este ensayo se ha tratado de probar las especificaciones tecnicas aportadas
por el fabricante (Ver referencia X) y establecer una ecuacion caracterıstica que
nos defina la relacion entre el voltaje entregado por el sensor y campo magnetico
presente en su entorno.
Para ello, se ha generado una grafica con la recta de calibracion teorica. Con
esta recta y mediante la ayuda de la herramienta de MATLAB para el ajuste de
rectas y curvas (Curve Fitting Tool), podemos obtener una ecuacion que nos de
la relacion entre el voltaje de salida y el campo magnetico detectado por el sensor.
Una vez tenemos una ecuacion caracterıstica, procedemos a calcular el OFF-
SET (Variacion entre el voltaje teorico y el voltaje experimental en ausencia
campos magneticos). Con este objetivo, colocamos el sensor KEYES KY-035 en
una plataforma y lo fijamos al suelo mediante un adhesivo. Despejamos la zo-
na de cualquier objetivo metalico que pueda interferir en nuestras mediciones
y acto seguido procedemos a realizar la toma de muestras. Se toman 201 mues-
tras y se establece como medida representativa la media aritmetica de las mismas.
63
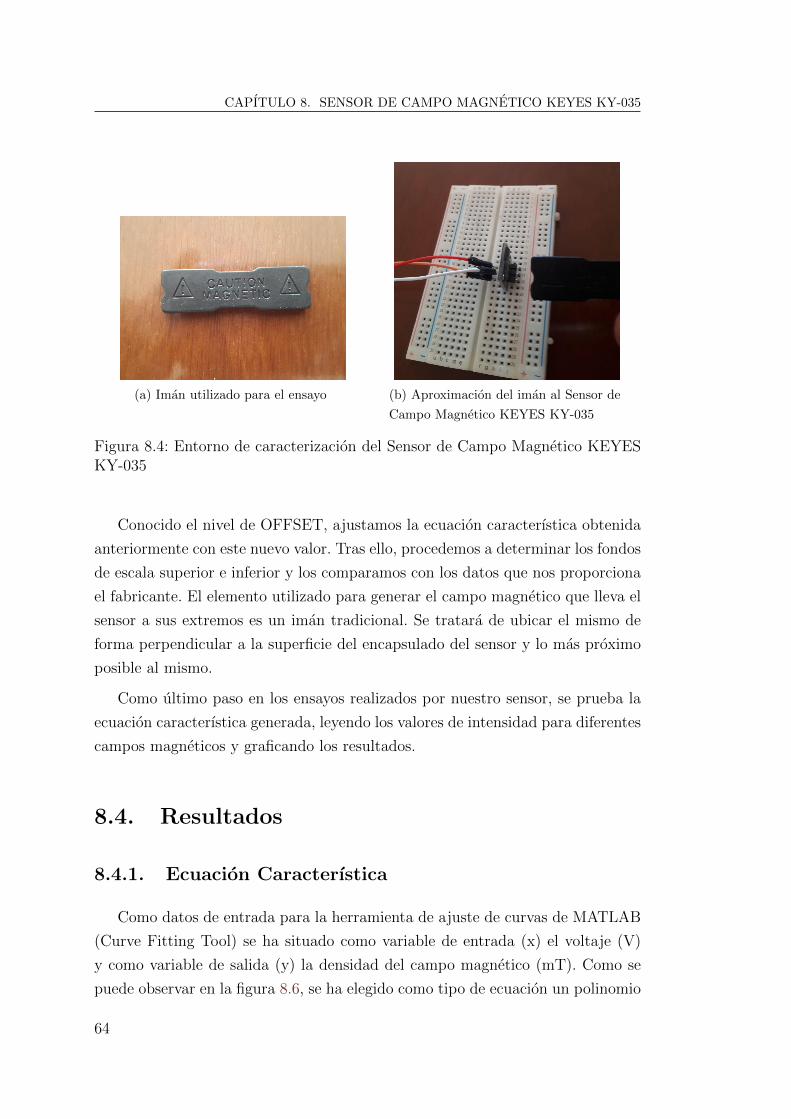
CAPITULO 8. SENSOR DE CAMPO MAGNETICO KEYES KY-035
(a) Iman utilizado para el ensayo (b) Aproximacion del iman al Sensor de
Campo Magnetico KEYES KY-035
Figura 8.4: Entorno de caracterizacion del Sensor de Campo Magnetico KEYESKY-035
Conocido el nivel de OFFSET, ajustamos la ecuacion caracterıstica obtenida
anteriormente con este nuevo valor. Tras ello, procedemos a determinar los fondos
de escala superior e inferior y los comparamos con los datos que nos proporciona
el fabricante. El elemento utilizado para generar el campo magnetico que lleva el
sensor a sus extremos es un iman tradicional. Se tratara de ubicar el mismo de
forma perpendicular a la superficie del encapsulado del sensor y lo mas proximo
posible al mismo.
Como ultimo paso en los ensayos realizados por nuestro sensor, se prueba la
ecuacion caracterıstica generada, leyendo los valores de intensidad para diferentes
campos magneticos y graficando los resultados.
8.4. Resultados
8.4.1. Ecuacion Caracterıstica
Como datos de entrada para la herramienta de ajuste de curvas de MATLAB
(Curve Fitting Tool) se ha situado como variable de entrada (x) el voltaje (V)
y como variable de salida (y) la densidad del campo magnetico (mT). Como se
puede observar en la figura 8.6, se ha elegido como tipo de ecuacion un polinomio
64

CAPITULO 8. SENSOR DE CAMPO MAGNETICO KEYES KY-035
de grado 1. La ecuacion caracterıstica resultante es la siguiente:
Campo Mangetico(mT) = 66,67 · VOUT − 166,7 (8.2)
Mediante esta ecuacion ya tenemos un valor de campo magnetico asociado al
voltaje que devuelve el sensor.
Figura 8.5: Herramienta (Curve Fitting Tool) de MATLAB para la generacion deecuaciones caracterısticas
8.4.2. Nivel de OFFSET
Se estudia el voltaje que devuelve el sensor en ausencia de campo magnetico:
65

CAPITULO 8. SENSOR DE CAMPO MAGNETICO KEYES KY-035
Figura 8.6: Recta teorica de calibracion del Sensor de Campo Magnetico KEYESKY-035 con OFFSET real
Como se puede observar, teoricamente cuando no hay presencia de campo
magnetico el voltaje de salida deberıa ser 2.5V. En nuestro ensayo experimental
se observa un voltaje de salida de 2.592V (media de las 201 muestras tomadas).
Por lo tanto establecemos el siguiente nivel de OFFSET:
OFFSET = V alorMedido− V alorReal = 2,592V − 2,5V = 0,092V
Debemos modificar el voltaje de salida para que se ajuste a el valor teorico.
VOUTMODIFICADO= VOUT − 0,092V
8.4.3. Fondos de escala
El fondo de escala superior y el fondo de escala inferior teoricos son los si-
guientes:
Fondo de Escala Superior = 4V ⇒ ≈ 100 mT
Fondo de Escala Inferior = 1V ⇒ ≈ -100 mT
Tras haber ajustado el valor de VOUT , se lleva el sensor a sus extremos, llegando
a los siguientes fondos de escala:
Fondo de Escala Superior = 4.2V ⇒ ≈ 113.31 mT
Fondo de Escala Inferior = 0.72V ⇒ ≈ -118.7 mT
66

CAPITULO 8. SENSOR DE CAMPO MAGNETICO KEYES KY-035
Por lo tanto,la nueva recta de calibracion queda definida de la siguiente ma-
nera:
Figura 8.7: Recta de calibracion real del Sensor de Campo Magnetico KEYESKY-035
8.4.4. Comprobacion y prueba de ajustes
En este ultimo apartado se prueba el sensor para diferentes aproximaciones de
un iman comun, viendo como nos devuelve a su vez un valor de campo magnetico
en miliTeslas (mT).
Figura 8.8: Prueba del Sensor de Campo Magnetico KEYES KY-035
Como se puede observar en la figura 8.8, cuando se pega el polo norte de un
iman a la cara con grabados del sensor, el valor de campo magnetico se va a su
lımite inferior (≈ −120mT , VOUT = 0.8V), y cuando realizamos lo mismo con el
polo sur, se va a su lımite superior (≈ 120mT , VOUT = 4.2V).
67

CAPITULO 8. SENSOR DE CAMPO MAGNETICO KEYES KY-035
8.4.5. Discusion de los resultados
El Sensor de Campo Magnetico KEYES KY-035 se ha usado comunmente
para detectar la presencia de campos magneticos, estimando la intensidad de los
mismos en funcion del voltaje recibido, pero sin especificar el valor de los mismos
en unidades medibles.
Tras realizar la caracterizacion propuesta en este documento, se cuenta con un
sensor que proporciona un dato de intensidad de campo magnetico real y cuanti-
ficable, pero con un coste economico bajo y por lo tanto amplıa sus posibilidades
de uso a proyectos con mayor alcance y necesidades.
El unico inconveniente observado durante todo el proceso de caracterizacion del
sensor, es que a veces, tras realizar mediciones de intensidad de campo magnetico
y luego retirar el iman, este se queda con cierta carga magnetica, pues sigue in-
dicando la presencia de flujo magnetico cuando no lo hay. Se ha contrastado que
el defecto se corrige agitando el sensor en el aire y golpeandolo suavemente, pero
no es un protocolo que se deba seguir habitualmente pues se acabarıa danando el
sensor.
68

CAPITULO 9. CONCLUSIONES/CONCLUSIONS
9. Conclusiones/Conclusions
9.1. Conclusiones
El presente Trabajo Fin de Grado versa sus contenidos sobre el analisis, carac-
terizacion y calibracion de varios sensores de bajo coste probados en la plataforma
Arduino, tratando de completar las especificaciones previas con las que cuentan
y aportando a un futuro usuario de los mismos diferentes propuestas de mejora.
Para ello, se han seguido los siguientes pasos principalmente:
Estudio y sıntesis de las principales especificaciones tecnicas.
Busqueda de los codigos de programacion para Arduino.
Dibujo del esquema electrico de la PCB.
Realizacion de una calibracion/caracterizacion, junto con la creacion del
entorno fısico para la realizacion de las pruebas.
Desarrollo de un programa en MATLAB para leer los datos por puerto serie
y almacenarlos en variables predefinidas.
Generacion de graficas y ecuaciones de ajuste a partir de los datos recogidos.
A continuacion se muestra una tabla resumen de las principales tareas reali-
zadas dentro de los metodos de caracterizacion y calibracion planteados:
69
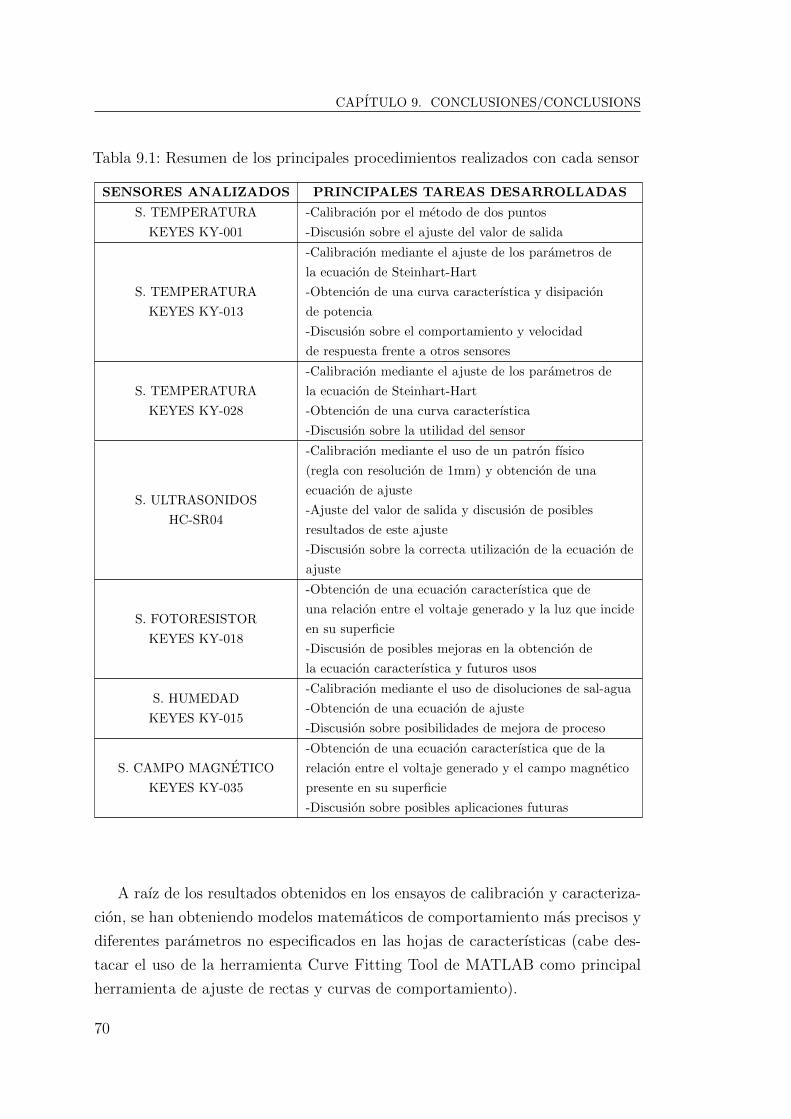
CAPITULO 9. CONCLUSIONES/CONCLUSIONS
Tabla 9.1: Resumen de los principales procedimientos realizados con cada sensor
SENSORES ANALIZADOS PRINCIPALES TAREAS DESARROLLADAS
S. TEMPERATURA
KEYES KY-001
-Calibracion por el metodo de dos puntos
-Discusion sobre el ajuste del valor de salida
S. TEMPERATURA
KEYES KY-013
-Calibracion mediante el ajuste de los parametros de
la ecuacion de Steinhart-Hart
-Obtencion de una curva caracterıstica y disipacion
de potencia
-Discusion sobre el comportamiento y velocidad
de respuesta frente a otros sensores
S. TEMPERATURA
KEYES KY-028
-Calibracion mediante el ajuste de los parametros de
la ecuacion de Steinhart-Hart
-Obtencion de una curva caracterıstica
-Discusion sobre la utilidad del sensor
S. ULTRASONIDOS
HC-SR04
-Calibracion mediante el uso de un patron fısico
(regla con resolucion de 1mm) y obtencion de una
ecuacion de ajuste
-Ajuste del valor de salida y discusion de posibles
resultados de este ajuste
-Discusion sobre la correcta utilizacion de la ecuacion de
ajuste
S. FOTORESISTOR
KEYES KY-018
-Obtencion de una ecuacion caracterıstica que de
una relacion entre el voltaje generado y la luz que incide
en su superficie
-Discusion de posibles mejoras en la obtencion de
la ecuacion caracterıstica y futuros usos
S. HUMEDAD
KEYES KY-015
-Calibracion mediante el uso de disoluciones de sal-agua
-Obtencion de una ecuacion de ajuste
-Discusion sobre posibilidades de mejora de proceso
S. CAMPO MAGNETICO
KEYES KY-035
-Obtencion de una ecuacion caracterıstica que de la
relacion entre el voltaje generado y el campo magnetico
presente en su superficie
-Discusion sobre posibles aplicaciones futuras
A raız de los resultados obtenidos en los ensayos de calibracion y caracteriza-
cion, se han obteniendo modelos matematicos de comportamiento mas precisos y
diferentes parametros no especificados en las hojas de caracterısticas (cabe des-
tacar el uso de la herramienta Curve Fitting Tool de MATLAB como principal
herramienta de ajuste de rectas y curvas de comportamiento).
70

CAPITULO 9. CONCLUSIONES/CONCLUSIONS
9.2. Conclusions
This document focuses in the analysis, characterization and calibration of
various low cost sensors tested on the Arduino platform, trying to complete the
previous specifications witch they count with and contributing to a future user
of them with different suggestions for improvement.
To achieve this, the next steps have been followed:
Study and synthesis of the technical specifications
Search for the programming codes for Arduino
Drawing of the electrical schematic for each PCB
Development of a calibration/characterization process, along with the crea-
tion of the physic environment for the tests.
Development of a code in MATLAB to read data from the serial port and
store it in predefined variables.
Creation of graphics and adjust equations from the collected data
The next table englobes the principal calibration/characterization tasks that
have been accomplished for each sensor:
Tabla 9.2: Resume of the principal tasks developed with each sensor
ANALYZED SENSORS PRINCIPAL TASKS DEVELOPED
TEMPERATURE S.
KEYES KY-001
-Two Point Calibration method
-Discussion about the adjustment of the output value
TEMPERATURE S.
KEYES KY-013
-Calibration by adjusting the Steinhart-Hart
equation parameters
-Obtaining a characteristic curve and the power dissipation
-Discussion about the behaviour and speed response in
comparison to other sensors
TEMPERATURE S.
KEYES KY-028
-Calibration by adjusting the Steinhart-Hart
equation parameters
-Obtaining a characteristic curve
-Discussion of the utility of the sensor
71

CAPITULO 9. CONCLUSIONES/CONCLUSIONS
ULTRASOUND S.
HC-SR04
-Calibration method based on the use of a mesurement pattern
(rule with 1mm resolution) and obtaining a adjust equation
-Output value adjustment and discussion of posible results
for this.
-Discussion about the correct use of the adjustment equation
PHOTODEPENDANT S.
KEYES KY-018
-Obtaining of a characteristic equation that gives the relation
between the generated voltage and the light that hits it surface
-Discussion about possible improvements on the obtention of
the characteristic equation and possible future uses for it
HUMIDITY S.
KEYES KY-015
-Salt-Water Disolution Calibration Method
-Obtention of a adjustment equation
-Discussion about possible improvements in the
calibration method
MAGNETIC FIELD S.
KEYES KY-035
-Obtetion of a characteristic equation that gives the current relationship
between the generated voltage and the magnetic field present in the
sensors surface
-Discussion about future applications
Due to the results obtained in the calibration/characterization tests, more
precise mathematical models have been developed, along with different parame-
ters that were not specified in the DataSheets (one of the principal tools used to
achive this has been the Curve Fitting Tool of MATLAB).
72

BIBLIOGRAFIA
Bibliografıa
[1] AG Electronica S.A., Kit de Sensores y Actuadores Compatibles con
Arduino
Numero de parte: KIT-SEN-ACT, Fecha: 2/03/2015.
[2] Gobierno de Canarias, Caracterısticas tecnicas del ARDUINO UNO
http://www3.gobiernodecanarias.org/medusa/ecoblog/
ralvgon/files/2013/05/Caracter%C3%ADsticas-Arduino.
pdf [Ultimo acceso en agosto de 2018]
[3] MathWorks, MATLAB
https://es.mathworks.com/products/matlab.html [Ultimo ac-
ceso en septiembre 2018]
[4] PROMAX ELECTRONICA, S. L., PD-185
https://www.diesl.es/WebRoot/StoreES2/Shops/eb0383/
5356/4EF4/39AE/3494/7572/AC10/1417/0CFB/PD-18x.pdf
[Ultimo acceso en marzo 2018]
[5] Wiltronics Research Pty. Ltd, Benetech Digital Lux Meter GM1010
https://www.wiltronics.com.au/wp-content/uploads/
datasheets/ME5587%20Datasheet.pdf [Ultimo acceso en marzo
2018]
[6] EasyEDA, Creacion de esquemas electricos
www.easyeda.com [Ultimo acceso en septiembre 2018]
[7] Arduino Playground, Dallas Semiconductor’s 1-Wire Protocol
https://playground.arduino.cc/Learning/OneWire [Ultimo
acceso en septiembre 2017]
[8] Maxim Itegrated, Comparacion entre el sensor DS18B20 y el DS18S20.
www.maximintegrated.com/en/app-notes/index.mvp/id/
4377 [Ultimo acceso en septiembre 2017]
[9] Maxim Integrated, Preguntas frecuentes sobre el sensor DS18B20
(FAQS).
73

BIBLIOGRAFIA
www.maximintegrated.com/en/support/faqs/ds18b20-faq.
html [Ultimo acceso en enero 2018]
[10] Edward Mallon, DS18B20 Calibration: Finally nailed it
www.thecavepearlproject.org/2016/03/05/
ds18b20-calibration-we-finally-nailed-it/ [Ultimo acceso en
diciembre 2017]
[11] Robert Smith, Absolute Calibration of DS18B20 Thermometers
http://www.kandrsmith.org/RJS/Misc/Thermometers/
absolute ds18b20.html [Ultimo acceso en diciembre 2017]
[12] Giacomo Lanzi, Calibration of DS18B20 Sensor with Arduino UNO
http://www.instructables.com/id/Calibration-of-
DS18B20-Sensor-With-Arduino-UNO/ [Ultimo acceso en noviembre
2017]
[13] Bill Earl, Two Point Calibration,
https://learn.adafruit.com/calibrating-sensors/
two-point-calibration [Ultimo acceso en diciembre 2017]
[14] National Institute of Standards and Technology, Ice Point Ca-
libration
https://www.youtube.com/watch?v=KYOJayWqB3g [Ultimo acceso
en enero 2018]
[15] Maps & Directions, Buscar Coordenadas GPS
https://www.mapsdirections.info/coordenadas-de-googlemaps.
html [Ultimo acceso en enero 2018]
[16] ThermoWorks, Check Your Boiling Point
https://www.thermoworks.com/foodservice101 boiling point
[Ultimo acceso en enero 2018]
[17] ThermoWorks, The Truth About Ice Baths: Five Secrets Revealed
https://www.youtube.com/watch?v=rRKwwEZw1Rc#t=149 [Ulti-
mo acceso en diciembre 2017]
74

BIBLIOGRAFIA
[18] AMETHERM, NTC Thermistors Steinhart and Hart Equation
https://www.ametherm.com/thermistor/
ntc-thermistors-steinhart-and-hart-equation [Ultimo
acceso en julio 2018]
[19] Signal Processing Group Inc., Calculating the Steinhart – Hart coeffi-
cients for temperature measurement using thermistors. April 2002
http://www.signalpro.biz/steinhart.pdf [Ultimo acceso en
enero 2018]
[20] Stanford Research Systems, Calibrate Steinhart-Hart Coefficients for
Thermistors
https://www.thinksrs.com/downloads/pdfs/
applicationnotes/LDC%20Note%204%20NTC%20Calculator.
pdf [Ultimo acceso en mayo 2018]
[21] Stanford Research Systems Inc, Thermistor Calculator
https://www.thinksrs.com/downloads/programs/
therm%20calc/ntccalibrator/ntccalculator.html [Ultimo
acceso en febrero 2018]
[22] BOURNS, 3296-3/8”Square Trimpot Trimming Potentiometer
*RoHS Directive 2002/95/EC Jan. 27, 2003 [Ultimo acceso en agosto 2017]
[23] Texas Instruments, LMx93-N, LM2903-N Low-Power, Low-Offset Vol-
tage, Dual Comparators
SNOSBJ6F –OCTOBER 1999–REVISED DECEMBER 2014
[24] Instructables, LONG RANGE ULTRASONIC DISTANCE SENSOR
https://www.instructables.com/id/
Long-Range-Ultrasonic-Distance-Sensor/ [Ultimo acceso
en septiembre 2018]
[25] Jesus A. Davila Pacheco, Enrique Martines Lopez, VALIDACION
DEL METODO DE CALIBRACION DE HIGROMETROS CAPACITIVOS
CON SOLUCIONES SAL-AGUA COMO GENERADORAS DE HUME-
DAD2 al 3 de Julio de 2007
https://www.cenam.mx/dme/pdf/TM06.pdf [Ultimo acceso en junio
2018]
75

BIBLIOGRAFIA
[26] Thomas Kuglestad (Texas Instruments), Semiconductor Temperatu-
re Sensors Challenge Precision RTDs and Thermistors in Building Automa-
tion, Application Report SNAA267–April 2015.
www.ti.com/lit/an/snaa267/snaa267.pdf [Ultimo acceso en enero
2018]
[27] Componentes 101, HC-SR04 Ultrasonic Sensor
https://components101.com/ultrasonic-sensor-working-pinout-datasheet
[Ultimo acceso en julio de 2018]
[28] How To Mechatronics, Ultrasonic Sensor HC-SR04 and Arduino
Tutorial
https://howtomechatronics.com/tutorials/arduino/
ultrasonic-sensor-hc-sr04/ [Ultimo acceso en julio 2018]
[29] Rigonz, HC-SR04 ULTRASONIC SENSOR – ACCURACY AND RESO-
LUTION TESTS
https://app.box.com/s/sj7du1n32in2777rcoi2 May 2014 [Ulti-
mo acceso en julio 2018]
[30] M Olmo R Nave, HyperPhysics Electricidad y Magnetismo
http://hyperphysics.phy-astr.gsu.edu/hbasees/
magnetic/Hall.html [Ultimo acceso en junio 2018]
[31] Instrumentacion Electronica I, CONCEPTOS Y BASES DE LOS
INSTRUMENTOS ELECTRONICOS
https://instrumentacionelectronicai.wordpress.com/
tag/rango/ [Ultimo acceso en mayo 2018]
[32] David Pilling’s Wiki, HC-SR04
https://www.davidpilling.com/wiki/index.php/HCSR04
[Ultimo acceso en abril 2018]
[33] SuperMagnete, ¿Disponen de un iman con X gauss?
https://www.supermagnete.es/faq/Disponen-de-un-iman-con-X-gauss
[Ultimo acceso en julio 2018]
[34] NationalInstruments, Guıa para Realizar Medidas de Temperatura con
Termistores
76

BIBLIOGRAFIA
http://www.ni.com/white-paper/7112/es/ [Ultimo acceso en di-
ciembre 2017]
[35] Javier I. Atorino, Luciano P. Bortolın, Ezequiel Rodrıguez,
Ruben O. Farıas y Eduardo E. Rodrıguez, Experimentos con un
sensor de efecto Hall Departamento de Fısica, Facultad de Ingenierıa y
Ciencias Exactas y Naturales, Universidad Favaloro, Av. Belgrano 1723,
C1093AAR, Ciudad Autonoma de Buenos Aires, Argentina Instituto de
Industria, Universidad Nacional de General Sarmiento, Juan M. Gutierrez
1150, CP B1613GSV, Los Polvorines, Buenos Aires, Argentina
77

BIBLIOGRAFIA
Anexos
78
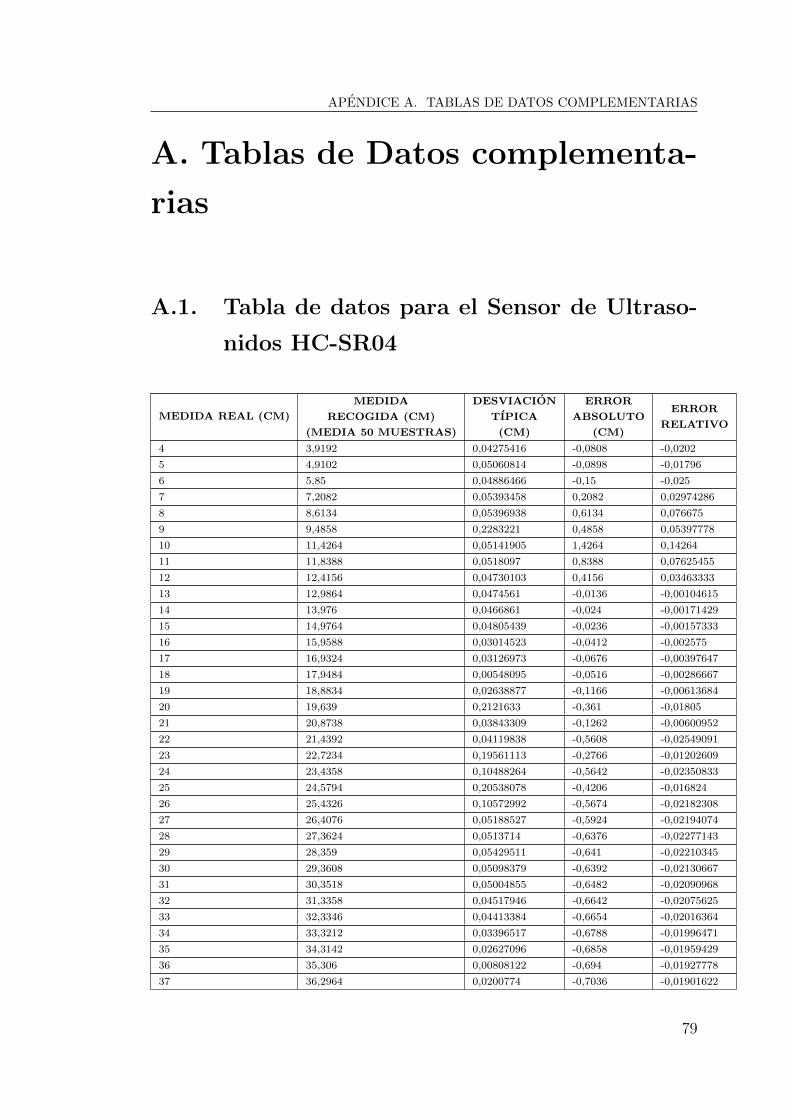
APENDICE A. TABLAS DE DATOS COMPLEMENTARIAS
A. Tablas de Datos complementa-
rias
A.1. Tabla de datos para el Sensor de Ultraso-
nidos HC-SR04
MEDIDA REAL (CM)
MEDIDA
RECOGIDA (CM)
(MEDIA 50 MUESTRAS)
DESVIACION
TIPICA
(CM)
ERROR
ABSOLUTO
(CM)
ERROR
RELATIVO
4 3,9192 0,04275416 -0,0808 -0,0202
5 4,9102 0,05060814 -0,0898 -0,01796
6 5,85 0,04886466 -0,15 -0,025
7 7,2082 0,05393458 0,2082 0,02974286
8 8,6134 0,05396938 0,6134 0,076675
9 9,4858 0,2283221 0,4858 0,05397778
10 11,4264 0,05141905 1,4264 0,14264
11 11,8388 0,0518097 0,8388 0,07625455
12 12,4156 0,04730103 0,4156 0,03463333
13 12,9864 0,0474561 -0,0136 -0,00104615
14 13,976 0,0466861 -0,024 -0,00171429
15 14,9764 0,04805439 -0,0236 -0,00157333
16 15,9588 0,03014523 -0,0412 -0,002575
17 16,9324 0,03126973 -0,0676 -0,00397647
18 17,9484 0,00548095 -0,0516 -0,00286667
19 18,8834 0,02638877 -0,1166 -0,00613684
20 19,639 0,2121633 -0,361 -0,01805
21 20,8738 0,03843309 -0,1262 -0,00600952
22 21,4392 0,04119838 -0,5608 -0,02549091
23 22,7234 0,19561113 -0,2766 -0,01202609
24 23,4358 0,10488264 -0,5642 -0,02350833
25 24,5794 0,20538078 -0,4206 -0,016824
26 25,4326 0,10572992 -0,5674 -0,02182308
27 26,4076 0,05188527 -0,5924 -0,02194074
28 27,3624 0,0513714 -0,6376 -0,02277143
29 28,359 0,05429511 -0,641 -0,02210345
30 29,3608 0,05098379 -0,6392 -0,02130667
31 30,3518 0,05004855 -0,6482 -0,02090968
32 31,3358 0,04517946 -0,6642 -0,02075625
33 32,3346 0,04413384 -0,6654 -0,02016364
34 33,3212 0,03396517 -0,6788 -0,01996471
35 34,3142 0,02627096 -0,6858 -0,01959429
36 35,306 0,00808122 -0,694 -0,01927778
37 36,2964 0,0200774 -0,7036 -0,01901622
79

APENDICE A. TABLAS DE DATOS COMPLEMENTARIAS
38 37,2946 0,03038595 -0,7054 -0,01856316
39 38,394 0,18953218 -0,606 -0,01553846
40 39,2166 0,04653767 -0,7834 -0,019585
41 40,2606 0,04858865 -0,7394 -0,01803415
42 41,2524 0,05305215 -0,7476 -0,0178
43 42,3746 0,2120282 -0,6254 -0,01454419
44 43,2358 0,05897388 -0,7642 -0,01736818
45 44,232 0,05443588 -0,768 -0,01706667
46 45,1478 0,05323379 -0,8522 -0,01852609
47 46,2264 0,12263701 -0,7736 -0,01645957
48 47,1922 0,05222752 -0,8078 -0,01682917
49 48,18 0,05034574 -0,82 -0,01673469
50 49,2084 0,14823258 -0,7916 -0,015832
51 50,1632 0,04191537 -0,8368 -0,01640784
52 51,1532 0,03395315 -0,8468 -0,01628462
53 52,1508 0,05267691 -0,8492 -0,01602264
54 52,904 0,21135134 -1,096 -0,0202963
55 54,127 0,02815772 -0,873 -0,01587273
56 55,128 0,02398979 -0,872 -0,01557143
57 56,1136 0,04064581 -0,8864 -0,01555088
58 56,9776 0,15517679 -1,0224 -0,01762759
59 57,9986 0,12745563 -1,0014 -0,01697288
60 59,0292 0,04902478 -0,9708 -0,01618
61 60,0756 0,05261179 -0,9244 -0,0151541
62 60,8152 0,18858485 -1,1848 -0,01910968
63 61,8972 0,21864182 -1,1028 -0,01750476
64 62,6608 0,04919101 -1,3392 -0,020925
65 63,9614 0,15390177 -1,0386 -0,01597846
66 65,0132 0,06917709 -0,9868 -0,01495152
67 66,0092 0,04485077 -0,9908 -0,01478806
68 66,5908 0,04881619 -1,4092 -0,02072353
69 67,6368 0,0680468 -1,3632 -0,01975652
70 68,9672 0,08815663 -1,0328 -0,01475429
71 69,621 0,0803627 -1,379 -0,01942254
72 70,6424 0,12717592 -1,3576 -0,01885556
73 71,6302 0,13227198 -1,3698 -0,01876438
74 72,9178 0,16319876 -1,0822 -0,01462432
75 73,8182 0,21373921 -1,1818 -0,01575733
76 74,709 0,18386164 -1,291 -0,01698684
77 75,9128 0,07120078 -1,0872 -0,01411948
78 76,839 0,18892013 -1,161 -0,01488462
79 77,6786 0,195584 -1,3214 -0,01672658
80 78,9126 0,12585722 -1,0874 -0,0135925
81 79,9162 0,07992062 -1,0838 -0,01338025
82 80,9036 0,07179222 -1,0964 -0,01337073
83 81,589 0,17596672 -1,411 -0,017
84 82,6522 0,20956018 -1,3478 -0,01604524
85 83,512 0,11554662 -1,488 -0,01750588
86 84,879 0,07538337 -1,121 -0,01303488
87 85,8724 0,06281037 -1,1276 -0,01296092
88 86,511 0,13931685 -1,489 -0,01692045
80

APENDICE A. TABLAS DE DATOS COMPLEMENTARIAS
89 87,844 0,1072095 -1,156 -0,01298876
90 89,3192 0,05609176 -0,6808 -0,00756444
91 89,9512 0,06466996 -1,0488 -0,01152527
92 90,8242 0,06866333 -1,1758 -0,01278043
93 91,4948 0,18988976 -1,5052 -0,01618495
94 92,657 0,19226098 -1,343 -0,01428723
95 93,7484 0,16618603 -1,2516 -0,01317474
96 94,4586 0,11096994 -1,5414 -0,01605625
97 95,789 0,14865726 -1,211 -0,01248454
98 96,4376 0,09677578 -1,5624 -0,01594286
99 97,5522 0,19595178 -1,4478 -0,01462424
100 98,792 0,07289915 -1,208 -0,01208
101 99,5852 0,19193154 -1,4148 -0,01400792
102 100,4362 0,06930824 -1,5638 -0,01533137
103 101,6442 0,21755684 -1,3558 -0,01316311
104 102,6704 0,29104989 -1,3296 -0,01278462
105 103,5498 0,33177008 -1,4502 -0,01381143
106 104,5702 0,36846338 -1,4298 -0,01348868
107 105,5432 0,26624708 -1,4568 -0,01361495
108 106,2502 0,4113169 -1,7498 -0,01620185
109 107,292 0,35622167 -1,708 -0,01566972
110 108,2076 0,39181191 -1,7924 -0,01629455
111 109,2886 0,24923565 -1,7114 -0,01541802
112 110,173 0,21067675 -1,827 -0,0163125
113 111,1742 0,23572805 -1,8258 -0,01615752
114 112,5532 0,41521295 -1,4468 -0,01269123
115 113,461 0,4096701 -1,539 -0,01338261
116 114,4354 0,36558709 -1,5646 -0,01348793
117 115,4234 0,32668158 -1,5766 -0,01347521
118 116,3146 0,23981464 -1,6854 -0,01428305
119 117,1884 0,18604761 -1,8116 -0,01522353
120 118,125 0,24171369 -1,875 -0,015625
121 119,204 0,26179132 -1,796 -0,01484298
122 120,1854 0,50315417 -1,8146 -0,01487377
123 121,1896 0,45413277 -1,8104 -0,0147187
124 122,1916 0,42619034 -1,8084 -0,01458387
125 123,2692 0,21787321 -1,7308 -0,0138464
126 124,0534 0,21871247 -1,9466 -0,01544921
127 125,176 0,39364337 -1,824 -0,0143622
128 126,1278 0,24547571 -1,8722 -0,01462656
129 127,1668 0,19195493 -1,8332 -0,01421085
130 128,2718 0,3294627 -1,7282 -0,01329385
131 129,0482 0,39366768 -1,9518 -0,01489924
132 130,2462 0,31019342 -1,7538 -0,01328636
133 131,2018 0,2140636 -1,7982 -0,0135203
134 132,2556 0,34016299 -1,7444 -0,01301791
135 133,2272 0,52353991 -1,7728 -0,01313185
136 134,2962 0,58887263 -1,7038 -0,01252794
137 135,2248 0,32968284 -1,7752 -0,01295766
138 136,3338 0,35010138 -1,6662 -0,01207391
139 137,2728 0,30001388 -1,7272 -0,0124259
81

APENDICE A. TABLAS DE DATOS COMPLEMENTARIAS
140 138,477 0,26520112 -1,523 -0,01087857
141 139,1858 0,48915208 -1,8142 -0,01286667
142 140,397 0,32037765 -1,603 -0,01128873
143 141,4472 0,20277705 -1,5528 -0,01085874
144 142,091 0,40666513 -1,909 -0,01325694
145 143,4528 0,19996979 -1,5472 -0,01067034
146 144,0784 0,26497871 -1,9216 -0,01316164
147 145,0134 0,3362859 -1,9866 -0,01351429
148 146,1728 0,36825036 -1,8272 -0,01234595
149 146,867 0,28675703 -2,133 -0,01431544
150 148,0898 0,50091952 -1,9102 -0,01273467
151 149,3466 0,23505631 -1,6534 -0,01094967
152 150,4288 0,48764591 -1,5712 -0,01033684
153 151,2448 0,48422562 -1,7552 -0,0114719
154 152,8378 0,45870844 -1,1622 -0,00754675
155 154,1212 0,23413445 -0,8788 -0,00566968
156 154,8002 0,55494986 -1,1998 -0,00769103
157 155,9666 0,52275413 -1,0334 -0,00658217
158 156,9966 0,50993641 -1,0034 -0,00635063
159 157,8796 0,44486164 -1,1204 -0,00704654
160 159,2278 0,63247583 -0,7722 -0,00482625
161 159,8326 0,38615747 -1,1674 -0,00725093
162 161,0266 0,46728748 -0,9734 -0,00600864
163 161,9592 0,54855595 -1,0408 -0,00638528
164 162,9436 0,43867965 -1,0564 -0,00644146
165 163,753 0,45571764 -1,247 -0,00755758
166 164,6836 0,56952454 -1,3164 -0,00793012
167 165,892 0,58972494 -1,108 -0,00663473
168 166,9004 0,45054597 -1,0996 -0,00654524
169 167,7242 0,28143285 -1,2758 -0,00754911
170 168,8576 0,48490083 -1,1424 -0,00672
171 169,8636 0,5009247 -1,1364 -0,00664561
172 170,9142 0,49371598 -1,0858 -0,00631279
173 172,0488 0,34510359 -0,9512 -0,00549827
174 173,049 0,50867675 -0,951 -0,00546552
175 173,8438 0,42769382 -1,1562 -0,00660686
176 174,9932 0,46221048 -1,0068 -0,00572045
177 176,0058 0,41052028 -0,9942 -0,00561695
178 176,8542 0,63955051 -1,1458 -0,00643708
179 177,8812 0,32670676 -1,1188 -0,00625028
180 179,1162 0,59895109 -0,8838 -0,00491
181 180,0364 0,39474487 -0,9636 -0,00532376
182 180,9492 0,32535594 -1,0508 -0,00577363
183 182,103 0,52877313 -0,897 -0,00490164
184 183,0096 0,44613972 -0,9904 -0,00538261
185 183,934 0,34419382 -1,066 -0,00576216
186 184,849 0,42932909 -1,151 -0,00618817
187 185,706 0,47739087 -1,294 -0,00691979
188 186,8702 0,35008156 -1,1298 -0,00600957
189 187,7596 0,40323164 -1,2404 -0,00656296
190 188,8004 0,37152724 -1,1996 -0,00631368
82

APENDICE A. TABLAS DE DATOS COMPLEMENTARIAS
191 189,6224 0,37763258 -1,3776 -0,00721257
192 190,9168 0,48749857 -1,0832 -0,00564167
193 191,7918 0,23462249 -1,2082 -0,0062601
194 192,8432 0,39778181 -1,1568 -0,00596289
195 193,5692 0,39021627 -1,4308 -0,00733744
196 194,7414 0,42016523 -1,2586 -0,00642143
197 195,8588 0,37932077 -1,1412 -0,00579289
198 196,7418 0,43837217 -1,2582 -0,00635455
199 197,8986 0,49130817 -1,1014 -0,00553467
200 198,9064 0,47459009 -1,0936 -0,005468
201 199,905 0,4610558 -1,095 -0,00544776
202 201,065 0,55959989 -0,935 -0,00462871
203 201,9092 0,34229621 -1,0908 -0,0053734
204 203,0846 0,57816815 -0,9154 -0,00448725
205 203,9506 0,48540499 -1,0494 -0,00511902
206 204,96 0,45721428 -1,04 -0,00504854
207 205,837 0,61002927 -1,163 -0,00561836
208 206,7528 0,44306005 -1,2472 -0,00599615
209 207,9208 0,52209093 -1,0792 -0,00516364
210 209,2836 0,52213752 -0,7164 -0,00341143
211 210,1402 0,46427688 -0,8598 -0,00407488
212 210,872 0,53488126 -1,128 -0,00532075
213 211,9368 0,37741029 -1,0632 -0,00499155
214 213,0822 0,65526841 -0,9178 -0,00428879
215 213,9676 0,46583942 -1,0324 -0,00480186
216 215,2158 0,45201178 -0,7842 -0,00363056
217 216,0484 0,45821018 -0,9516 -0,00438525
218 217,018 0,39945371 -0,982 -0,00450459
219 218,0382 0,41935173 -0,9618 -0,00439178
220 219,0144 0,38926493 -0,9856 -0,00448
221 220,1196 0,44604823 -0,8804 -0,00398371
222 221,2244 0,5354958 -0,7756 -0,00349369
223 222,1582 0,5734916 -0,8418 -0,00377489
224 223,2724 0,49067035 -0,7276 -0,00324821
225 224,1018 0,49765446 -0,8982 -0,003992
226 225,317 0,50332061 -0,683 -0,00302212
227 226,0066 0,40095605 -0,9934 -0,00437621
228 227,0344 0,48014097 -0,9656 -0,00423509
229 228,1596 0,43253387 -0,8404 -0,00366987
230 228,9988 0,38078673 -1,0012 -0,00435304
231 230,123 0,50220026 -0,877 -0,00379654
232 231,0928 0,38165611 -0,9072 -0,00391034
233 231,964 0,44243298 -1,036 -0,00444635
234 233,2658 0,6127925 -0,7342 -0,00313761
235 234,0556 0,41546217 -0,9444 -0,00401872
236 235,1246 0,51876309 -0,8754 -0,00370932
237 236,1868 0,4653392 -0,8132 -0,00343122
238 237,1206 0,45112291 -0,8794 -0,00369496
239 238,0654 0,5276796 -0,9346 -0,00391046
240 239,3196 0,54646157 -0,6804 -0,002835
241 240,1254 0,52937472 -0,8746 -0,00362905
83

APENDICE A. TABLAS DE DATOS COMPLEMENTARIAS
242 240,9976 0,5450241 -1,0024 -0,00414215
243 242,263 0,45938402 -0,737 -0,00303292
244 243,3768 0,6738117 -0,6232 -0,0025541
245 244,1502 0,47822158 -0,8498 -0,00346857
246 245,1144 0,49199784 -0,8856 -0,0036
247 246,313 0,48555985 -0,687 -0,00278138
248 246,8056 0,46769151 -1,1944 -0,00481613
249 248,0522 0,43109396 -0,9478 -0,00380643
250 248,7742 0,66102916 -1,2258 -0,0049032
251 249,7354 0,3940072 -1,2646 -0,00503825
252 250,7856 0,51875502 -1,2144 -0,00481905
253 251,9416 0,50241604 -1,0584 -0,0041834
254 252,8222 0,52786551 -1,1778 -0,00463701
255 253,9636 0,46679437 -1,0364 -0,00406431
256 254,976 0,52904226 -1,024 -0,004
257 255,8124 0,64364891 -1,1876 -0,00462101
258 256,6968 0,52708842 -1,3032 -0,00505116
259 257,9014 0,35382464 -1,0986 -0,0042417
260 258,6444 0,4411819 -1,3556 -0,00521385
261 259,7568 0,47126595 -1,2432 -0,00476322
262 260,7694 0,45390555 -1,2306 -0,00469695
263 262,223 0,50135022 -0,777 -0,00295437
264 262,468 0,49662946 -1,532 -0,00580303
265 263,4728 0,575982 -1,5272 -0,00576302
266 264,279 0,29981797 -1,721 -0,00646992
267 265,4706 0,46952173 -1,5294 -0,00572809
268 266,6424 0,47760269 -1,3576 -0,00506567
269 267,7528 0,70887966 -1,2472 -0,00463643
270 268,1342 0,49266079 -1,8658 -0,00691037
271 269,0342 0,43384418 -1,9658 -0,00725387
272 270,1732 0,46130445 -1,8268 -0,00671618
273 271,053 0,51771969 -1,947 -0,00713187
274 274,161 0,59459556 0,161 0,00058759
275 273,4192 0,43078874 -1,5808 -0,00574836
276 274,1808 0,51522074 -1,8192 -0,0065913
277 275,0554 0,34534934 -1,9446 -0,00702022
278 276,2818 0,50734881 -1,7182 -0,00618058
279 277,3222 0,50186709 -1,6778 -0,00601362
280 278,181 0,46490398 -1,819 -0,00649643
281 279,228 0,65899429 -1,772 -0,00630605
282 280,1178 0,35896842 -1,8822 -0,00667447
283 281,2466 0,5458437 -1,7534 -0,00619576
284 282,336 0,63214891 -1,664 -0,00585915
285 283,4322 0,45753684 -1,5678 -0,00550105
286 284,3798 0,4210991 -1,6202 -0,00566503
287 285,3888 0,49805598 -1,6112 -0,00561394
288 286,3564 0,41149186 -1,6436 -0,00570694
289 287,132 0,44329932 -1,868 -0,00646367
290 288,3634 0,47263745 -1,6366 -0,00564345
291 289,3476 0,45641263 -1,6524 -0,00567835
292 290,3424 0,45181521 -1,6576 -0,00567671
84

APENDICE A. TABLAS DE DATOS COMPLEMENTARIAS
293 291,4368 0,36001383 -1,5632 -0,00533515
294 292,4966 0,36229771 -1,5034 -0,00511361
295 293,4894 0,52130296 -1,5106 -0,00512068
296 294,5206 0,43275298 -1,4794 -0,00499797
297 295,5538 0,49578999 -1,4462 -0,00486936
298 296,3786 0,51106935 -1,6214 -0,00544094
299 297,5374 0,49752781 -1,4626 -0,00489164
300 298,4012 0,5010342 -1,5988 -0,00532933
301 299,7748 0,48097367 -1,2252 -0,00407043
302 300,5756 0,55752427 -1,4244 -0,00471656
303 301,5244 0,33435384 -1,4756 -0,00486997
304 302,773 0,45400373 -1,227 -0,00403618
305 303,828 0,53570476 -1,172 -0,00384262
306 304,8186 0,53836491 -1,1814 -0,00386078
307 305,83 0,52344619 -1,17 -0,00381107
308 306,8888 0,55327094 -1,1112 -0,00360779
309 308,0384 0,72889169 -0,9616 -0,00311197
310 308,9862 0,57521918 -1,0138 -0,00327032
311 310,0896 0,5216495 -0,9104 -0,00292733
312 309,4112 1,10240302 -2,5888 -0,00829744
313 312,0638 0,51686611 -0,9362 -0,00299105
314 313,0168 0,48624106 -0,9832 -0,00313121
315 313,8346 0,64496863 -1,1654 -0,00369968
316 315,309 0,37352841 -0,691 -0,00218671
317 315,8058 0,4021579 -1,1942 -0,00376719
318 316,8944 0,45132983 -1,1056 -0,00347673
319 317,7856 0,57765946 -1,2144 -0,0038069
320 319,193 0,57211833 -0,807 -0,00252187
321 320,4318 0,55833093 -0,5682 -0,00177009
322 321,071 0,50865669 -0,929 -0,00288509
323 321,667 0,62186766 -1,333 -0,00412693
324 322,9726 0,521645 -1,0274 -0,00317099
325 323,9664 0,56692785 -1,0336 -0,00318031
326 325,0726 0,56064034 -0,9274 -0,00284479
327 325,9782 0,48564575 -1,0218 -0,00312477
328 327,0568 0,51557948 -0,9432 -0,00287561
329 328,1902 0,56091576 -0,8098 -0,0024614
330 329,0524 0,57661772 -0,9476 -0,00287152
331 330,2262 0,55628465 -0,7738 -0,00233776
332 331,6118 0,56744573 -0,3882 -0,00116928
333 332,4268 0,53821868 -0,5732 -0,00172132
334 333,1278 0,42932453 -0,8722 -0,00261138
335 334,713 0,52599856 -0,287 -0,00085672
336 335,5228 0,67741417 -0,4772 -0,00142024
337 336,5222 0,71876109 -0,4778 -0,0014178
338 337,6552 0,57293102 -0,3448 -0,00102012
339 338,6252 0,54947931 -0,3748 -0,0011056
340 339,6722 0,55117792 -0,3278 -0,00096412
341 340,6 0,53035991 -0,4 -0,00117302
342 341,8058 0,61913069 -0,1942 -0,00056784
343 342,9404 1,03555754 -0,0596 -0,00017376
85

APENDICE A. TABLAS DE DATOS COMPLEMENTARIAS
344 344,0662 0,68366029 0,0662 0,00019244
345 345,1296 0,58931977 0,1296 0,00037565
346 345,8748 0,62826044 -0,1252 -0,00036185
347 347,078 0,60578167 0,078 0,00022478
348 347,9392 0,64724168 -0,0608 -0,00017471
349 348,608 0,49020196 -0,392 -0,00112321
350 349,9004 0,47727526 -0,0996 -0,00028457
351 350,9826 0,53575737 -0,0174 -4,96E-05
352 351,7814 0,53501101 -0,2186 -0,00062102
353 352,6082 0,62033464 -0,3918 -0,00110992
354 353,8536 0,53269726 -0,1464 -0,00041356
355 354,67 0,579243 -0,33 -0,00092958
356 355,976 0,67823902 -0,024 -6,74E-05
357 356,796 0,51677572 -0,204 -0,00057143
358 358,2508 0,76840104 0,2508 0,00070056
359 358,9572 0,83836099 -0,0428 -0,00011922
360 359,665 0,56482343 -0,335 -0,00093056
361 361,1186 0,59191495 0,1186 0,00032853
362 362,0246 0,62034293 0,0246 6,80E-05
363 362,8526 0,61155142 -0,1474 -0,00040606
364 363,9384 0,61925353 -0,0616 -0,00016923
365 364,8656 0,64998637 -0,1344 -0,00036822
366 365,5382 0,55776774 -0,4618 -0,00126175
367 366,9142 0,65450118 -0,0858 -0,00023379
368 367,393 0,54741042 -0,607 -0,00164946
369 368,8362 0,82047992 -0,1638 -0,0004439
370 370,02 0,58095628 0,02 5,41E-05
371 369,5954 0,47595322 -1,4046 -0,00378598
372 371,2622 0,58777786 -0,7378 -0,00198333
373 373,1344 0,68282475 0,1344 0,00036032
374 373,3554 0,55222818 -0,6446 -0,00172353
375 373,9994 0,59648087 -1,0006 -0,00266827
376 374,8262 0,53415541 -1,1738 -0,00312181
377 375,6542 0,47964736 -1,3458 -0,00356976
378 376,4896 0,50500337 -1,5104 -0,00399577
379 377,752 0,56787826 -1,248 -0,00329288
380 378,5138 0,59468699 -1,4862 -0,00391105
381 379,4506 0,53450878 -1,5494 -0,00406667
382 380,5304 0,5774326 -1,4696 -0,00384712
383 381,9626 0,60111057 -1,0374 -0,00270862
384 382,8538 0,65098321 -1,1462 -0,0029849
385 383,872 0,70569115 -1,128 -0,00292987
386 385,3542 0,55848954 -0,6458 -0,00167306
387 385,987 0,49900411 -1,013 -0,00261757
388 386,8146 0,62841625 -1,1854 -0,00305515
389 388,0038 0,60345566 -0,9962 -0,00256093
390 388,6098 0,59664193 -1,3902 -0,00356462
391 389,3566 0,54076141 -1,6434 -0,00420307
392 390,9644 0,49377414 -1,0356 -0,00264184
393 394,5816 1,20194292 1,5816 0,00402443
394 394,8588 0,74788857 0,8588 0,0021797
86

APENDICE A. TABLAS DE DATOS COMPLEMENTARIAS
395 394,4876 0,58474331 -0,5124 -0,00129722
396 394,4564 0,45335826 -1,5436 -0,00389798
397 395,476 0,50827841 -1,524 -0,00383879
398 396,5006 0,48307438 -1,4994 -0,00376734
399 397,8668 0,6567093 -1,1332 -0,0028401
400 398,855 0,54369203 -1,145 -0,0028625
Tabla A.1: Tabla con los datos recogidos para el Sensor de Ultrasonidos HC-SR04
A.2. Tabla de datos recogidos para el Sensor Fo-
toresistor KEYES KY-018
A continuacion se muestran los datos obtenidos para el ensayo de obtencion
de muestras a diferentes niveles de luz:
NIVEL DE LUZ (LUXES)
LUXOMETRO BENTECH GM010
MEDIA DEL VOLTAJE (V) PARA
100 MUESTRAS
DESVIACION TIPICA DEL
CONJUNTO DE MUESTRAS
0 0 0
1 0,3387 0,00544114515576092
15 1,9226 0,00690776170095435
27 2,6683 0,00752839741756287
37 2,8675 0,0189296944860009
120 3,8029 0,0215225979431440
190 4,2699 0,0189360966826788
240 4,3538 0,0173949952166093
290 4,4364 0,0135228949145030
365 4,4933 0,0151127078776087
380 4,5284 0,0136862387569826
430 4,5451 0,0125926866702762
470 4,5729 0,0130496333010905
520 4,5957 0,0123300568948527
600 4,6205 0,0125025249975006
640 4,659 0,0104929028443519
700 4,663 0,00979589689408744
960 4,7088 0,00987599886266444
1500 4,7795 0,00845367650579616
2100 4,8234 0,00713789149185498
Tabla A.2: Tabla de datos obtenidos para el Sensor Fotoresistor KEYES KY-018
87
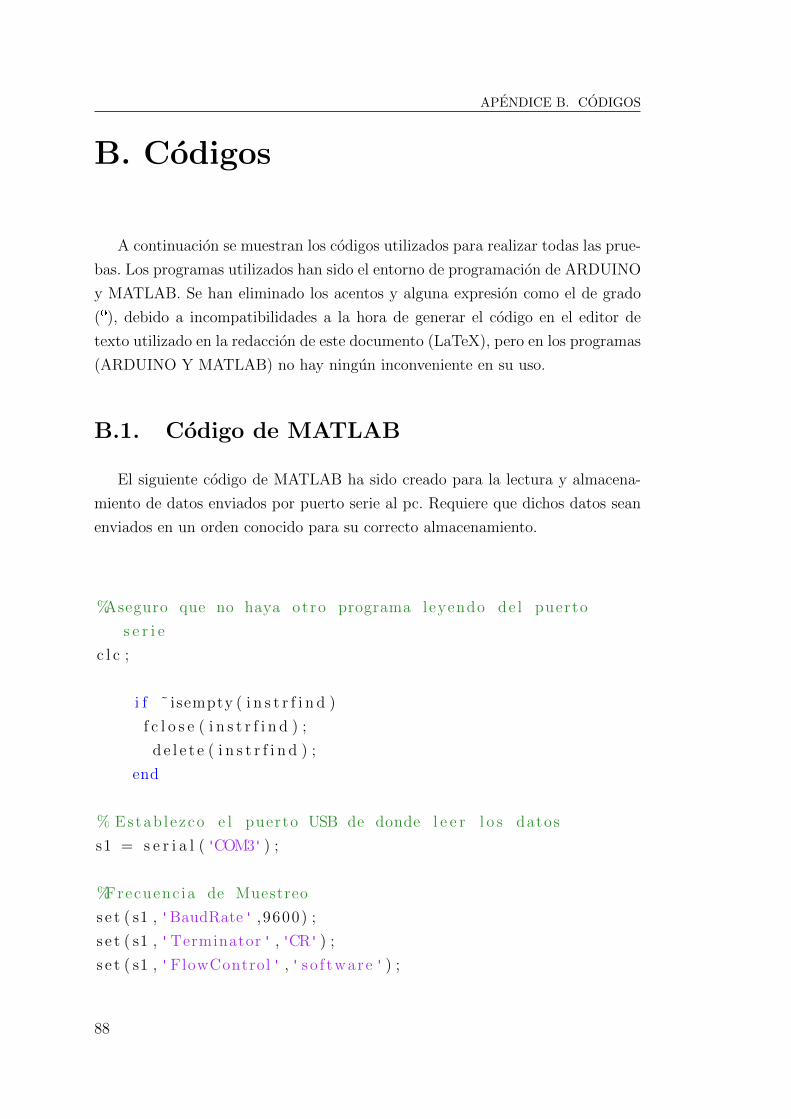
APENDICE B. CODIGOS
B. Codigos
A continuacion se muestran los codigos utilizados para realizar todas las prue-
bas. Los programas utilizados han sido el entorno de programacion de ARDUINO
y MATLAB. Se han eliminado los acentos y alguna expresion como el de grado
(º), debido a incompatibilidades a la hora de generar el codigo en el editor de
texto utilizado en la redaccion de este documento (LaTeX), pero en los programas
(ARDUINO Y MATLAB) no hay ningun inconveniente en su uso.
B.1. Codigo de MATLAB
El siguiente codigo de MATLAB ha sido creado para la lectura y almacena-
miento de datos enviados por puerto serie al pc. Requiere que dichos datos sean
enviados en un orden conocido para su correcto almacenamiento.
%Aseguro que no haya otro programa leyendo de l puerto
s e r i e
c l c ;
i f ˜ isempty ( i n s t r f i n d )
f c l o s e ( i n s t r f i n d ) ;
d e l e t e ( i n s t r f i n d ) ;
end
% Estab lezco e l puerto USB de donde l e e r l o s datos
s1 = s e r i a l ( 'COM3' ) ;
%Frecuenc ia de Muestreo
s e t ( s1 , 'BaudRate' ,9600) ;
s e t ( s1 , 'Terminator' , 'CR' ) ;
s e t ( s1 , 'FlowControl' , ' so f tware ' ) ;
88

APENDICE B. CODIGOS
% Comienzo a l e e r de l puerto s e r i e y a almacenar l o s datos
en e l Buf f e r
fopen ( s1 )
%Creo un vec to r donde se guardaran l o s v a l o r e s de l a
v a r i a b l e a medir
Var iab le1 = [ ] ;
% Creo un segundo vec to r para ot ra v a r i a b l e
Var iab le2 = [ ] ;
%Se han de c r ea r tantos v e c t o r e s como v a r i a b l e s se deseen
medir .
%Para e l paso de l e c t u r a se tendra en cuenta e l orden de
envio
%de l o s datos por e l puerto s e r i e , que se i r an acumulando
en e l b u f f e r en
%dicho orden . Pongamos e l ejemplo de que medimos
temperatura y r e s i s t e n c i a .
%Si queremos que se guarden en ese orden , debemos
programar en Arduino que
%e l primero dato que se env ie por e l puerto s e r i e sea l a
temperatura , y e l
%segundo dato l a r e s i s t e n c i a .
%Si observamos e s to por e l puerto S e r i a l debe r i a
mostrarnos a lgo a s i :
%28 .9 −−−> primer dato temperatura
%98111 −−−>segundo dato r e s i s t e n c i a
%25 .4 −−−>temperatura
%10101 −−−>r e s i s t e n c i a
%.
%.
%.
%. . . −−−> temperatura
89

APENDICE B. CODIGOS
%. . . −−−> r e s i s t e n c i a
%Bucle whi l e i n f i n i t o u t i l i z a d o para l a toma de muestras ,
%que paramos con l a s t e c l a s Ctr l+C.
whi l e (1 )
%Leemos e l primer dato de l puerto s e r i e ( en e s t e caso un
t ipo f l o a t )
%asoc iado a l a primera v a r i a b l e que queremos medir . En
e s t e ejemplo s e ra l a
%temperatura . Almacenamos f i c h o dato en un una v a r i a b l e
temporal ( dato1 ) .
dato1 = f s c a n f ( s1 , '%f ' )
%Guardamos dato1 en e l vec to r Var iab le1 .
%dato1 siempre va ldra e l va l o r de l a l e c t u r a ac tua l y
Var iab le1 tendra de
%tamano un vec to r 1xN donde N es e l numero de l e c t u r a s
tomadas
Var iab le1 = [ Var iab le1 dato1 ] ;
%Ahora leemos e l s i g u i e n t e dato d i s p o n i b l e en e l puerto
s e r i e . Asumimos que
%es e l dato co r r e spond i en t e a l a segunda v a r i a b l e a medir .
( en e s t e ejemplo
%s e r i a l a temperatura ) Guardamos e l dato en l a v a r i a b l e
temporal dato2 .
dato2 = f s c a n f ( s1 , '%f ' )
%Almacenamos e l va l o r de dato2 en un vec to r ( Var iab le2 ) .
dato2 s iempre
%valdra e l va l o r acuta l de l a medida y Var iab le2 s e ra e l
vec to r 1xN que
%cont i ene todas l a s medidas tomadas para esa v a r i a b l e
Var iab le2 = [ Var iab le2 dato2 ] ;
90

APENDICE B. CODIGOS
%Tras r e coge r e s t e par de datos y a lmacenar los en su
vec to r
%cor re spond iente , se r e p i t e e l proceso tantas veces como
muestras se desee .
%Como vemos , s i e l orden de envio por e l puerto s e r i e es :
primer dato
%temperatura y segundo r e s i s t e n c i a , l a temperatura se
guardara en Var iab le1
%y l a r e s i s t e n c i a en Var iab le2 .
%Si deseamos medir mas v a r i a b l e s , s o l o hay que r e a l i z a r
una s imple
%mod i f i c ac i on y r ep roduc i r parte de l cod igo .
%Como paso f i n a l e s tab lecemos un per iodo de pausa antes de
vo lve r a
%e j e c u t a r e l buc le whi l e ( 0 . 1 s )
pause ( 0 . 1 )
end
B.2. Codigos de ARDUINO
A continuacion se muestran todos los codigos de Arduino utilizados para cada
sensor, incluyendo las modificaciones realizadas sobre los mismos.
B.2.1. Codigo de Arduino para el Sensor de Temperatura
KEYES KY-001
1 #include <Wire.h>
2 #include <OneWire.h>
3 #include <DallasTemperature.h>
4 #define TEMPERATURE_PRECISION 12
5
6
7 int tim = 250; //the value of delay time
91

APENDICE B. CODIGOS
8
9 // Data wire is plugged into port 2 on the Arduino
10 #define ONE_WIRE_BUS 2
11
12 // Setup a oneWire instance to communicate with any
OneWire devices (not just Maxim/Dallas temperature ICs
)
13 OneWire oneWire(ONE_WIRE_BUS);
14
15 // Pass our oneWire reference to Dallas Temperature.
16 DallasTemperature sensors(&oneWire);
17
18 void setup(void)
19
20
21 // start serial port
22 Serial.begin(9600);
23 //Serial.println("Dallas Temperature IC Control Library
Demo");
24
25
26 // Start up the library
27 sensors.begin();
28 //sensors.setResolution(TEMPERATURE_PRECISION);
29 // Serial.println(sensors.getResolution());
30
31
32
33
34 void loop(void)
35
36 // call sensors.requestTemperatures() to issue a global
temperature
37 // request to all devices on the bus
38
92

APENDICE B. CODIGOS
39 sensors.requestTemperatures(); // Send the command to
get temperatures
40
41
42 Serial.println(sensors.getTempCByIndex(0));
43
44 delay(100); //wait for 100 milliseconds
B.2.2. Codigo de Arduino para el Sensor de Temperatura
KY-013
1
2 #include <math.h>
3
4 int sensorPin = A5; // pin de entrada analogica
5
6 double Thermistor(int RawADC)
7 double ntcc;
8 ntcc = ((10230000/RawADC)-10000); // valor del
termistor NTC
9
10 return ntcc;
11
12
13 double Temperatura(int dato)
14 double temp =
15
16 void setup()
17 Serial.begin(9600);
18
19
20 void loop()
21 int Vout=analogRead(sensorPin); // Lectura del pin
analogico
22 double NTC = Thermistor(Vout); // Obtencion del valor
93

APENDICE B. CODIGOS
NTC
23 float LogRes = log(NTC);
24 float Temp = 1 / (0.0005089218645 + (0.0002484818972*
LogRes) + (-0.00000001313142875 *(pow(LogRes,3))));
25 Temp = Temp -273.3;
26 float Vout_convertido = Vout*0.00489;
27 Serial.println(Temp); //Valor de la temperatura
28 Serial.println(Vout); // Valor de Vout pasado a digital
(CAD de 10 bits)
29 Serial.println(NTC); // Valor de la NTC
30 Serial.println(Vout_convertido) // Voltaje analogico
Vout en voltios.
31
32 delay(500);
33
B.2.3. Codigo de Arduino para el Sensor de Temperatura
KEYES KY-028
1
2 #include <math.h>
3
4 int sensorPin = A5; // pin de entrada analogica
5
6 double Thermistor(int RawADC)
7 double ntcc;
8 ntcc = ((10230000/RawADC)-10000); // valor del
termistor NTC
9
10 return ntcc;
11
12
13 double Temperatura(int dato)
14 double temp =
15
94

APENDICE B. CODIGOS
16 void setup()
17 Serial.begin(9600);
18
19
20 void loop()
21 int Vout=analogRead(sensorPin); // Lectura del pin
analogico
22 double NTC = Thermistor(Vout); // Obtencion del valor
NTC
23 float LogRes = log(NTC);
24 float Temp = 1 / (0.0007394932093 + (0.0002366015369*
LogRes) + (0.00000004160709595*(pow(LogRes,3))));
25 Temp = Temp -273.3;
26 float Vout_convertido = Vout*0.00489;
27 Serial.println(Temp); //Valor de la temperatura
28 Serial.println(Vout); // Valor de Vout pasado a digital
(CAD de 10 bits)
29 Serial.println(NTC); // Valor de la NTC
30 Serial.println(Vout_convertido) // Voltaje analogico
Vout en voltios.
31
32 delay(500);
33
B.2.4. Codigo de Arduino para el Sensor Fotoresistor KE-
YES KY-018
1 #include <math.h>
2
3 int sensorPin = A5; // pin de entrada analogica
4 int tim = 250; //the value of delay time
5
6
7 double LDR(int RawADC)
8 double ldrr;
95

APENDICE B. CODIGOS
9 ldrr = ((10230000/RawADC)-10000); // valor del
termistor NTC
10
11 return ldrr;
12
13 void setup()
14 Serial.begin(9600);
15
16
17
18 void loop()
19 int Vout=analogRead(sensorPin); // Lectura del pin
analogico
20 double FOTORESISTOR = LDR(Vout); // Obtencion del
valor del LDR
21 //Serial.println(Vout); // Valor de Vout pasado a
digital (CAD de 10 bits)
22 float Vout_convertido = Vout*0.00489; Valor analogico de
Vout
23 float termino_exp1 = exp(Vout_convertido*0.7642);
24 float termino_exp2 = exp(Vout_convertido*7.702);
25 float conjunto1 = (6.036*termino_exp1);
26 float conjunto2 = (0.0000000000001332*termino_exp2);
27 float luxes = (conjunto1+conjunto2);
28 Serial.println(FOTORESISTOR);
29 //Serial.println(Vout);
30 Serial.println(Vout_convertido);
31 Serial.println(luxes);
32
33 delay(100); //wait for 100 milliseconds
34
B.2.5. Codigo de Arduino para el Sensor de Ultrasonidos
HC-SR04
96

APENDICE B. CODIGOS
1 const int trigPin = 9;
2 const int echoPin = 10;
3 // defines variables
4 long duration;
5 float distance;
6 float soundSpeed;
7 float tempAir = 26.8;
8 void setup()
9 pinMode(trigPin, OUTPUT); // Sets the trigPin as an
Output
10 pinMode(echoPin, INPUT); // Sets the echoPin as an Input
11 Serial.begin(9600); // Starts the serial communication
12
13 void loop()
14 // Clears the trigPin
15 digitalWrite(trigPin, LOW);
16 delayMicroseconds(2);
17 // Sets the trigPin on HIGH state for 10 micro seconds
18 digitalWrite(trigPin, HIGH);
19 delayMicroseconds(10);
20 digitalWrite(trigPin, LOW);
21 // Reads the echoPin, returns the sound wave travel time
in microseconds
22 duration = pulseIn(echoPin, HIGH);
23 // Calculating the distance
24 soundSpeed = 331.3 + (0.606 * tempAir); // m/s
25 distance = duration / 20000.0 * soundSpeed; // converts
the time into a distance (cm)
26 // Prints the distance on the Serial Monitor;
27 Serial.println(distance);
28 delay(100);
29
97

APENDICE B. CODIGOS
B.2.6. Codigo de Arduino para el Sensor de Humedad
KEYES KY-015
1 int DHpin = 8; // input/output pin
2 byte dat[5];
3
4 byte read_data()
5
6 byte i = 0;
7 byte result = 0;
8 for (i = 0; i < 8; i++)
9 while (digitalRead(DHpin) == LOW); // wait 50us
10 delayMicroseconds(30); //The duration of the high
level is judged to determine whether the data is
’0’ or ’1’
11 if (digitalRead(DHpin) == HIGH)
12 result |= (1 << (8 - i)); //High in the former,
low in the post
13 while (digitalRead(DHpin) == HIGH); //Data ’1’,
waiting for the next bit of reception
14
15 return result;
16
17
18 void start_test()
19
20 digitalWrite(DHpin, LOW); //Pull down the bus to send
the start signal
21 delay(30); //The delay is greater than 18 ms so that
DHT 11 can detect the start signal
22 digitalWrite(DHpin, HIGH);
23 delayMicroseconds(40); //Wait for DHT11 to respond
24 pinMode(DHpin, INPUT);
25 while(digitalRead(DHpin) == HIGH);
26 delayMicroseconds(80); //The DHT11 responds by pulling
98

APENDICE B. CODIGOS
the bus low for 80us;
27
28 if(digitalRead(DHpin) == LOW)
29 delayMicroseconds(80); //DHT11 pulled up after the
bus 80us to start sending data;
30 for(int i = 0; i < 5; i++) //Receiving temperature and
humidity data, check bits are not considered;
31 dat[i] = read_data();
32 pinMode(DHpin, OUTPUT);
33 digitalWrite(DHpin, HIGH); //After the completion of a
release of data bus, waiting for the host to start
the next signal
34
35
36 void setup()
37
38 Serial.begin(9600);
39 pinMode(DHpin, OUTPUT);
40
41
42
43 void loop()
44
45 start_test();
46 // Serial.print("Humdity = ");
47 Serial.println(dat[0], DEC); //Displays the integer
bits of humidity;
48 //Serial.println(dat[1], DEC); //Displays the decimal
places of the humidity;
49 //Serial.println(’%’);
50 // Serial.print("Temperature = ");
51 //Serial.print(dat[2], DEC); //Displays the integer
bits of temperature;
52 //Serial.print(’.’);
53 //Serial.print(dat[3], DEC); //Displays the decimal
99

APENDICE B. CODIGOS
places of the temperature;
54 //Serial.println(’C’);
55
56 //byte checksum = dat[0] + dat[1] + dat[2] + dat[3];
57 //if (dat[4] != checksum)
58 //Serial.println("-- Checksum Error!");
59 // else
60 // Serial.println("-- OK");
61
62 delay(1000);
63
B.2.7. Codigo de Arduino para el Sensor de Humedad
KEYES KY-035
1 #include <math.h>
2 int sensorPin = A5; // pin de entrada analogica
3
4 void setup()
5 // put your setup code here, to run once:
6 Serial.begin(9600);
7
8
9 void loop()
10
11
12 int Vout=analogRead(sensorPin);
13 float Vout_convertido = Vout*0.00489;
14
15 float V_modificado = Vout_convertido-0.092;
16 float termino1 = V_modificado*66.67;
17 float campo_magnetico = termino1-166.7;
18 Serial.println(V_modificado);
19 Serial.println(campo_magnetico);
20
100

APENDICE B. CODIGOS
21 delay(100); //wait for 100 milliseconds
22
101
APENDICE C. HOJA DE ESPECIFICACIONES (DATASHEET) DE LOS SENSORESESTUDIADOS
C. Hoja de especificaciones (Da-
tasheet) de los sensores estudiados
Datasheet que incluye este anexo:
C.1 Datasheet del Sensor de Temperatura DS18B20 (componente principal
del sensor KEYES KY-01).
C.2 Datasheet de los termistores NTC presentes en los Sensores de Tempe-
ratura KEYES KY-013 y KY-028.
C.3 Datasheet del Sensor de Ultrasonidos HC-SR04.
C.4 Datasheet de la resistencia fotodependiente presente en el Sensor KE-
YES KY-018.
C.5 Datasheet del Sensor de Humedad DHT11 (componente principal del
sensor KEYES KY-015).
C.6 Datasheet del Sensor de Campo Magnetico (componente principal del
sensor KEYES KY-035).
102

APENDICE C. HOJA DE ESPECIFICACIONES (DATASHEET) DE LOS SENSORESESTUDIADOS
C.1. Datasheet del Sensor de Temperatura KE-
YES KY-001 (DS18B20)
103

General DescriptionThe DS18B20 digital thermometer provides 9-bit to 12-bit Celsius temperature measurements and has an alarm function with nonvolatile user-programmable upper and lower trigger points. The DS18B20 communicates over a 1-Wire bus that by definition requires only one data line (and ground) for communication with a central micro-processor. In addition, the DS18B20 can derive power directly from the data line (“parasite power”), eliminating the need for an external power supply. Each DS18B20 has a unique 64-bit serial code, which allows multiple DS18B20s to function on the same 1-Wire bus. Thus, it is simple to use one microprocessor to control many DS18B20s distributed over a large area. Applications that can benefit from this feature include HVAC environmental controls, temperature monitoring systems inside buildings, equipment, or machinery, and process monitoring and control systems.
Applications Thermostatic Controls Industrial Systems Consumer Products Thermometers Thermally Sensitive Systems
Benefits and Features Unique 1-Wire® Interface Requires Only One Port
Pin for Communication Reduce Component Count with Integrated
Temperature Sensor and EEPROM• Measures Temperatures from -55°C to +125°C
(-67°F to +257°F)• ±0.5°C Accuracy from -10°C to +85°C• Programmable Resolution from 9 Bits to 12 Bits• No External Components Required
Parasitic Power Mode Requires Only 2 Pins for Operation (DQ and GND)
Simplifies Distributed Temperature-Sensing Applications with Multidrop Capability• Each Device Has a Unique 64-Bit Serial Code
Stored in On-Board ROM Flexible User-Definable Nonvolatile (NV) Alarm Settings
with Alarm Search Command Identifies Devices with Temperatures Outside Programmed Limits
Available in 8-Pin SO (150 mils), 8-Pin µSOP, and 3-Pin TO-92 Packages
19-7487; Rev 4; 1/15
Ordering Information appears at end of data sheet.
1-Wire is a registered trademark of Maxim Integrated Products, Inc.
BOTTOM VIEW
8
7
6
5
2
N.C.
N.C.
VDD
DQ
N.C.
N.C.
N.C.
GND
DS18B20
SO (150 mils)(DS18B20Z)
+1
4
3
7
8
5
6
1
2
3
4
+DQ
N.C.
N.C.
GND
VDD
N.C.
N.C.
N.C.
DS18B20
µSOP(DS18B20U)
DS18B20
1 2 3
GND DQ VDD
1
1 2 3
TOP VIEW
TO-92 (DS18B20)
DS18B20 Programmable Resolution 1-Wire Digital Thermometer
Pin Configurations

Voltage Range on Any Pin Relative to Ground ....-0.5V to +6.0VOperating Temperature Range ......................... -55°C to +125°C
Storage Temperature Range ............................ -55°C to +125°CSolder Temperature ...............................Refer to the IPC/JEDEC
J-STD-020 Specification.
(-55°C to +125°C; VDD = 3.0V to 5.5V)
Note 1: All voltages are referenced to ground. Note 2: The Pullup Supply Voltage specification assumes that the pullup device is ideal, and therefore the high level of the
pullup is equal to VPU. In order to meet the VIH spec of the DS18B20, the actual supply rail for the strong pullup transis-tor must include margin for the voltage drop across the transistor when it is turned on; thus: VPU_ACTUAL = VPU_IDEAL + VTRANSISTOR.
Note 3: See typical performance curve in Figure 1.Note 4: Logic-low voltages are specified at a sink current of 4mA.Note 5: To guarantee a presence pulse under low voltage parasite power conditions, VILMAX may have to be reduced to as low as
0.5V. Note 6: Logic-high voltages are specified at a source current of 1mA.Note 7: Standby current specified up to +70°C. Standby current typically is 3µA at +125°C.Note 8: To minimize IDDS, DQ should be within the following ranges: GND ≤ DQ ≤ GND + 0.3V or VDD – 0.3V ≤ DQ ≤ VDD.Note 9: Active current refers to supply current during active temperature conversions or EEPROM writes.Note 10: DQ line is high (“high-Z” state).Note 11: Drift data is based on a 1000-hour stress test at +125°C with VDD = 5.5V.
PARAMETER SYMBOL CONDITIONS MIN TYP MAX UNITS
Supply Voltage VDD Local power (Note 1) +3.0 +5.5 V
Pullup Supply Voltage VPUParasite power
(Notes 1, 2)+3.0 +5.5
VLocal power +3.0 VDD
Thermometer Error tERR-10°C to +85°C
(Note 3)±0.5
°C-55°C to +125°C ±2
Input Logic-Low VIL (Notes 1, 4, 5) -0.3 +0.8 V
Input Logic-High VIHLocal power
(Notes 1,6)+2.2 The lower
of 5.5 orVDD + 0.3
VParasite power +3.0
Sink Current IL VI/O = 0.4V 4.0 mA
Standby Current IDDS (Notes 7, 8) 750 1000 nA
Active Current IDD VDD = 5V (Note 9) 1 1.5 mA
DQ Input Current IDQ (Note 10) 5 µA
Drift (Note 11) ±0.2 °C
DS18B20 Programmable Resolution 1-Wire Digital Thermometer
www.maximintegrated.com Maxim Integrated 2
Absolute Maximum Ratings
These are stress ratings only and functional operation of the device at these or any other conditions above those indicated in the operation sections of this specification is not implied. Exposure to absolute maximum rating conditions for extended periods of time may affect reliability.
DC Electrical Characteristics
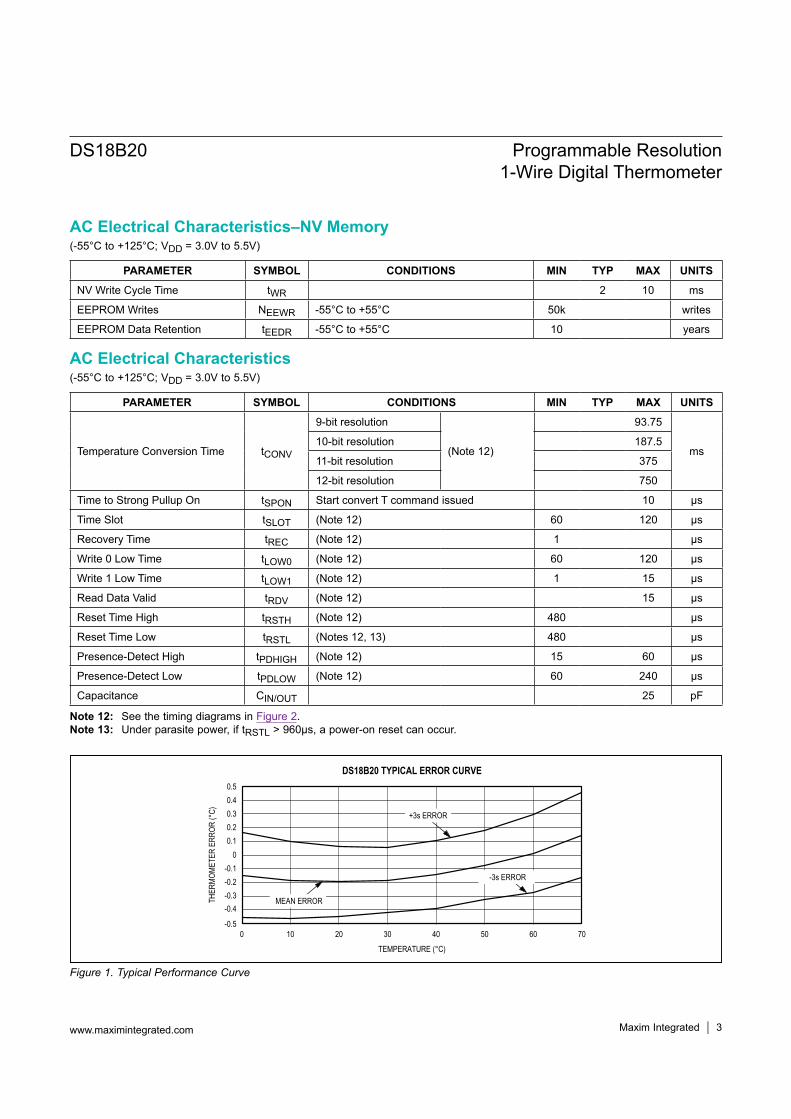
(-55°C to +125°C; VDD = 3.0V to 5.5V)
(-55°C to +125°C; VDD = 3.0V to 5.5V)
Note 12: See the timing diagrams in Figure 2. Note 13: Under parasite power, if tRSTL > 960µs, a power-on reset can occur.
Figure 1. Typical Performance Curve
PARAMETER SYMBOL CONDITIONS MIN TYP MAX UNITS
NV Write Cycle Time tWR 2 10 ms
EEPROM Writes NEEWR -55°C to +55°C 50k writes
EEPROM Data Retention tEEDR -55°C to +55°C 10 years
PARAMETER SYMBOL CONDITIONS MIN TYP MAX UNITS
Temperature Conversion Time tCONV
9-bit resolution
(Note 12)
93.75
ms10-bit resolution 187.5
11-bit resolution 375
12-bit resolution 750
Time to Strong Pullup On tSPON Start convert T command issued 10 µs
Time Slot tSLOT (Note 12) 60 120 µs
Recovery Time tREC (Note 12) 1 µs
Write 0 Low Time tLOW0 (Note 12) 60 120 µs
Write 1 Low Time tLOW1 (Note 12) 1 15 µs
Read Data Valid tRDV (Note 12) 15 µs
Reset Time High tRSTH (Note 12) 480 µs
Reset Time Low tRSTL (Notes 12, 13) 480 µs
Presence-Detect High tPDHIGH (Note 12) 15 60 µs
Presence-Detect Low tPDLOW (Note 12) 60 240 µs
Capacitance CIN/OUT 25 pF
DS18B20 TYPICAL ERROR CURVE0.50.40.30.20.1
0-0.1-0.2-0.3-0.4
-0.5
THER
MOME
TER
ERRO
R (°C
)
0 7010 20 30 40 50 60
TEMPERATURE (°C)
+3s ERROR
MEAN ERROR
-3s ERROR
DS18B20 Programmable Resolution 1-Wire Digital Thermometer
www.maximintegrated.com Maxim Integrated 3
AC Electrical Characteristics–NV Memory
AC Electrical Characteristics

Figure 2. Timing Diagrams
PINNAME FUNCTION
SO µSOP TO-92
1, 2, 6, 7, 8
2, 3, 5, 6, 7 — N.C. No Connection
3 8 3 VDD Optional VDD. VDD must be grounded for operation in parasite power mode.
4 1 2 DQ Data Input/Output. Open-drain 1-Wire interface pin. Also provides power to the device when used in parasite power mode (see the Powering the DS18B20 section.)
5 4 1 GND Ground
START OF NEXT CYCLE
1-WIRE WRITE ZERO TIME SLOT
tREC
tSLOT
tLOW0
1-WIRE READ ZERO TIME SLOT
tREC
tSLOT START OF NEXT CYCLE
tRDV
1-WIRE RESET PULSE
1-WIRE PRESENCE DETECT
tRSTL tRSTH
tPDIH
PRESENCE DETECT
tPDLOW
RESET PULSE FROM HOST
DS18B20 Programmable Resolution 1-Wire Digital Thermometer
www.maximintegrated.com Maxim Integrated 4
Pin Description

OverviewFigure 3 shows a block diagram of the DS18B20, and pin descriptions are given in the Pin Description table. The 64-bit ROM stores the device’s unique serial code. The scratchpad memory contains the 2-byte temperature register that stores the digital output from the temperature sensor. In addition, the scratchpad provides access to the 1-byte upper and lower alarm trigger registers (TH and TL) and the 1-byte configuration register. The configura-tion register allows the user to set the resolution of the temperature-to-digital conversion to 9, 10, 11, or 12 bits. The TH, TL, and configuration registers are nonvolatile (EEPROM), so they will retain data when the device is powered down.The DS18B20 uses Maxim’s exclusive 1-Wire bus proto-col that implements bus communication using one control signal. The control line requires a weak pullup resistor since all devices are linked to the bus via a 3-state or open-drain port (the DQ pin in the case of the DS18B20). In this bus system, the microprocessor (the master device) identifies and addresses devices on the bus using each device’s unique 64-bit code. Because each device has a unique code, the number of devices that can be addressed on one bus is virtually unlimited. The 1-Wire bus protocol, including detailed explanations of the commands and “time slots,” is covered in the 1-Wire Bus System section.Another feature of the DS18B20 is the ability to oper-ate without an external power supply. Power is instead supplied through the 1-Wire pullup resistor through the
DQ pin when the bus is high. The high bus signal also charges an internal capacitor (CPP), which then supplies power to the device when the bus is low. This method of deriving power from the 1-Wire bus is referred to as “para-site power.” As an alternative, the DS18B20 may also be powered by an external supply on VDD.
Operation—Measuring TemperatureThe core functionality of the DS18B20 is its direct-to-digital temperature sensor. The resolution of the tempera-ture sensor is user-configurable to 9, 10, 11, or 12 bits, corresponding to increments of 0.5°C, 0.25°C, 0.125°C, and 0.0625°C, respectively. The default resolution at power-up is 12-bit. The DS18B20 powers up in a low-power idle state. To initiate a temperature measurement and A-to-D conversion, the master must issue a Convert T [44h] command. Following the conversion, the resulting thermal data is stored in the 2-byte temperature register in the scratchpad memory and the DS18B20 returns to its idle state. If the DS18B20 is powered by an external sup-ply, the master can issue “read time slots” (see the 1-Wire Bus System section) after the Convert T command and the DS18B20 will respond by transmitting 0 while the tem-perature conversion is in progress and 1 when the con-version is done. If the DS18B20 is powered with parasite power, this notification technique cannot be used since the bus must be pulled high by a strong pullup during the entire temperature conversion. The bus requirements for parasite power are explained in detail in the Powering the DS18B20 section.
Figure 3. DS18B20 Block Diagram
TEMPERATURE SENSOR
SCRATCHPAD
MEMORYCONTROL LOGIC
64-BIT ROM AND 1-Wire
PORT
PARASITE POWER CIRCUIT
POWER-SUPPLY SENSE
INTERNAL VDDGND
DQ
VPU
4.7kΩ
CONFIGURATIONREGISTER (EEPROM)
8-BIT CRC GENERATOR
VDD
CPP
DS18B20
ALARM LOW TRIGGER (TL) REGISTER (EEPROM)
ALARM HIGH TRIGGER (TH) REGISTER (EEPROM)
DS18B20 Programmable Resolution 1-Wire Digital Thermometer
www.maximintegrated.com Maxim Integrated 5

The DS18B20 output temperature data is calibrated in degrees Celsius; for Fahrenheit applications, a lookup table or conversion routine must be used. The tempera-ture data is stored as a 16-bit sign-extended two’s comple-ment number in the temperature register (see Figure 4). The sign bits (S) indicate if the temperature is positive or negative: for positive numbers S = 0 and for negative numbers S = 1. If the DS18B20 is configured for 12-bit resolution, all bits in the temperature register will contain valid data. For 11-bit resolution, bit 0 is undefined. For 10-bit resolution, bits 1 and 0 are undefined, and for 9-bit resolution bits 2, 1, and 0 are undefined. Table 1 gives examples of digital output data and the corresponding temperature reading for 12-bit resolution conversions.
Operation—Alarm SignalingAfter the DS18B20 performs a temperature conversion, the temperature value is compared to the user-defined two’s complement alarm trigger values stored in the 1-byte TH and TL registers (see Figure 5). The sign bit (S) indicates if the value is positive or negative: for positive numbers S = 0 and for negative numbers S = 1. The TH and TL registers are nonvolatile (EEPROM) so they will retain data when the device is powered down. TH and TL can be accessed through bytes 2 and 3 of the scratchpad as explained in the Memory section.Only bits 11 through 4 of the temperature register are used in the TH and TL comparison since TH and TL are 8-bit registers. If the measured temperature is lower than
Figure 4. Temperature Register Format
Figure 5. TH and TL Register Format
Table 1. Temperature/Data Relationship
*The power-on reset value of the temperature register is +85°C.
TEMPERATURE (°C) DIGITAL OUTPUT(BINARY)
DIGITAL OUTPUT(HEX)
+125 0000 0111 1101 0000 07D0h
+85* 0000 0101 0101 0000 0550h
+25.0625 0000 0001 1001 0001 0191h
+10.125 0000 0000 1010 0010 00A2h
+0.5 0000 0000 0000 1000 0008h
0 0000 0000 0000 0000 0000h
-0.5 1111 1111 1111 1000 FFF8h
-10.125 1111 1111 0101 1110 FF5Eh
-25.0625 1111 1110 0110 1111 FE6Fh
-55 1111 1100 1001 0000 FC90h
BIT 7 BIT 6 BIT 5 BIT 4 BIT 3 BIT 2 BIT 1 BIT 0LS BYTE 23 22 21 20 2-1 2-2 2-3 2-4
BIT 15 BIT 14 BIT 13 BIT 12 BIT 11 BIT 10 BIT 9 BIT 8MS BYTE S S S S S 26 25 24
S = SIGN
BIT 7 BIT 6 BIT 5 BIT 4 BIT 3 BIT 2 BIT 1 BIT 0S 26 25 24 23 22 21 20
DS18B20 Programmable Resolution 1-Wire Digital Thermometer
www.maximintegrated.com Maxim Integrated 6

or equal to TL or higher than or equal to TH, an alarm con-dition exists and an alarm flag is set inside the DS18B20. This flag is updated after every temperature measure-ment; therefore, if the alarm condition goes away, the flag will be turned off after the next temperature conversion. The master device can check the alarm flag status of all DS18B20s on the bus by issuing an Alarm Search [ECh] command. Any DS18B20s with a set alarm flag will respond to the command, so the master can determine exactly which DS18B20s have experienced an alarm condition. If an alarm condition exists and the TH or TL settings have changed, another temperature conversion should be done to validate the alarm condition.
Powering the DS18B20The DS18B20 can be powered by an external supply on the VDD pin, or it can operate in “parasite power” mode, which allows the DS18B20 to function without a local external supply. Parasite power is very useful for applica-tions that require remote temperature sensing or that are very space constrained. Figure 3 shows the DS18B20’s parasite-power control circuitry, which “steals” power from the 1-Wire bus via the DQ pin when the bus is high. The stolen charge powers the DS18B20 while the bus is high, and some of the charge is stored on the parasite power capacitor (CPP) to provide power when the bus is low. When the DS18B20 is used in parasite power mode, the VDD pin must be connected to ground.In parasite power mode, the 1-Wire bus and CPP can pro-vide sufficient current to the DS18B20 for most operations as long as the specified timing and voltage requirements are met (see the DC Electrical Characteristics and AC Electrical Characteristics). However, when the DS18B20 is performing temperature conversions or copying data from the scratchpad memory to EEPROM, the operating current can be as high as 1.5mA. This current can cause an unacceptable voltage drop across the weak 1-Wire pullup resistor and is more current than can be supplied
by CPP. To assure that the DS18B20 has sufficient supply current, it is necessary to provide a strong pullup on the 1-Wire bus whenever temperature conversions are tak-ing place or data is being copied from the scratchpad to EEPROM. This can be accomplished by using a MOSFET to pull the bus directly to the rail as shown in Figure 6. The 1-Wire bus must be switched to the strong pullup within 10µs (max) after a Convert T [44h] or Copy Scratchpad [48h] command is issued, and the bus must be held high by the pullup for the duration of the conversion (tCONV) or data transfer (tWR = 10ms). No other activity can take place on the 1-Wire bus while the pullup is enabled.The DS18B20 can also be powered by the conventional method of connecting an external power supply to the VDD pin, as shown in Figure 7. The advantage of this method is that the MOSFET pullup is not required, and the 1-Wire bus is free to carry other traffic during the tem-perature conversion time.The use of parasite power is not recommended for tem-peratures above +100°C since the DS18B20 may not be able to sustain communications due to the higher leak-age currents that can exist at these temperatures. For applications in which such temperatures are likely, it is strongly recommended that the DS18B20 be powered by an external power supply.In some situations the bus master may not know whether the DS18B20s on the bus are parasite powered or pow-ered by external supplies. The master needs this informa-tion to determine if the strong bus pullup should be used during temperature conversions. To get this information, the master can issue a Skip ROM [CCh] command fol-lowed by a Read Power Supply [B4h] command followed by a “read time slot”. During the read time slot, parasite powered DS18B20s will pull the bus low, and externally powered DS18B20s will let the bus remain high. If the bus is pulled low, the master knows that it must supply the strong pullup on the 1-Wire bus during temperature conversions.
Figure 6. Supplying the Parasite-Powered DS18B20 During Temperature Conversions
Figure 7. Powering the DS18B20 with an External Supply
VPU
4.7kΩ
VPU
1-Wire BUS
DS18B20
GND DQ VDD
TO OTHER 1-Wire DEVICES
µP
VPU
4.7kΩ
1-Wire BUS
DS18B20
GND DQ VDD
TO OTHER 1-Wire DEVICES
µP
VDD (EXTERNAL SUPPLY)
DS18B20 Programmable Resolution 1-Wire Digital Thermometer
www.maximintegrated.com Maxim Integrated 7
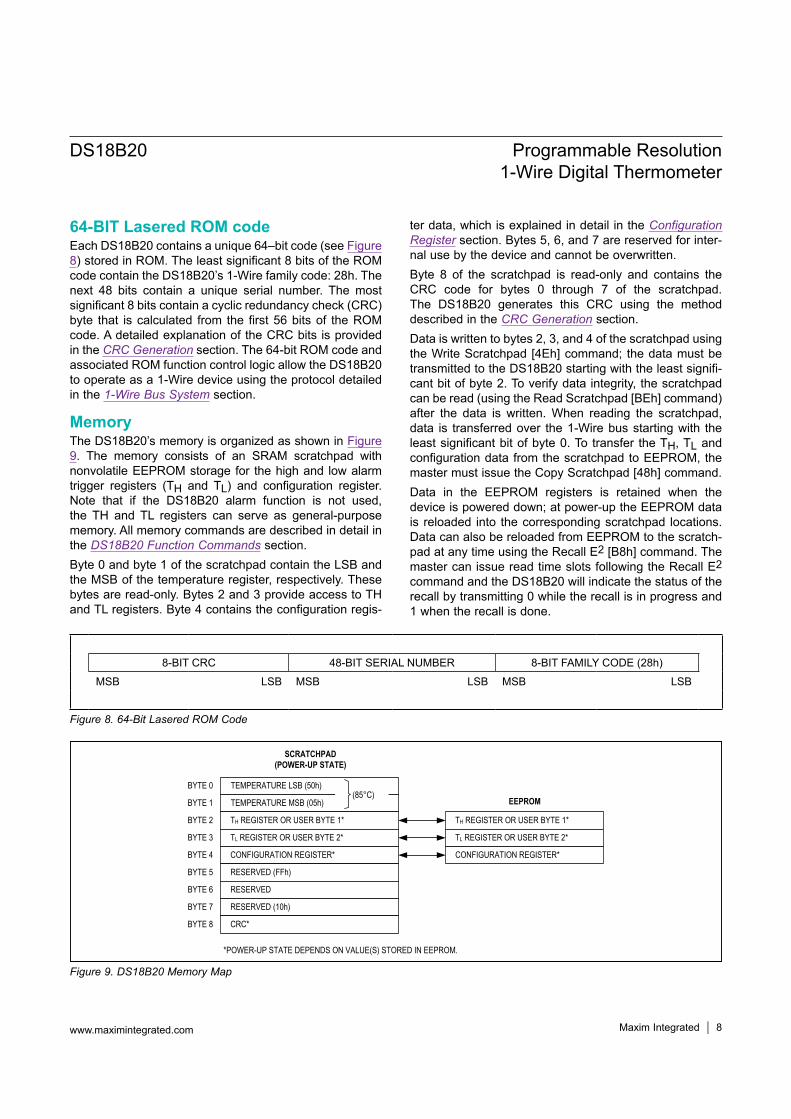
64-BIT Lasered ROM codeEach DS18B20 contains a unique 64–bit code (see Figure 8) stored in ROM. The least significant 8 bits of the ROM code contain the DS18B20’s 1-Wire family code: 28h. The next 48 bits contain a unique serial number. The most significant 8 bits contain a cyclic redundancy check (CRC) byte that is calculated from the first 56 bits of the ROM code. A detailed explanation of the CRC bits is provided in the CRC Generation section. The 64-bit ROM code and associated ROM function control logic allow the DS18B20 to operate as a 1-Wire device using the protocol detailed in the 1-Wire Bus System section.
MemoryThe DS18B20’s memory is organized as shown in Figure 9. The memory consists of an SRAM scratchpad with nonvolatile EEPROM storage for the high and low alarm trigger registers (TH and TL) and configuration register. Note that if the DS18B20 alarm function is not used, the TH and TL registers can serve as general-purpose memory. All memory commands are described in detail in the DS18B20 Function Commands section.Byte 0 and byte 1 of the scratchpad contain the LSB and the MSB of the temperature register, respectively. These bytes are read-only. Bytes 2 and 3 provide access to TH and TL registers. Byte 4 contains the configuration regis-
ter data, which is explained in detail in the Configuration Register section. Bytes 5, 6, and 7 are reserved for inter-nal use by the device and cannot be overwritten. Byte 8 of the scratchpad is read-only and contains the CRC code for bytes 0 through 7 of the scratchpad. The DS18B20 generates this CRC using the method described in the CRC Generation section. Data is written to bytes 2, 3, and 4 of the scratchpad using the Write Scratchpad [4Eh] command; the data must be transmitted to the DS18B20 starting with the least signifi-cant bit of byte 2. To verify data integrity, the scratchpad can be read (using the Read Scratchpad [BEh] command) after the data is written. When reading the scratchpad, data is transferred over the 1-Wire bus starting with the least significant bit of byte 0. To transfer the TH, TL and configuration data from the scratchpad to EEPROM, the master must issue the Copy Scratchpad [48h] command. Data in the EEPROM registers is retained when the device is powered down; at power-up the EEPROM data is reloaded into the corresponding scratchpad locations. Data can also be reloaded from EEPROM to the scratch-pad at any time using the Recall E2 [B8h] command. The master can issue read time slots following the Recall E2 command and the DS18B20 will indicate the status of the recall by transmitting 0 while the recall is in progress and 1 when the recall is done.
Figure 8. 64-Bit Lasered ROM Code
Figure 9. DS18B20 Memory Map
BYTE 0
BYTE 1
TEMPERATURE LSB (50h)
TEMPERATURE MSB (05h)(85°C)
BYTE 2
BYTE 3
TH REGISTER OR USER BYTE 1*
TL REGISTER OR USER BYTE 2*
BYTE 4
BYTE 5
CONFIGURATION REGISTER*
RESERVED (FFh)
BYTE 6
BYTE 7
RESERVED
RESERVED (10h)
BYTE 8 CRC*
*POWER-UP STATE DEPENDS ON VALUE(S) STORED IN EEPROM.
TH REGISTER OR USER BYTE 1*
TL REGISTER OR USER BYTE 2*
CONFIGURATION REGISTER*
SCRATCHPAD(POWER-UP STATE)
EEPROM
8-BIT CRC 48-BIT SERIAL NUMBER 8-BIT FAMILY CODE (28h)
MSB LSB MSB LSB MSB LSB
DS18B20 Programmable Resolution 1-Wire Digital Thermometer
www.maximintegrated.com Maxim Integrated 8
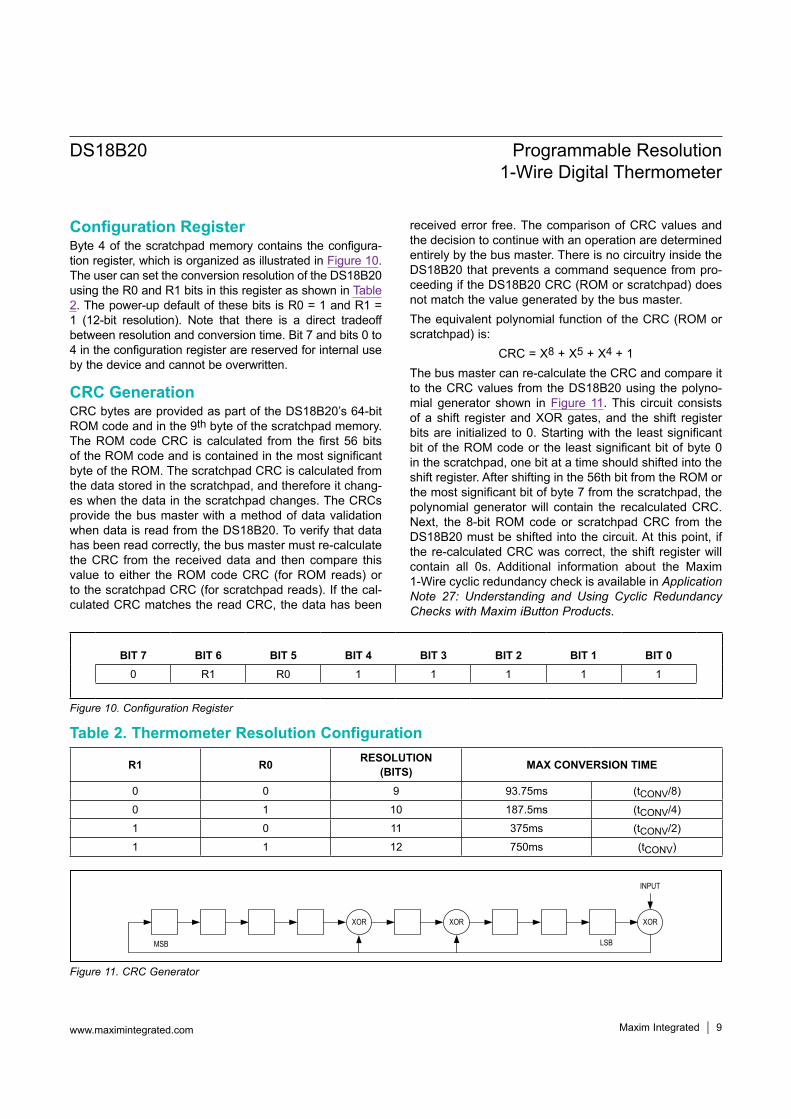
Configuration RegisterByte 4 of the scratchpad memory contains the configura-tion register, which is organized as illustrated in Figure 10. The user can set the conversion resolution of the DS18B20 using the R0 and R1 bits in this register as shown in Table 2. The power-up default of these bits is R0 = 1 and R1 = 1 (12-bit resolution). Note that there is a direct tradeoff between resolution and conversion time. Bit 7 and bits 0 to 4 in the configuration register are reserved for internal use by the device and cannot be overwritten.
CRC GenerationCRC bytes are provided as part of the DS18B20’s 64-bit ROM code and in the 9th byte of the scratchpad memory. The ROM code CRC is calculated from the first 56 bits of the ROM code and is contained in the most significant byte of the ROM. The scratchpad CRC is calculated from the data stored in the scratchpad, and therefore it chang-es when the data in the scratchpad changes. The CRCs provide the bus master with a method of data validation when data is read from the DS18B20. To verify that data has been read correctly, the bus master must re-calculate the CRC from the received data and then compare this value to either the ROM code CRC (for ROM reads) or to the scratchpad CRC (for scratchpad reads). If the cal-culated CRC matches the read CRC, the data has been
received error free. The comparison of CRC values and the decision to continue with an operation are determined entirely by the bus master. There is no circuitry inside the DS18B20 that prevents a command sequence from pro-ceeding if the DS18B20 CRC (ROM or scratchpad) does not match the value generated by the bus master.The equivalent polynomial function of the CRC (ROM or scratchpad) is:
CRC = X8 + X5 + X4 + 1The bus master can re-calculate the CRC and compare it to the CRC values from the DS18B20 using the polyno-mial generator shown in Figure 11. This circuit consists of a shift register and XOR gates, and the shift register bits are initialized to 0. Starting with the least significant bit of the ROM code or the least significant bit of byte 0 in the scratchpad, one bit at a time should shifted into the shift register. After shifting in the 56th bit from the ROM or the most significant bit of byte 7 from the scratchpad, the polynomial generator will contain the recalculated CRC. Next, the 8-bit ROM code or scratchpad CRC from the DS18B20 must be shifted into the circuit. At this point, if the re-calculated CRC was correct, the shift register will contain all 0s. Additional information about the Maxim 1-Wire cyclic redundancy check is available in Application Note 27: Understanding and Using Cyclic Redundancy Checks with Maxim iButton Products.
Figure 10. Configuration Register
Figure 11. CRC Generator
Table 2. Thermometer Resolution Configuration
R1 R0 RESOLUTION(BITS) MAX CONVERSION TIME
0 0 9 93.75ms (tCONV/8)
0 1 10 187.5ms (tCONV/4)
1 0 11 375ms (tCONV/2)
1 1 12 750ms (tCONV)
XOR XOR XOR
INPUT
MSB LSB
BIT 7 BIT 6 BIT 5 BIT 4 BIT 3 BIT 2 BIT 1 BIT 00 R1 R0 1 1 1 1 1
DS18B20 Programmable Resolution 1-Wire Digital Thermometer
www.maximintegrated.com Maxim Integrated 9
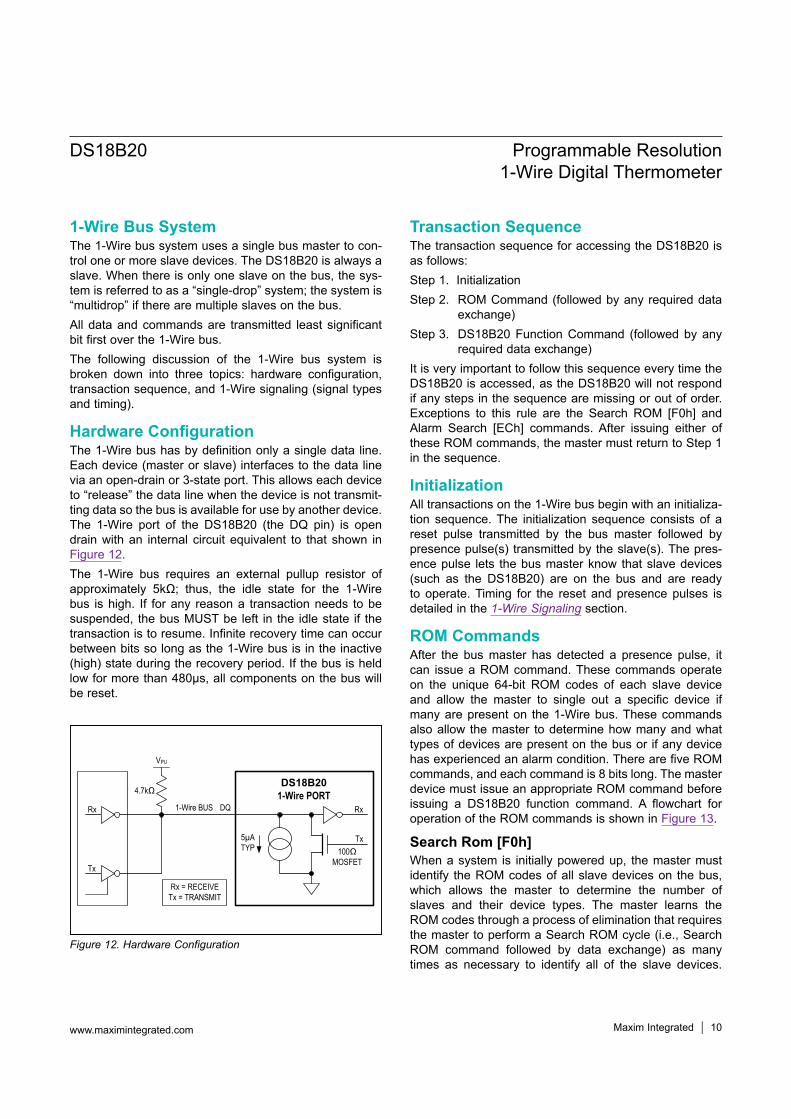
1-Wire Bus SystemThe 1-Wire bus system uses a single bus master to con-trol one or more slave devices. The DS18B20 is always a slave. When there is only one slave on the bus, the sys-tem is referred to as a “single-drop” system; the system is “multidrop” if there are multiple slaves on the bus. All data and commands are transmitted least significant bit first over the 1-Wire bus.The following discussion of the 1-Wire bus system is broken down into three topics: hardware configuration, transaction sequence, and 1-Wire signaling (signal types and timing).
Hardware ConfigurationThe 1-Wire bus has by definition only a single data line. Each device (master or slave) interfaces to the data line via an open-drain or 3-state port. This allows each device to “release” the data line when the device is not transmit-ting data so the bus is available for use by another device. The 1-Wire port of the DS18B20 (the DQ pin) is open drain with an internal circuit equivalent to that shown in Figure 12. The 1-Wire bus requires an external pullup resistor of approximately 5kΩ; thus, the idle state for the 1-Wire bus is high. If for any reason a transaction needs to be suspended, the bus MUST be left in the idle state if the transaction is to resume. Infinite recovery time can occur between bits so long as the 1-Wire bus is in the inactive (high) state during the recovery period. If the bus is held low for more than 480µs, all components on the bus will be reset.
Transaction SequenceThe transaction sequence for accessing the DS18B20 is as follows:Step 1. InitializationStep 2. ROM Command (followed by any required data
exchange)Step 3. DS18B20 Function Command (followed by any
required data exchange)It is very important to follow this sequence every time the DS18B20 is accessed, as the DS18B20 will not respond if any steps in the sequence are missing or out of order. Exceptions to this rule are the Search ROM [F0h] and Alarm Search [ECh] commands. After issuing either of these ROM commands, the master must return to Step 1 in the sequence.
InitializationAll transactions on the 1-Wire bus begin with an initializa-tion sequence. The initialization sequence consists of a reset pulse transmitted by the bus master followed by presence pulse(s) transmitted by the slave(s). The pres-ence pulse lets the bus master know that slave devices (such as the DS18B20) are on the bus and are ready to operate. Timing for the reset and presence pulses is detailed in the 1-Wire Signaling section.
ROM CommandsAfter the bus master has detected a presence pulse, it can issue a ROM command. These commands operate on the unique 64-bit ROM codes of each slave device and allow the master to single out a specific device if many are present on the 1-Wire bus. These commands also allow the master to determine how many and what types of devices are present on the bus or if any device has experienced an alarm condition. There are five ROM commands, and each command is 8 bits long. The master device must issue an appropriate ROM command before issuing a DS18B20 function command. A flowchart for operation of the ROM commands is shown in Figure 13.
Search Rom [F0h]When a system is initially powered up, the master must identify the ROM codes of all slave devices on the bus, which allows the master to determine the number of slaves and their device types. The master learns the ROM codes through a process of elimination that requires the master to perform a Search ROM cycle (i.e., Search ROM command followed by data exchange) as many times as necessary to identify all of the slave devices.
Figure 12. Hardware Configuration
DQ
VPU
4.7kΩ DS18B20
1-Wire PORTRx
Tx100Ω
MOSFET
5µATYP
1-Wire BUSRx
Tx
Rx = RECEIVETx = TRANSMIT
DS18B20 Programmable Resolution 1-Wire Digital Thermometer
www.maximintegrated.com Maxim Integrated 10

If there is only one slave on the bus, the simpler Read ROM [33h] command can be used in place of the Search ROM process. For a detailed explanation of the Search ROM procedure, refer to Application Note 937: Book of iButton® Standards. After every Search ROM cycle, the bus master must return to Step 1 (Initialization) in the transaction sequence.
Read Rom [33h]This command can only be used when there is one slave on the bus. It allows the bus master to read the slave’s 64-bit ROM code without using the Search ROM proce-dure. If this command is used when there is more than one slave present on the bus, a data collision will occur when all the slaves attempt to respond at the same time.
Match Rom [55H]The match ROM command followed by a 64-bit ROM code sequence allows the bus master to address a specific slave device on a multidrop or single-drop bus. Only the slave that exactly matches the 64-bit ROM code sequence will respond to the function command issued by the master; all other slaves on the bus will wait for a reset pulse.
Skip Rom [CCh]The master can use this command to address all devices on the bus simultaneously without sending out any ROM code information. For example, the master can make all DS18B20s on the bus perform simultaneous temperature conversions by issuing a Skip ROM command followed by a Convert T [44h] command. Note that the Read Scratchpad [BEh] command can follow the Skip ROM command only if there is a single slave device on the bus. In this case, time is saved by allowing the master to read from the slave without send-ing the device’s 64-bit ROM code. A Skip ROM command followed by a Read Scratchpad command will cause a data collision on the bus if there is more than one slave since multiple devices will attempt to transmit data simultaneously.
Alarm Search [ECh]The operation of this command is identical to the operation of the Search ROM command except that only slaves with a set alarm flag will respond. This command allows the master device to determine if any DS18B20s experienced an alarm condition during the most recent temperature conversion. After every Alarm Search cycle (i.e., Alarm Search command followed by data exchange), the bus
master must return to Step 1 (Initialization) in the transac-tion sequence. See the Operation—Alarm Signaling sec-tion for an explanation of alarm flag operation.
DS18B20 Function Commands After the bus master has used a ROM command to address the DS18B20 with which it wishes to communi-cate, the master can issue one of the DS18B20 function commands. These commands allow the master to write to and read from the DS18B20’s scratchpad memory, initiate temperature conversions and determine the power supply mode. The DS18B20 function commands, which are described below, are summarized in Table 3 and illus-trated by the flowchart in Figure 14.
Convert T [44h]This command initiates a single temperature conversion. Following the conversion, the resulting thermal data is stored in the 2-byte temperature register in the scratch-pad memory and the DS18B20 returns to its low-power idle state. If the device is being used in parasite power mode, within 10µs (max) after this command is issued the master must enable a strong pullup on the 1-Wire bus for the duration of the conversion (tCONV) as described in the Powering the DS18B20 section. If the DS18B20 is powered by an external supply, the master can issue read time slots after the Convert T command and the DS18B20 will respond by transmitting a 0 while the temperature conversion is in progress and a 1 when the conversion is done. In parasite power mode this notification technique cannot be used since the bus is pulled high by the strong pullup during the conversion.
Write Scratchpad [4Eh]This command allows the master to write 3 bytes of data to the DS18B20’s scratchpad. The first data byte is written into the TH register (byte 2 of the scratchpad), the second byte is written into the TL register (byte 3), and the third byte is written into the configuration register (byte 4). Data must be transmitted least significant bit first. All three bytes MUST be written before the master issues a reset, or the data may be corrupted.
Read Scratchpad [BEh]This command allows the master to read the contents of the scratchpad. The data transfer starts with the least sig-nificant bit of byte 0 and continues through the scratchpad until the 9th byte (byte 8 – CRC) is read. The master may issue a reset to terminate reading at any time if only part of the scratchpad data is needed.
iButton is a registered trademark of Maxim Integrated Products, Inc.
DS18B20 Programmable Resolution 1-Wire Digital Thermometer
www.maximintegrated.com Maxim Integrated 11
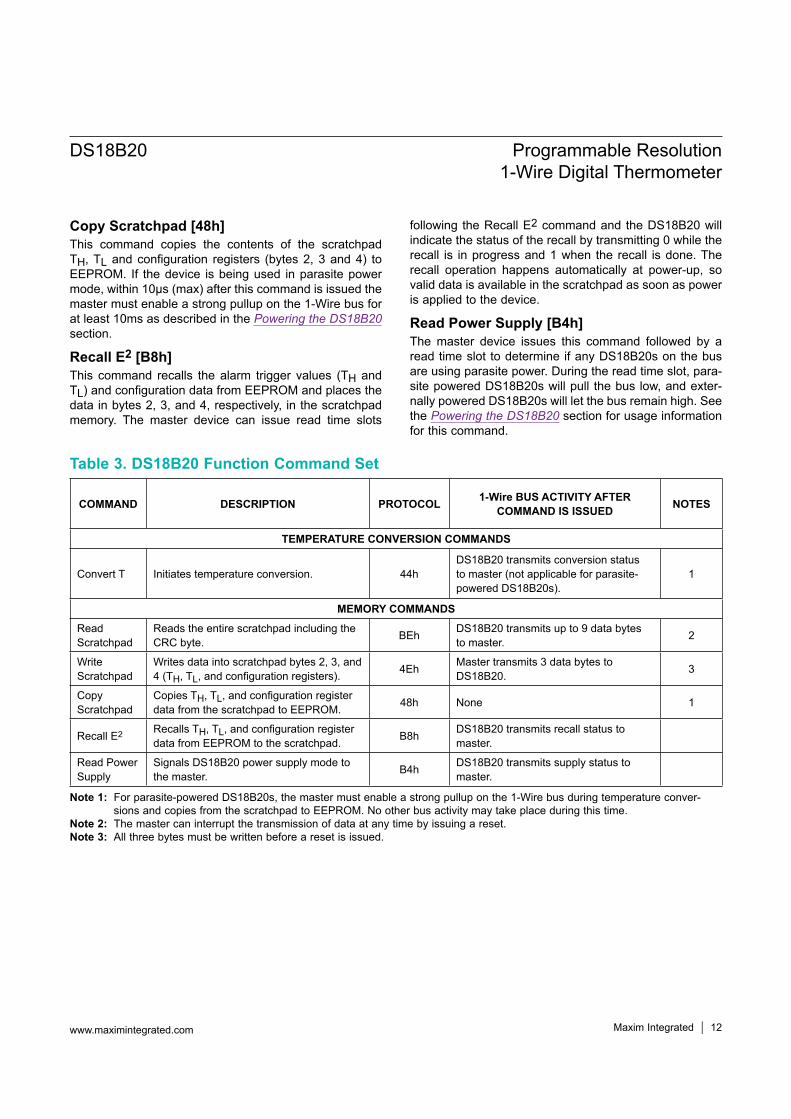
Copy Scratchpad [48h]This command copies the contents of the scratchpad TH, TL and configuration registers (bytes 2, 3 and 4) to EEPROM. If the device is being used in parasite power mode, within 10µs (max) after this command is issued the master must enable a strong pullup on the 1-Wire bus for at least 10ms as described in the Powering the DS18B20 section.
Recall E2 [B8h]This command recalls the alarm trigger values (TH and TL) and configuration data from EEPROM and places the data in bytes 2, 3, and 4, respectively, in the scratchpad memory. The master device can issue read time slots
following the Recall E2 command and the DS18B20 will indicate the status of the recall by transmitting 0 while the recall is in progress and 1 when the recall is done. The recall operation happens automatically at power-up, so valid data is available in the scratchpad as soon as power is applied to the device.
Read Power Supply [B4h]The master device issues this command followed by a read time slot to determine if any DS18B20s on the bus are using parasite power. During the read time slot, para-site powered DS18B20s will pull the bus low, and exter-nally powered DS18B20s will let the bus remain high. See the Powering the DS18B20 section for usage information for this command.
Table 3. DS18B20 Function Command Set
Note 1: For parasite-powered DS18B20s, the master must enable a strong pullup on the 1-Wire bus during temperature conver-sions and copies from the scratchpad to EEPROM. No other bus activity may take place during this time.
Note 2: The master can interrupt the transmission of data at any time by issuing a reset.Note 3: All three bytes must be written before a reset is issued.
COMMAND DESCRIPTION PROTOCOL 1-Wire BUS ACTIVITY AFTER COMMAND IS ISSUED NOTES
TEMPERATURE CONVERSION COMMANDS
Convert T Initiates temperature conversion. 44hDS18B20 transmits conversion status to master (not applicable for parasite-powered DS18B20s).
1
MEMORY COMMANDS
Read Scratchpad
Reads the entire scratchpad including the CRC byte. BEh DS18B20 transmits up to 9 data bytes
to master. 2
Write Scratchpad
Writes data into scratchpad bytes 2, 3, and 4 (TH, TL, and configuration registers). 4Eh Master transmits 3 data bytes to
DS18B20. 3
Copy Scratchpad
Copies TH, TL, and configuration register data from the scratchpad to EEPROM. 48h None 1
Recall E2 Recalls TH, TL, and configuration register data from EEPROM to the scratchpad. B8h DS18B20 transmits recall status to
master.
Read Power Supply
Signals DS18B20 power supply mode to the master. B4h DS18B20 transmits supply status to
master.
DS18B20 Programmable Resolution 1-Wire Digital Thermometer
www.maximintegrated.com Maxim Integrated 12
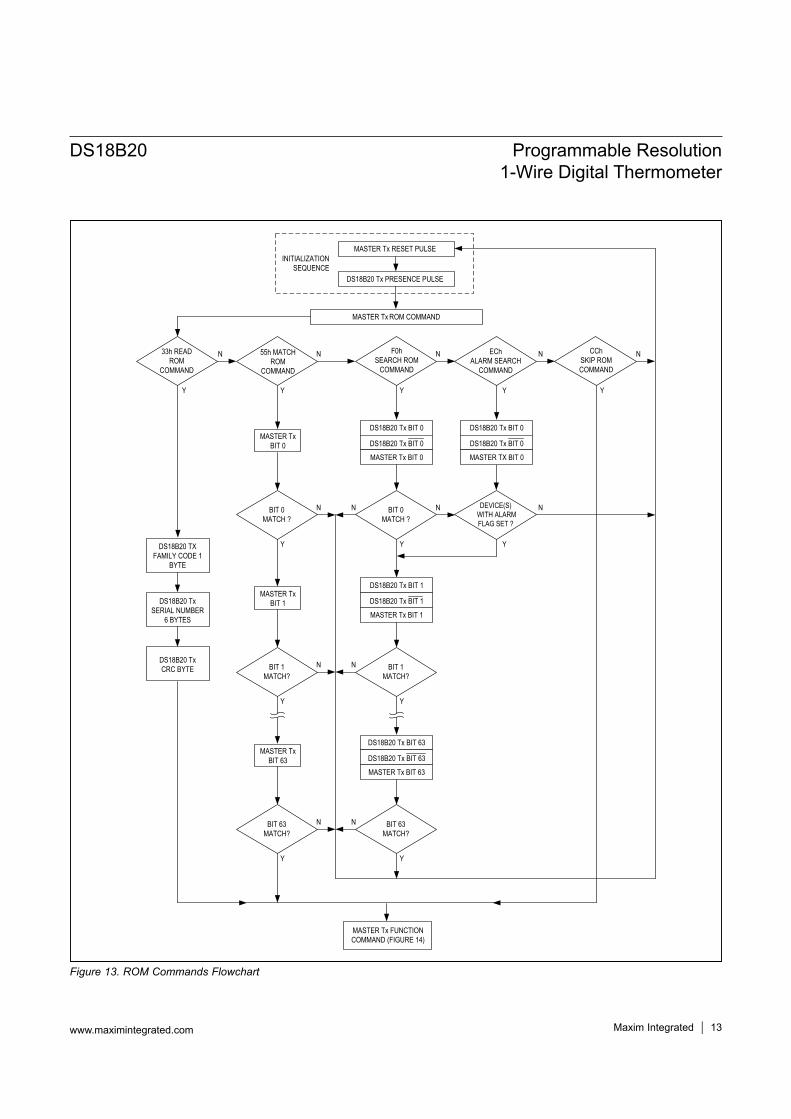
Figure 13. ROM Commands Flowchart
MASTER Tx ROM COMMAND
DS18B20 Tx PRESENCE PULSE
MASTER Tx RESET PULSEINITIALIZATION
SEQUENCE
33h READ ROM
COMMAND
55h MATCH ROM
COMMAND
F0hSEARCH ROM
COMMAND
EChALARM SEARCH
COMMAND
CChSKIP ROM COMMAND
N
Y
N
Y
N
Y
N
Y
N
Y
MASTER Tx BIT 0
DS18B20 Tx BIT 0
DS18B20 Tx BIT 0
MASTER Tx BIT 0
BIT 0 MATCH ?
BIT 0 MATCH ?
DEVICE(S) WITH ALARM FLAG SET ?
N
Y
N
Y
N
Y
N
MASTER Tx BIT 1
DS18B20 Tx BIT 1
DS18B20 Tx BIT 1
MASTER Tx BIT 1
BIT 1MATCH?
BIT 1MATCH?
N
Y Y
N
DS18B20 Tx BIT 63
DS18B20 Tx BIT 63
MASTER Tx BIT 63
MASTER Tx BIT 63
DS18B20 Tx BIT 0
DS18B20 Tx BIT 0
MASTER TX BIT 0
BIT 63MATCH?
BIT 63MATCH?
N
Y Y
N
DS18B20 TX FAMILY CODE 1
BYTE
DS18B20 Tx SERIAL NUMBER
6 BYTES
DS18B20 TxCRC BYTE
MASTER Tx FUNCTION COMMAND (FIGURE 14)
DS18B20 Programmable Resolution 1-Wire Digital Thermometer
www.maximintegrated.com Maxim Integrated 13

Figure 14. DS18B20 Function Commands Flowchart
MASTER Tx FUNCTION COMMAND
44h CONVERT TEMPERATURE ?
N
Y
PARASITE POWER ?
DS18B20 BEGINS CONVERSION
DEVICE CONVERTING
TEMPERATURE ?
Y
MASTER Rx “0s”
MASTER Rx “1s”
N
MASTER ENABLES STRONG PULL-UP ON DQ
DS18B20 CONVERTS TEMPERATURE
MASTER DISABLES STRONG PULLUP
YN
B4h READ POWER SUPPLY ?
Y
PARASITE POWER ?
Y
N
MASTER Rx “1s”
MASTER Rx “0s”
N
B8h RECALL E2 ?
Y
MASTER BEGINS DATA RECALL FROM
E2 PROM
DEVICE BUSY RECALLING
DATA ?
Y
MASTER Rx “0s”
MASTER Rx “1s”
N
N BEh READ SCRATCHPAD ?
N
MASTER Rx DATA BYTE FROM
SCRATCHPAD
MASTER Tx RESET ?
HAVE 8 BYTES BEEN READ ?
MASTER Rx SCRATCHPAD CRC
BYTE
N
Y
N
Y
MASTER Tx TH BYTE TO SCRATCHPAD
MASTER Tx TL BYTE TO SCRATCHPAD
MASTER TX CONFIG. BYTE TO SCRATCHPAD
4Eh WRITE SCRATCHPAD ?
N
Y
48h COPY SCRATCHPAD ?
N
Y
PARASITE POWER ?
COPY IN PROGRESS ?
Y
MASTER Rx “0s”
MASTER Rx “1s”
N
MASTER ENABLES STRONG PULL-UP ON DQ
DATA COPIED FROM SCRATCHPAD TO EEPROM
MASTER DISABLES STRONG PULLUP
YN
RETURN TO INITIALIZATION SEQUENCE (FIGURE 13)
FOR NEXT TRANSACTION
Y
DS18B20 Programmable Resolution 1-Wire Digital Thermometer
www.maximintegrated.com Maxim Integrated 14

1-Wire SignalingThe DS18B20 uses a strict 1-Wire communication pro-tocol to ensure data integrity. Several signal types are defined by this protocol: reset pulse, presence pulse, write 0, write 1, read 0, and read 1. The bus master initiates all these signals, with the exception of the presence pulse.
Initialization Procedure—Reset And Presence PulsesAll communication with the DS18B20 begins with an ini-tialization sequence that consists of a reset pulse from the master followed by a presence pulse from the DS18B20. This is illustrated in Figure 15. When the DS18B20 sends the presence pulse in response to the reset, it is indicating to the master that it is on the bus and ready to operate. During the initialization sequence the bus master trans-mits (TX) the reset pulse by pulling the 1-Wire bus low for a minimum of 480µs. The bus master then releases the bus and goes into receive mode (RX). When the bus is released, the 5kΩ pullup resistor pulls the 1-Wire bus high. When the DS18B20 detects this rising edge, it waits 15µs to 60µs and then transmits a presence pulse by pull-ing the 1-Wire bus low for 60µs to 240µs.
Read/Write Time SlotsThe bus master writes data to the DS18B20 during write time slots and reads data from the DS18B20 during read time slots. One bit of data is transmitted over the 1-Wire bus per time slot.
Write Time SlotsThere are two types of write time slots: “Write 1” time slots and “Write 0” time slots. The bus master uses a Write 1 time slot to write a logic 1 to the DS18B20 and a Write 0 time slot to write a logic 0 to the DS18B20. All write time slots must be a minimum of 60µs in duration with a minimum of a 1µs recovery time between individual write slots. Both types of write time slots are initiated by the master pulling the 1-Wire bus low (see Figure 14).To generate a Write 1 time slot, after pulling the 1-Wire bus low, the bus master must release the 1-Wire bus within 15µs. When the bus is released, the 5kΩ pullup resistor will pull the bus high. To generate a Write 0 time slot, after pulling the 1-Wire bus low, the bus master must continue to hold the bus low for the duration of the time slot (at least 60µs).The DS18B20 samples the 1-Wire bus during a window that lasts from 15µs to 60µs after the master initiates the write time slot. If the bus is high during the sampling win-dow, a 1 is written to the DS18B20. If the line is low, a 0 is written to the DS18B20.
Figure 15. Initialization Timing
LINE TYPE LEGEND
DS18B20 PULLING LOW
RESISTOR PULLUP
MASTER Tx RESET PULSE480µs MINIMUM
MASTER Rx480µs MINIMUM
DS18B20 WAITS 15-60µs
VPU
1-Wire BUS
GND
DS18B20 TX PRESENCE PULSE 60-240µS
BUS MASTER PULLING LOW
DS18B20 Programmable Resolution 1-Wire Digital Thermometer
www.maximintegrated.com Maxim Integrated 15
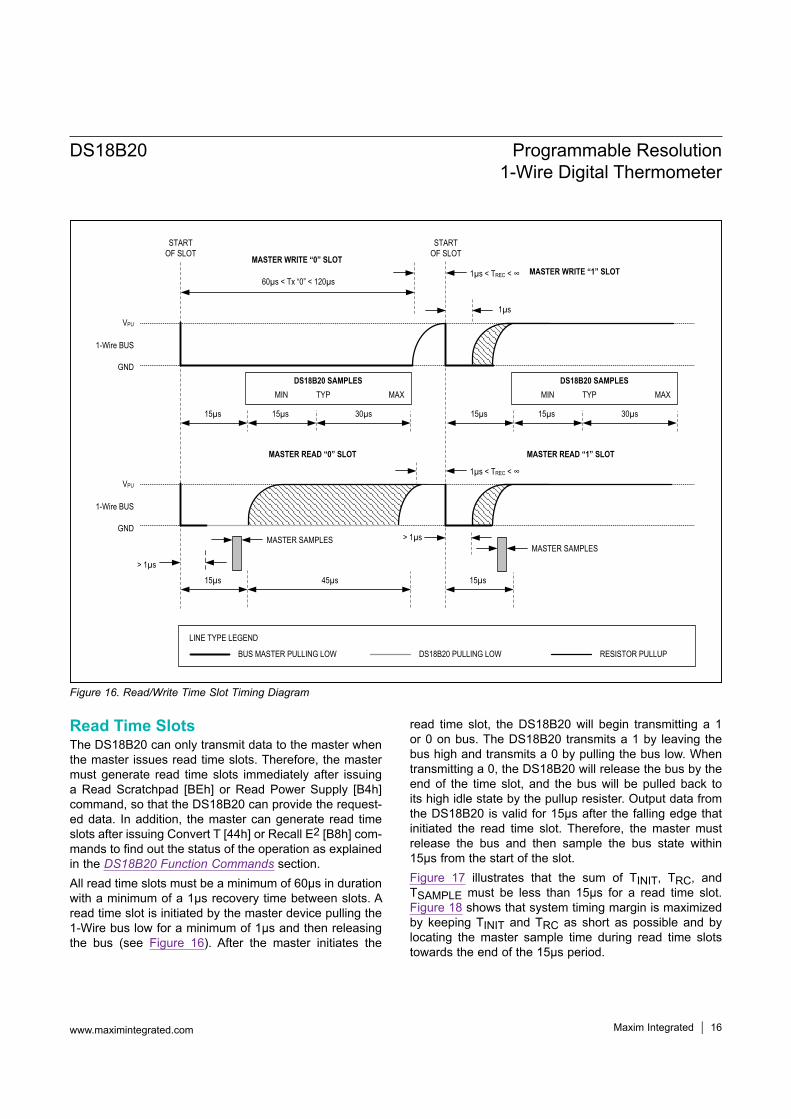
Read Time SlotsThe DS18B20 can only transmit data to the master when the master issues read time slots. Therefore, the master must generate read time slots immediately after issuing a Read Scratchpad [BEh] or Read Power Supply [B4h] command, so that the DS18B20 can provide the request-ed data. In addition, the master can generate read time slots after issuing Convert T [44h] or Recall E2 [B8h] com-mands to find out the status of the operation as explained in the DS18B20 Function Commands section.All read time slots must be a minimum of 60µs in duration with a minimum of a 1µs recovery time between slots. A read time slot is initiated by the master device pulling the 1-Wire bus low for a minimum of 1µs and then releasing the bus (see Figure 16). After the master initiates the
read time slot, the DS18B20 will begin transmitting a 1 or 0 on bus. The DS18B20 transmits a 1 by leaving the bus high and transmits a 0 by pulling the bus low. When transmitting a 0, the DS18B20 will release the bus by the end of the time slot, and the bus will be pulled back to its high idle state by the pullup resister. Output data from the DS18B20 is valid for 15µs after the falling edge that initiated the read time slot. Therefore, the master must release the bus and then sample the bus state within 15µs from the start of the slot.Figure 17 illustrates that the sum of TINIT, TRC, and TSAMPLE must be less than 15µs for a read time slot. Figure 18 shows that system timing margin is maximized by keeping TINIT and TRC as short as possible and by locating the master sample time during read time slots towards the end of the 15µs period.
Figure 16. Read/Write Time Slot Timing Diagram
MASTER WRITE “0” SLOTMASTER WRITE “1” SLOT
MASTER READ “0” SLOT MASTER READ “1” SLOT
60µs < Tx “0” < 120µs
STARTOF SLOT
STARTOF SLOT
1µs < TREC < ∞
1µs
MIN TYP MAXDS18B20 SAMPLES
15µs 15µs 30µs
MIN TYP MAXDS18B20 SAMPLES
15µs 15µs 30µs
VPU
1-Wire BUS
GND
VPU
1-Wire BUS
GND
1µs < TREC < ∞
15µs
> 1µs
MASTER SAMPLES
45µs
MASTER SAMPLES> 1µs
15µs
LINE TYPE LEGEND
RESISTOR PULLUPDS18B20 PULLING LOWBUS MASTER PULLING LOW
DS18B20 Programmable Resolution 1-Wire Digital Thermometer
www.maximintegrated.com Maxim Integrated 16
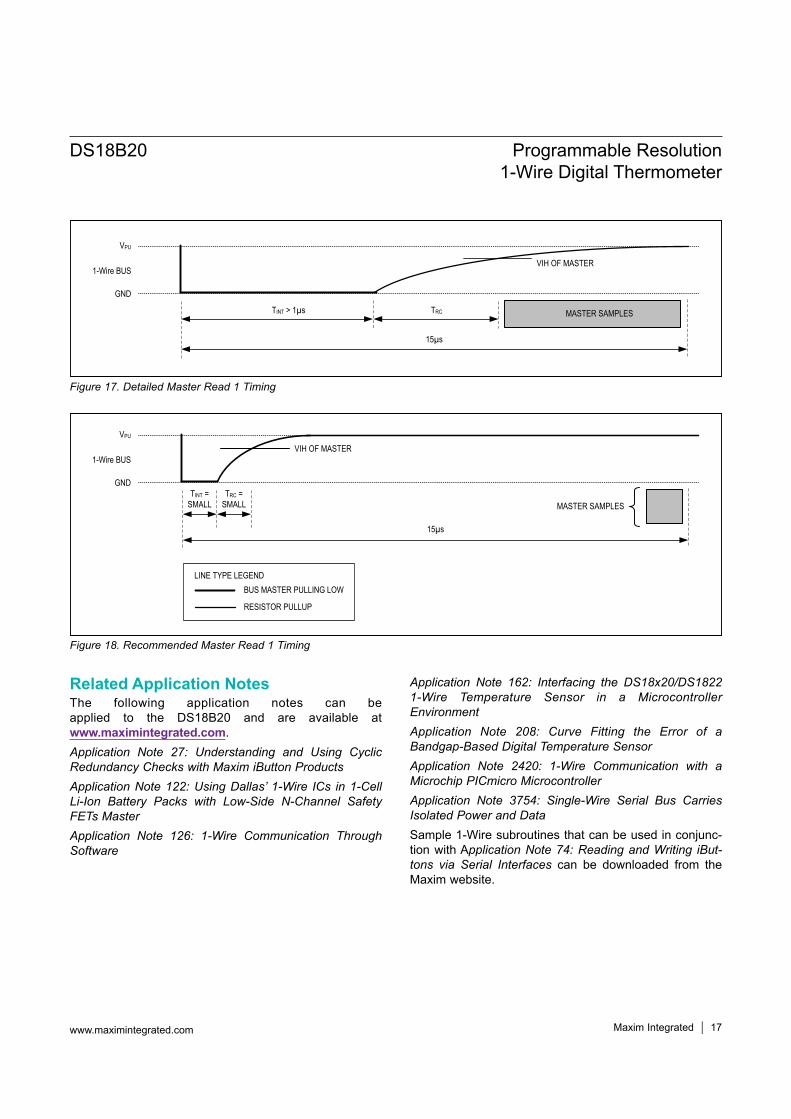
Related Application NotesThe following application notes can be applied to the DS18B20 and are available at www.maximintegrated.com.Application Note 27: Understanding and Using Cyclic Redundancy Checks with Maxim iButton ProductsApplication Note 122: Using Dallas’ 1-Wire ICs in 1-Cell Li-Ion Battery Packs with Low-Side N-Channel Safety FETs Master Application Note 126: 1-Wire Communication Through Software
Application Note 162: Interfacing the DS18x20/DS1822 1-Wire Temperature Sensor in a Microcontroller EnvironmentApplication Note 208: Curve Fitting the Error of a Bandgap-Based Digital Temperature Sensor Application Note 2420: 1-Wire Communication with a Microchip PICmicro Microcontroller Application Note 3754: Single-Wire Serial Bus Carries Isolated Power and DataSample 1-Wire subroutines that can be used in conjunc-tion with Application Note 74: Reading and Writing iBut-tons via Serial Interfaces can be downloaded from the Maxim website.
Figure 17. Detailed Master Read 1 Timing
Figure 18. Recommended Master Read 1 Timing
VIH OF MASTER
MASTER SAMPLES
VPU
1-Wire BUS
GND
15µs
TINT > 1µs TRC
VIH OF MASTER
LINE TYPE LEGEND
RESISTOR PULLUP
BUS MASTER PULLING LOW
MASTER SAMPLES
15µs
TINT = SMALL
TRC = SMALL
VPU
1-Wire BUS
GND
DS18B20 Programmable Resolution 1-Wire Digital Thermometer
www.maximintegrated.com Maxim Integrated 17
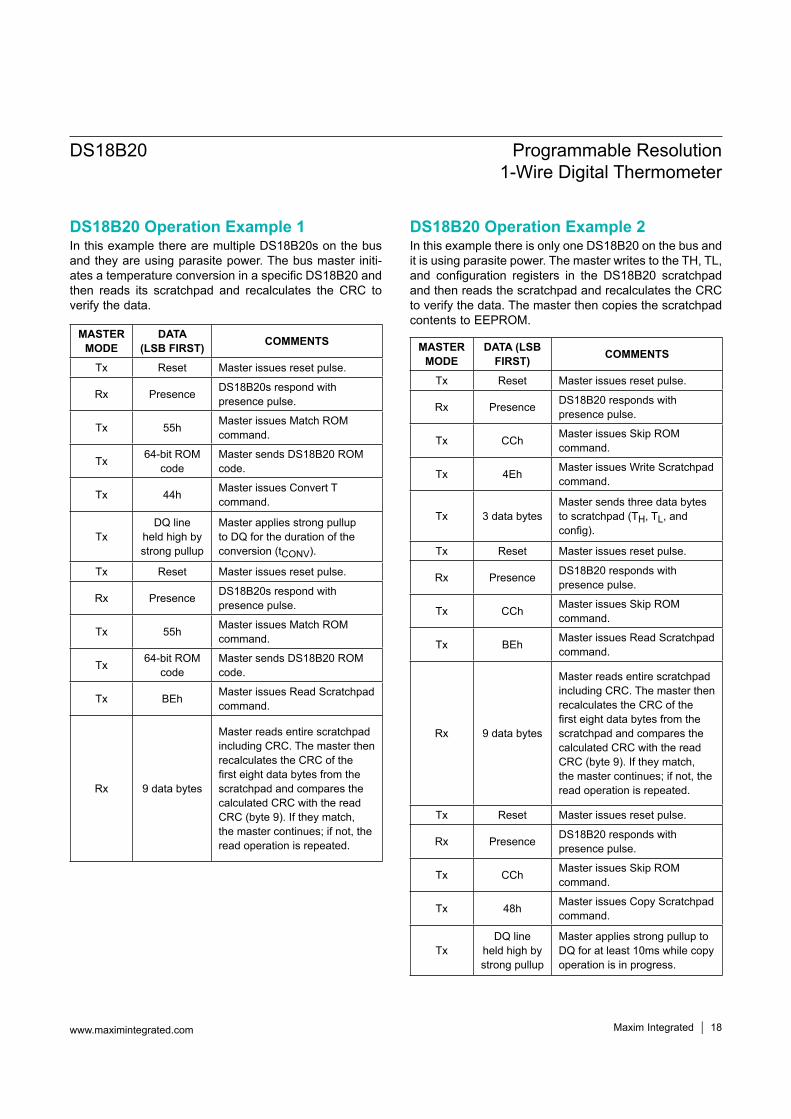
DS18B20 Operation Example 1In this example there are multiple DS18B20s on the bus and they are using parasite power. The bus master initi-ates a temperature conversion in a specific DS18B20 and then reads its scratchpad and recalculates the CRC to verify the data.
DS18B20 Operation Example 2In this example there is only one DS18B20 on the bus and it is using parasite power. The master writes to the TH, TL, and configuration registers in the DS18B20 scratchpad and then reads the scratchpad and recalculates the CRC to verify the data. The master then copies the scratchpad contents to EEPROM.
MASTER MODE
DATA (LSB FIRST) COMMENTS
Tx Reset Master issues reset pulse.
Rx Presence DS18B20s respond with presence pulse.
Tx 55h Master issues Match ROM command.
Tx 64-bit ROM code
Master sends DS18B20 ROM code.
Tx 44h Master issues Convert T command.
TxDQ line
held high by strong pullup
Master applies strong pullup to DQ for the duration of the conversion (tCONV).
Tx Reset Master issues reset pulse.
Rx Presence DS18B20s respond with presence pulse.
Tx 55h Master issues Match ROM command.
Tx 64-bit ROM code
Master sends DS18B20 ROM code.
Tx BEh Master issues Read Scratchpad command.
Rx 9 data bytes
Master reads entire scratchpad including CRC. The master then recalculates the CRC of the first eight data bytes from the scratchpad and compares the calculated CRC with the read CRC (byte 9). If they match, the master continues; if not, the read operation is repeated.
MASTER MODE
DATA (LSB FIRST) COMMENTS
Tx Reset Master issues reset pulse.
Rx Presence DS18B20 responds with presence pulse.
Tx CCh Master issues Skip ROM command.
Tx 4Eh Master issues Write Scratchpad command.
Tx 3 data bytesMaster sends three data bytes to scratchpad (TH, TL, and config).
Tx Reset Master issues reset pulse.
Rx Presence DS18B20 responds with presence pulse.
Tx CCh Master issues Skip ROM command.
Tx BEh Master issues Read Scratchpad command.
Rx 9 data bytes
Master reads entire scratchpad including CRC. The master then recalculates the CRC of the first eight data bytes from the scratchpad and compares the calculated CRC with the read CRC (byte 9). If they match, the master continues; if not, the read operation is repeated.
Tx Reset Master issues reset pulse.
Rx Presence DS18B20 responds with presence pulse.
Tx CCh Master issues Skip ROM command.
Tx 48h Master issues Copy Scratchpad command.
TxDQ line
held high by strong pullup
Master applies strong pullup to DQ for at least 10ms while copy operation is in progress.
DS18B20 Programmable Resolution 1-Wire Digital Thermometer
www.maximintegrated.com Maxim Integrated 18
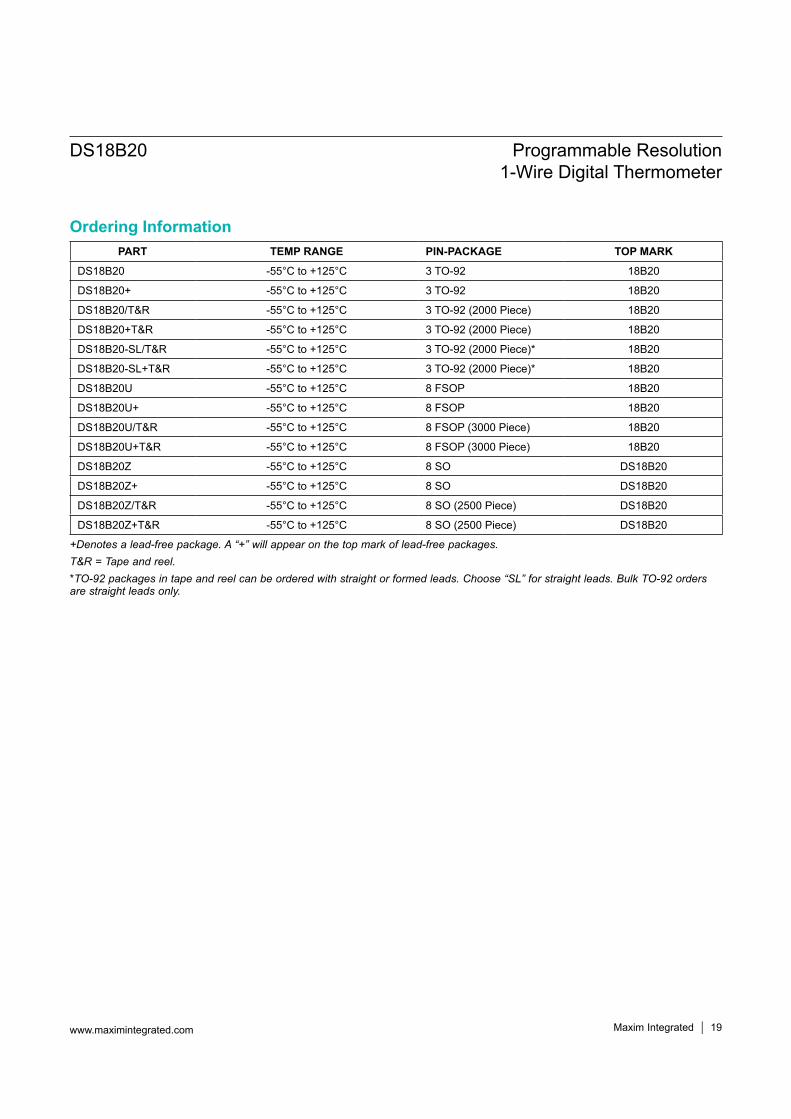
+Denotes a lead-free package. A “+” will appear on the top mark of lead-free packages.T&R = Tape and reel.*TO-92 packages in tape and reel can be ordered with straight or formed leads. Choose “SL” for straight leads. Bulk TO-92 orders are straight leads only.
PART TEMP RANGE PIN-PACKAGE TOP MARK
DS18B20 -55°C to +125°C 3 TO-92 18B20
DS18B20+ -55°C to +125°C 3 TO-92 18B20
DS18B20/T&R -55°C to +125°C 3 TO-92 (2000 Piece) 18B20
DS18B20+T&R -55°C to +125°C 3 TO-92 (2000 Piece) 18B20
DS18B20-SL/T&R -55°C to +125°C 3 TO-92 (2000 Piece)* 18B20
DS18B20-SL+T&R -55°C to +125°C 3 TO-92 (2000 Piece)* 18B20
DS18B20U -55°C to +125°C 8 FSOP 18B20
DS18B20U+ -55°C to +125°C 8 FSOP 18B20
DS18B20U/T&R -55°C to +125°C 8 FSOP (3000 Piece) 18B20
DS18B20U+T&R -55°C to +125°C 8 FSOP (3000 Piece) 18B20
DS18B20Z -55°C to +125°C 8 SO DS18B20
DS18B20Z+ -55°C to +125°C 8 SO DS18B20
DS18B20Z/T&R -55°C to +125°C 8 SO (2500 Piece) DS18B20
DS18B20Z+T&R -55°C to +125°C 8 SO (2500 Piece) DS18B20
DS18B20 Programmable Resolution 1-Wire Digital Thermometer
www.maximintegrated.com Maxim Integrated 19
Ordering Information

REVISION DATE DESCRIPTION PAGES
CHANGED
030107 In the Absolute Maximum Ratings section, removed the reflow oven temperature value of +220°C. Reference to JEDEC specification for reflow remains. 19
101207
In the Operation—Alarm Signaling section, added “or equal to” in the description for a TH alarm condition 5
In the Memory section, removed incorrect text describing memory. 7
In the Configuration Register section, removed incorrect text describing configuration register. 8
042208 In the Ordering Information table, added TO-92 straight-lead packages and included a note that the TO-92 package in tape and reel can be ordered with either formed or straight leads. 2
1/15 Updated Benefits and Features section 1
Maxim Integrated cannot assume responsibility for use of any circuitry other than circuitry entirely embodied in a Maxim Integrated product. No circuit patent licenses are implied. Maxim Integrated reserves the right to change the circuitry and specifications without notice at any time. The parametric values (min and max limits) shown in the Electrical Characteristics table are guaranteed. Other parametric values quoted in this data sheet are provided for guidance.
Maxim Integrated and the Maxim Integrated logo are trademarks of Maxim Integrated Products, Inc.
DS18B20 Programmable Resolution 1-Wire Digital Thermometer
© 2015 Maxim Integrated Products, Inc. 20
Revision History
For pricing, delivery, and ordering information, please contact Maxim Direct at 1-888-629-4642, or visit Maxim Integrated’s website at www.maximintegrated.com.

APENDICE C. HOJA DE ESPECIFICACIONES (DATASHEET) DE LOS SENSORESESTUDIADOS
C.2. Datasheet de los Termistores NTC utiliza-
dos en los Sensores de Temperatura KE-
YES KY-013 y KEYES KY-028
124

Electronic Alliance www.eaa.net.au
1 / 3
NTC THERMISTOR OF MF52-TYPE SERIES SPECIFICATION
* Outline:
The MF52 thermistor is a small-sized,epoxy-resin coated NTC resistor made from new-type material with new craftsmanship.It is featured with advantages including high precision and quick reaction
* Application:
Air conditioners, heating facilitied,electronic thermometers ,fluid level sensors,automobile electronics and electronic table-calendars.
* Features:
1.High testing precision; 2.Small and quick in reaction; 3.Long and good service; 4.Good interconvertibility and consistency.
* Part NO.:
① ② ③ ④ ⑤ ⑥ ① Drop-like NTC thermistor ② E:Epoxy-resin coated package S:Silicone coated package ③ R25: 10KΩ-103 ④ Tolerance: F:±1% G:±2% H:±30% J:±5% K:±10% ⑤ L:B25/50 H:B25/85 T:Special ⑥ B-value:347:3470 338:3380 we adopted the former three digits
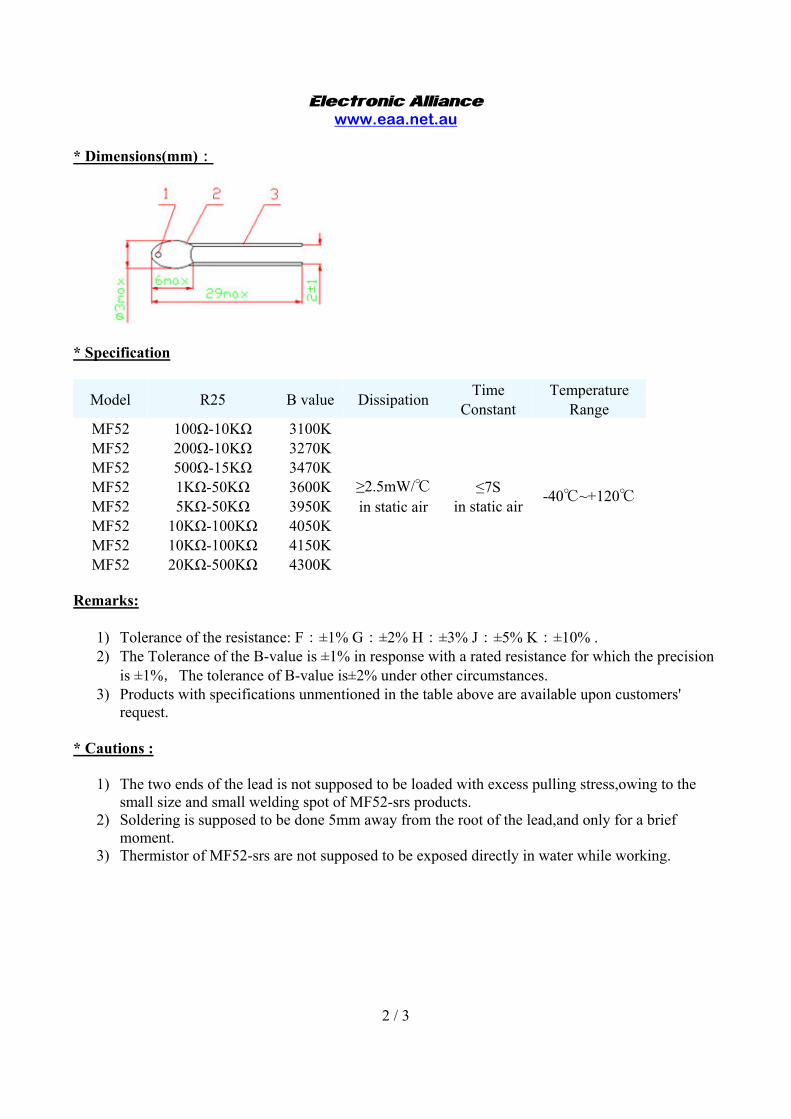
Electronic Alliance www.eaa.net.au
2 / 3
* Dimensions(mm):
* Specification
Model R25 B value Dissipation Time Constant
Temperature Range
MF52 100Ω-10KΩ 3100K MF52 200Ω-10KΩ 3270K MF52 500Ω-15KΩ 3470K MF52 1KΩ-50KΩ 3600K MF52 5KΩ-50KΩ 3950K MF52 10KΩ-100KΩ 4050K MF52 10KΩ-100KΩ 4150K MF52 20KΩ-500KΩ 4300K
≥2.5mW/ in static air
≤7S in static air
-40~+120
Remarks:
1) Tolerance of the resistance: F:±1% G:±2% H:±3% J:±5% K:±10% . 2) The Tolerance of the B-value is ±1% in response with a rated resistance for which the precision
is ±1%,The tolerance of B-value is±2% under other circumstances. 3) Products with specifications unmentioned in the table above are available upon customers'
request.
* Cautions :
1) The two ends of the lead is not supposed to be loaded with excess pulling stress,owing to the small size and small welding spot of MF52-srs products.
2) Soldering is supposed to be done 5mm away from the root of the lead,and only for a brief moment.
3) Thermistor of MF52-srs are not supposed to be exposed directly in water while working.

Electronic Alliance www.eaa.net.au
3 / 3
Normal specification Resistance & Temperature Table of MF52-type (Unit:KΩ)
10 KΩ 50 KΩ 100 KΩ 50 KΩ 50 KΩ 100 KΩ 100 KΩ 150 KΩ
3950 3950 4000 4050 4150 4150 4300 4500
-30 181.70 908.30 1790.00 -25 133.30 666.50 1321.00 -20 98.88 494.50 984.70 -15 74.10 370.50 740.80 -10 56.06 280.30 562.30 -5 42.80 214.00 430.50 0 98.96 164.80 332.30 168.80 172.00 344.10 352.40 576.70 5 25.58 127.90 257.50 131.30 132.20 264.30 270.00 433.20
10 20.00 99.98 201.10 101.00 102.40 204.80 208.30 328.40 15 15.76 78.79 158.20 79.28 80.03 160.10 161.90 250.90 20 12.51 62.55 125.40 62.78 63.00 125.00 136.70 193.30 25 10.00 50.00 100.00 50.00 50.00 100.00 100.00 150.00 30 8.048 40.24 80.29 39.98 39.76 79.51 78.35 117.30 35 6.518 32.59 64.87 32.16 31.89 63.77 62.37 92.28 40 5.312 26.56 57.72 26.10 25.73 51.45 49.94 73.11 45 4.354 21.77 43.10 21.35 20.88 41.76 40.22 58.28 50 3.588 17.94 35.42 17.72 17.04 34.08 32.56 46.74 55 2.974 14.87 29.26 14.36 13.99 27.97 26.40 37.71 60 2.476 12.38 24.30 11.92 11.53 23.06 21.53 30.58 65 2.072 10.36 20.27 9.938 9.541 19.08 17.69 24.94 70 1.743 8.717 16.99 8.317 7.929 15.86 14.62 20.45 75 1.473 7.364 14.31 6.991 6.621 13.24 12.20 16.85 80 1.250 6.248 12.10 5.906 5.552 11.10 10.05 13.94 85 1.065 5.324 10.27 5.012 4.674 9.348 8.376 11.60 90 0.911 4.555 8.758 4.271 3.950 7.900 7.004 9.680 95 0.7824 3.912 7.495 3.654 3.349 6.698 5.894 8.118 100 0.6744 3.372 6.438 3.316 2.849 5.698 4.978 6.836 105 0.5836 2.918 5.550 2.701 2.438 4.875 4.215 5.780 110 0.5066 2.533 4.801 2.336 2.093 4.186 3.580 4.904

APENDICE C. HOJA DE ESPECIFICACIONES (DATASHEET) DE LOS SENSORESESTUDIADOS
C.3. Datasheet del Sensor de Ultrasonidos HC-
SR04
128

Tech Support: [email protected]
Ultrasonic Ranging Module HC - SR04
Product features:
Ultrasonic ranging module HC - SR04 provides 2cm - 400cm non-contact measurement function, the ranging accuracy can reach to 3mm. The modules includes ultrasonic transmitters, receiver and control circuit. The basic principle of work: (1) Using IO trigger for at least 10us high level signal, (2) The Module automatically sends eight 40 kHz and detect whether there is a pulse signal back. (3) IF the signal back, through high level , time of high output IO duration is the time from sending ultrasonic to returning. Test distance = (high level time×velocity of sound (340M/S) / 2,
Wire connecting direct as following:
5V Supply Trigger Pulse Input Echo Pulse Output 0V Ground
Electric Parameter
Working Voltage DC 5 V
Working Current 15mA
Working Frequency 40Hz
Max Range 4m
Min Range 2cm
MeasuringAngle 15 degree
Trigger Input Signal 10uS TTL pulse
Echo Output Signal Input TTL lever signal and the range in
proportion
Dimension 45*20*15mm
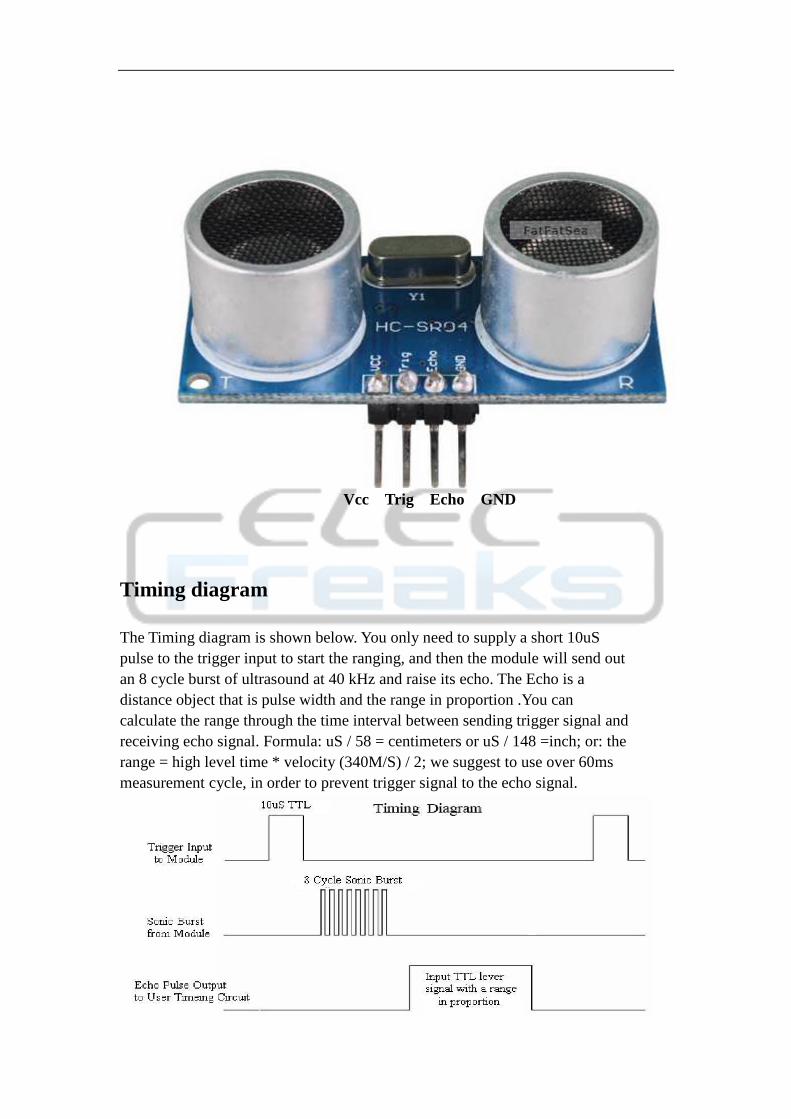
Vcc Trig Echo GND
Timing diagram
The Timing diagram is shown below. You only need to supply a short 10uS pulse to the trigger input to start the ranging, and then the module will send out an 8 cycle burst of ultrasound at 40 kHz and raise its echo. The Echo is a distance object that is pulse width and the range in proportion .You can calculate the range through the time interval between sending trigger signal and receiving echo signal. Formula: uS / 58 = centimeters or uS / 148 =inch; or: the range = high level time * velocity (340M/S) / 2; we suggest to use over 60ms measurement cycle, in order to prevent trigger signal to the echo signal.

Attention:
The module is not suggested to connect directly to electric, if connected electric, the GND terminal should be connected the module first, otherwise, it will affect the normal work of the module. When tested objects, the range of area is n ot less than 0.5 square meters and the plane requests as smooth as possible, otherwise ,it will affect the results of measuring.
www.Elecfreaks.com

APENDICE C. HOJA DE ESPECIFICACIONES (DATASHEET) DE LOS SENSORESESTUDIADOS
C.4. Datasheet de la del Sensor de Fotoresistor
KEYES KY-018 (Fotoresistencia)
132

Light dependent resistors
Issued March 1997
NORP12 RS stock number 651-507NSL19-M51 RS stock number 596-141
Two cadmium sulphide (cdS) photoconductive cellswith spectral responses similar to that of the humaneye. The cell resistance falls with increasing light inten-sity. Applications include smoke detection, automaticlighting control, batch counting and burglar alarm sys-tems.
Guide to source illuminationsLight source Illumination (Lux)Moonlight __________________________________ 0.160W bulb at 1m ______________________________ 501W MES bulb at 0.1m ________________________ 100Fluorescent lighting __________________________ 500Bright sunlight ____________________________ 30,000
Light memory characteristicsLight dependent resistors have a particular property inthat they remember the lighting conditions in whichthey have been stored. This memory effect can beminimised by storing the LDRs in light prior to use.Light storage reduces equilibrium time to reachsteady resistance values.
NORP12 (RS stock no. 651-507)
Absolute maximum ratingsVoltage, ac or dc peak ______________________ 320VCurrent __________________________________ 75mAPower dissipation at 30°C _________________ 250mWOperating temperature range _______ -60°C to +75°C
Electrical characteristicsTA = 25°C. 2854°K tungsten light source
1. Dark to 110% RL2. To 10 3 RLRL = photocell resistance under given illumination.
Features Wide spectral response Low cost Wide ambient temperature range.
Circuit symbol
Parameter Conditions Min. Typ. Max. Units
Cell resistance 1000 lux - 400 - Ω10 lux - 9 - kΩ
Dark resistance - 1.0 - - MΩDark capacitance - - 3.5 - pF
Rise time 1 1000 lux - 2.8 - ms10 lux - 18 - ms
Fall time 2 1000 lux - 48 - ms10 lux - 120 - ms
Dimensions
232-3816Data pack F
Data Sheet

232-3816
2
Figure 1 Power dissipation derating Figure 3 Resistance as a function of illumination
Figure 2 Spectral response
*1Ftc=10.764 lumens
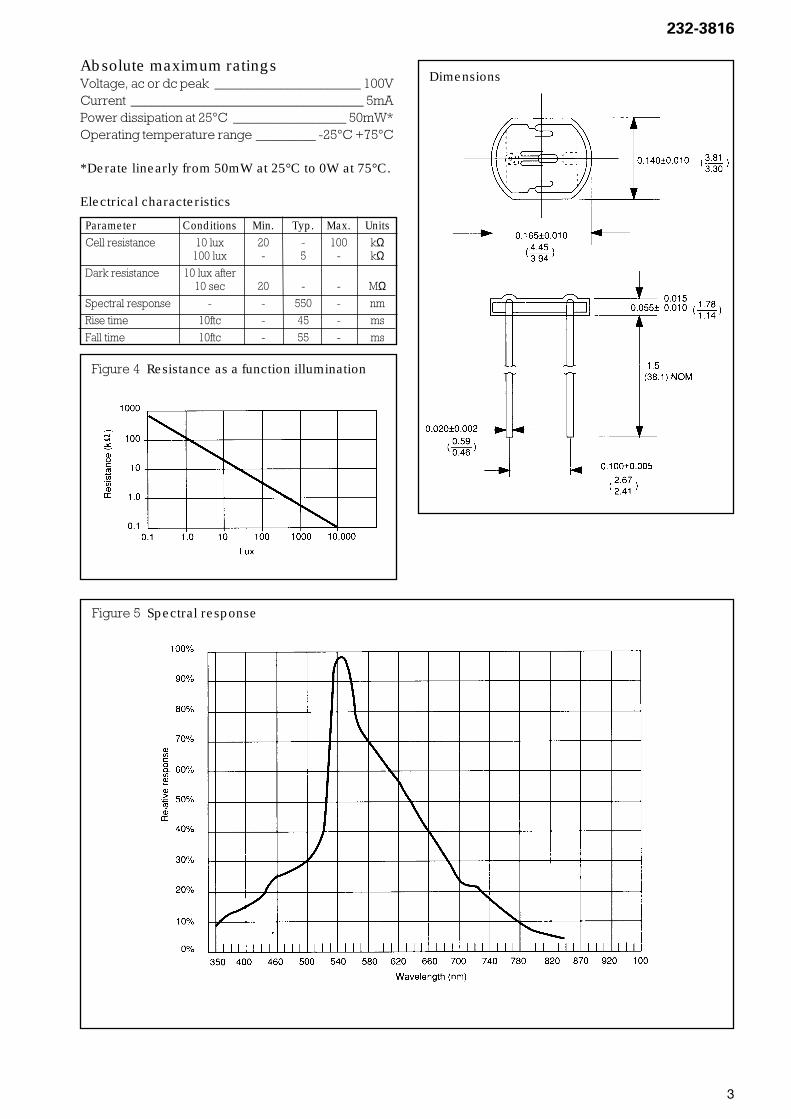
232-3816
3
Absolute maximum ratingsVoltage, ac or dc peak ______________________ 100VCurrent ___________________________________ 5mAPower dissipation at 25°C _________________ 50mW*Operating temperature range _________ -25°C +75°C
*Derate linearly from 50mW at 25°C to 0W at 75°C.
Electrical characteristics
Dimensions
Parameter Conditions Min. Typ. Max. Units
Cell resistance 10 lux 20 - 100 kΩ100 lux - 5 - kΩ
Dark resistance 10 lux after10 sec 20 - - MΩ
Spectral response - - 550 - nm
Rise time 10ftc - 45 - ms
Fall time 10ftc - 55 - ms
Figure 4 Resistance as a function illumination
Figure 5 Spectral response

232-3816
Typical application circuits
Figure 8 Automatic light circuit
Figure 7 Light interruption detector
Figure 6 Sensitive light operated relay Figure 9 Logarithmic law photographic light meter
Figure 10 Extremely sensitive light operated relay
Relay energised when light level increases above thelevel set by VR1
Typical value R1 = 100kΩR2 = 200kΩ preset to give two overlapping ranges.(Calibration should be made against an accurate meter.)
As Figure 6 relay energised when light level dropsbelow the level set by VR1 (Relay energised when light exceeds preset level.)
Incorporates a balancing bridge and op-amp. R1 andNORP12 may be interchanged for the reverse function.
Adjust turn-on point with VR1
The information provided in RS technical literature is believed to be accurate and reliable; however, RS Components assumes no responsibility for inaccuraciesor omissions, or for the use of this information, and all use of such information shall be entirely at the user’s own risk.No responsibility is assumed by RS Components for any infringements of patents or other rights of third parties which may result from its use.Specifications shown in RS Components technical literature are subject to change without notice.
RS Components, PO Box 99, Corby, Northants, NN17 9RS Telephone: 01536 201234An Electrocomponents Company © RS Components 1997

APENDICE C. HOJA DE ESPECIFICACIONES (DATASHEET) DE LOS SENSORESESTUDIADOS
C.5. Datasheet del sensor de Humedad KEYES
KY-015 (DHT11)
137

Temperature and humidity module
DHT11 Product Manual
www.aosong.com

Aosong(Guangzhou) Electronics Co.,Ltd. TEL:020-36042809 / 36380552 www.aosong.com - 1 -
1、Product Overview
DHT11 digital temperature and humidity sensor is a composite Sensor contains a calibrated
digital signal output of the temperature and humidity. Application of a dedicated digital modules
collection technology and the temperature and humidity sensing technology, to ensure that the
product has high reliability and excellent long-term stability. The sensor includes a resistive sense
of wet components and an NTC temperature measurement devices, and connected with a
high-performance 8-bit microcontroller.
2、Applications
HVAC, dehumidifier, testing and inspection equipment, consumer goods, automotive, automatic
control, data loggers, weather stations, home appliances, humidity regulator, medical and other humidity
measurement and control.
3、Features
Low cost, long-term stability, relative humidity and temperature measurement, excellent quality, fast
response, strong anti-interference ability, long distance signal transmission, digital signal output, and
precise calibration.
4、Dimensions (unit: mm)

Aosong(Guangzhou) Electronics Co.,Ltd. TEL:020-36042809 / 36380552 www.aosong.com - 2 -
5、Product parameters
Relative humidity
Resolution: 16Bit
Repeatability: ±1% RH
Accuracy: At 25 ±5% RH
Interchangeability: fully interchangeable
Response time: 1 / e (63%) of 25 6s
1m / s air 6s
Hysteresis: <± 0.3% RH
Long-term stability: <± 0.5% RH / yr in
Temperature
Resolution: 16Bit
Repeatability: ±0.2
Range: At 25 ±2
Response time: 1 / e (63%) 10S
Electrical Characteristics
Power supply: DC 3.5~5.5V
Supply Current: measurement 0.3mA standby 60μ A
Sampling period: more than 2 seconds
Pin Description
1, the VDD power supply 3.5~5.5V DC
2 DATA serial data, a single bus
3, NC, empty pin
4, GND ground, the negative power

Aosong(Guangzhou) Electronics Co.,Ltd. TEL:020-36042809 / 36380552 www.aosong.com - 3 -
6、Typical circuit
Microprocessor and DHT11 of connection typical application circuit as shown above, DATA pull the
microprocessor I / O ports are connected.
1. Typical application circuit recommended in the short cable length of 20 meters on the 5.1K
pull-up resistor, the resistance of greater than 20 meters under the pull-up resistor on the lower of the
actual situation.
2. When using a 3.5V voltage supply cable length shall not be greater than 20cm. Otherwise, the line
voltage drop will cause the sensor power supply shortage, caused by measurement error.
3. Each read out the temperature and humidity values are the results of the last measurement For
real-time data, sequential read twice, but is not recommended to repeatedly read the sensors, each
read sensor interval is greater than 5 seconds can be obtainedaccurate data.
7、Serial communication instructions (single-wire bi-directional)
Single bus Description
DHT11 uses a simplified single-bus communication. Single bus that only one data line, the system
of data exchange, control by a single bus to complete. Device (master or slave) through an open-drain
or tri-state port connected to the data line to allow the device does not send data to release the bus,
while other devices use the bus; single bus usually require an external one about 5.1kΩ pull-up resistor,
so that when the bus is idle, its status is high. Because they are the master-slave structure, and only
when the host calls the slave, the slave can answer, the host access devices must strictly follow the
single-bus sequence, if the chaotic sequence, the device will not respond to the host.
Single bus to transfer data defined
DATA For communication and synchronization between the microprocessor and DHT11, single-bus
data format, a transmission of 40 data, the high first-out.

Aosong(Guangzhou) Electronics Co.,Ltd. TEL:020-36042809 / 36380552 www.aosong.com - 4 -
Data format:
The 8bit humidity integer data + 8bit the Humidity decimal data +8 bit temperature integer data +
8bit fractional temperature data +8 bit parity bit.
Parity bit data definition
“8bit humidity integer data + 8bit humidity decimal data +8 bit temperature integer data + 8bit
temperature fractional data” 8bit checksum is equal to the results of the last eight.
Example 1: 40 data is received:
0011 0101 0000 0000 0001 1000 0000 0000 0100 1101
High humidity 8 Low humidity 8 High temp. 8 Low temp. 8 Parity bit
Calculate:
0011 0101+0000 0000+0001 1000+0000 0000= 0100 1101
Received data is correct:
Humidity:0011 0101=35H=53%RH
Temperature:0001 1000=18H=24
Example 2: 40 data is received:
0011 0101 0000 0000 0001 1000 0000 0000 0100 1001
High humidity 8 Low humidity 8 High temp. 8 Low temp. 8 Parity bit
Calculate:
0011 0101+0000 0000+0001 1000+0000 0000= 0100 1101
01001101≠0100 1001
The received data is not correct, give up, to re-receive data.
Data Timing Diagram
User host (MCU) to send a signal, DHT11 converted from low-power mode to high-speed mode,
until the host began to signal the end of the DHT11 send a response signal to send 40bit data, and
trigger a letter collection. The signal is sent as shown.
Data Timing Diagram
Note: The host reads the temperature and humidity data from DHT11 always the last measured
value, such as twice the measured interval of time is very long, continuous read twice to the second
value of real-time temperature and humidity values.

Aosong(Guangzhou) Electronics Co.,Ltd. TEL:020-36042809 / 36380552 www.aosong.com - 5 -
Peripherals read steps
Communication between the master and slave can be done through the following steps (peripherals
(such as microprocessors) read DHT11 the data of steps).
Step 1:
After power on DHT11 (DHT11 on after power to wait 1S across the unstable state during this period
can not send any instruction), the test environment temperature and humidity data, and record the data,
while DHT11 the DATA data lines pulled by pull-up resistor has been to maintainhigh; the DHT11 the
DATA pin is in input state, the moment of detection of external signals.
Step 2:
Microprocessor I / O set to output at the same time output low, and low hold time can not be less
than 18ms, then the microprocessor I / O is set to input state, due to the pull-up resistor, a
microprocessor/ O DHT11 the dATA data lines also will be high, waiting DHT11 to answer signal, send
the signal as shown:
Host sends a start signal
Step 3:
DATA pin is detected to an external signal of DHT11 low, waiting for external signal low end the
delay DHT11 DATA pin in the output state, the output low of 80 microseconds as the response signal,
followed by the output of 80 micro-seconds of high notification peripheral is ready to receive data, the
microprocessor I / O at this time in the input state is detected the I / O low (DHT11 response signal), wait
80 microseconds highdata receiving and sending signals as shown:
Step 4:
Output by DHT11 the DATA pin 40, the microprocessor receives 40 data bits of data "0" format: the
low level of 50 microseconds and 26-28 microseconds according to the changes in the I / O levellevel,
bit data "1" format: the high level of low plus, 50 microseconds to 70 microseconds. Bit data "0", "1" signal
format as shown:
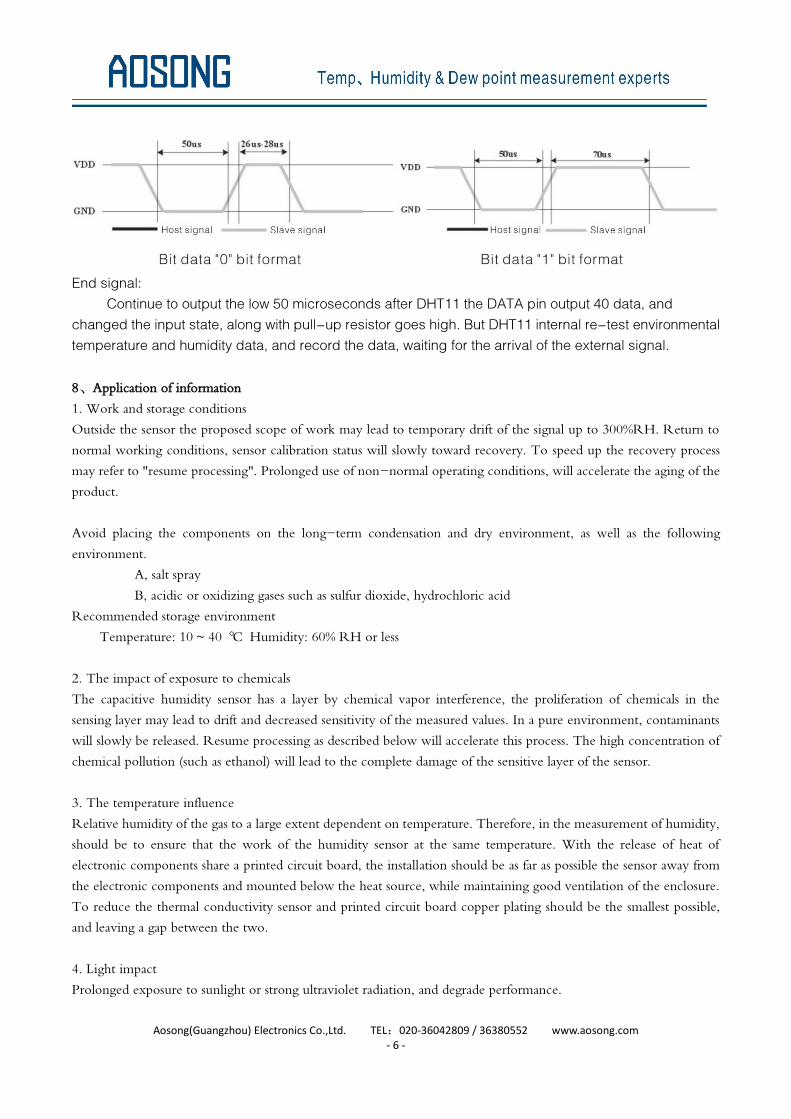
Aosong(Guangzhou) Electronics Co.,Ltd. TEL:020-36042809 / 36380552 www.aosong.com - 6 -
End signal:
Continue to output the low 50 microseconds after DHT11 the DATA pin output 40 data, and
changed the input state, along with pull-up resistor goes high. But DHT11 internal re-test environmental
temperature and humidity data, and record the data, waiting for the arrival of the external signal.
8、Application of information
1. Work and storage conditions
Outside the sensor the proposed scope of work may lead to temporary drift of the signal up to 300%RH. Return to
normal working conditions, sensor calibration status will slowly toward recovery. To speed up the recovery process
may refer to "resume processing". Prolonged use of non-normal operating conditions, will accelerate the aging of the
product.
Avoid placing the components on the long-term condensation and dry environment, as well as the following
environment.
A, salt spray
B, acidic or oxidizing gases such as sulfur dioxide, hydrochloric acid
Recommended storage environment
Temperature: 10 ~ 40 Humidity: 60% RH or less
2. The impact of exposure to chemicals
The capacitive humidity sensor has a layer by chemical vapor interference, the proliferation of chemicals in the
sensing layer may lead to drift and decreased sensitivity of the measured values. In a pure environment, contaminants
will slowly be released. Resume processing as described below will accelerate this process. The high concentration of
chemical pollution (such as ethanol) will lead to the complete damage of the sensitive layer of the sensor.
3. The temperature influence
Relative humidity of the gas to a large extent dependent on temperature. Therefore, in the measurement of humidity,
should be to ensure that the work of the humidity sensor at the same temperature. With the release of heat of
electronic components share a printed circuit board, the installation should be as far as possible the sensor away from
the electronic components and mounted below the heat source, while maintaining good ventilation of the enclosure.
To reduce the thermal conductivity sensor and printed circuit board copper plating should be the smallest possible,
and leaving a gap between the two.
4. Light impact
Prolonged exposure to sunlight or strong ultraviolet radiation, and degrade performance.

Aosong(Guangzhou) Electronics Co.,Ltd. TEL:020-36042809 / 36380552 www.aosong.com - 7 -
5. Resume processing
Placed under extreme working conditions or chemical vapor sensor, which allows it to return to the status of
calibration by the following handler. Maintain two hours in the humidity conditions of 45 and <10% RH (dry);
followed by 20-30 and> 70% RH humidity conditions to maintain more than five hours.
6. Wiring precautions
The quality of the signal wire will affect the quality of the voltage output, it is recommended to use high quality
shielded cable.
7. Welding information
Manual welding, in the maximum temperature of 300 under the conditions of contact time shall be less than 3
seconds.
8. Product upgrades
Details, please the consultation Aosong electronics department.
9、The license agreement
Without the prior written permission of the copyright holder, shall not in any form or by any means, electronic
or mechanical (including photocopying), copy any part of this manual, nor shall its contents be communicated to a
third party. The contents are subject to change without notice.
The Company and third parties have ownership of the software, the user may use only signed a contract or
software license.
10、Warnings and personal injury
This product is not applied to the safety or emergency stop devices, as well as the failure of the product may
result in injury to any other application, unless a particular purpose or use authorized. Installation, handling, use or
maintenance of the product refer to product data sheets and application notes. Failure to comply with this
recommendation may result in death and serious personal injury. The Company will bear all damages resulting
personal injury or death, and waive any claims that the resulting subsidiary company managers and employees and
agents, distributors, etc. that may arise, including: a variety of costs, compensation costs, attorneys' fees, and so on.
11、Quality Assurance
The company and its direct purchaser of the product quality guarantee period of three months (from the date of
delivery). Publishes the technical specifications of the product data sheet shall prevail. Within the warranty period, the
product was confirmed that the quality is really defective, the company will provide free repair or replacement. The
user must satisfy the following conditions:
① The product is found defective within 14 days written notice to the Company;
② The product shall be paid by mail back to the company;
③ The product should be within the warranty period.
The Company is only responsible for those used in the occasion of the technical condition of the product
defective product. Without any guarantee, warranty or written statement of its products used in special applications.
Company for its products applied to the reliability of the product or circuit does not make any commitment.

APENDICE C. HOJA DE ESPECIFICACIONES (DATASHEET) DE LOS SENSORESESTUDIADOS
C.6. Datasheet del sensor de Campo Magnetico
KEYES KY-035 (SS49E)
146

SS49E Linear Hall Effect Sensor
1 V3.10 Nov 1, 2013
Features Miniature construction Low-Noise Output 4.5 V to 6 V Operation Magnetically Optimized Package Linear output for circuit design
flexibility Temperature range of -40 °C to
150 °C
3 pin SOT23 (suffix SO) 3 pin SIP (suffix UA)
Description SS49E Linear Hall-effect sensor is small, versa-tile linear Hall-effect device that is operated by the magnetic field from a permanent magnet or an electromagnet. The linear sourcing output voltage is set by the supply voltage and varies in proportion to the strength of the magnetic field. The integrated circuitry features low noise out-
put, which makes it unnecessary to use external filtering. It also includes thin film resistors to provide increased temperature stability and ac-curacy. The linear Hall sensor has an operating temperature range of -40 °C to 150 °C appropri-ate for commercial, consumer and industrial environments.
Typical Applications Motor control Magnetic code reading Ferrous metal detector Current sensing Position sensing
Functional Block Diagram
1 Vcc
1
2
3
2 GND
3 Vout
REG
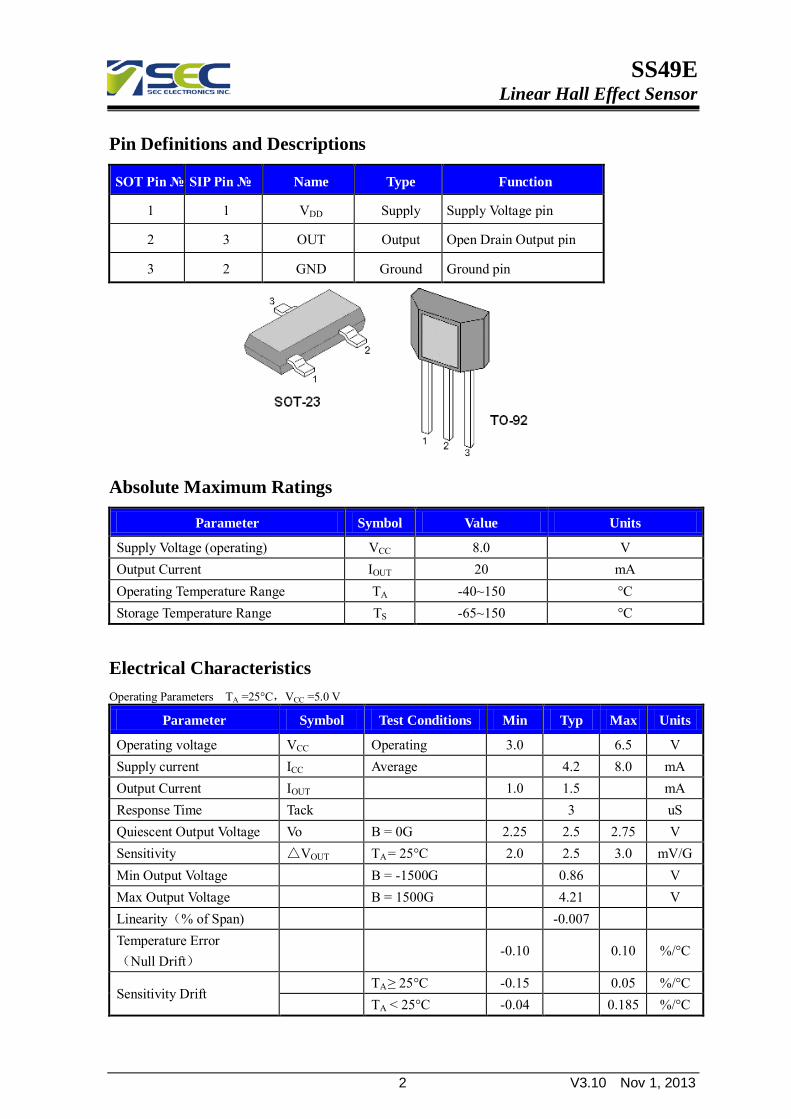
SS49E Linear Hall Effect Sensor
2 V3.10 Nov 1, 2013
Pin Definitions and Descriptions
SOT Pin SIP Pin Name Type Function
1 1 VDD Supply Supply Voltage pin
2 3 OUT Output Open Drain Output pin
3 2 GND Ground Ground pin
Absolute Maximum Ratings
Parameter Symbol Value Units
Supply Voltage (operating) VCC 8.0 V Output Current IOUT 20 mA Operating Temperature Range TA -40~150 °C Storage Temperature Range TS -65~150 °C
Electrical Characteristics Operating Parameters TA =25°C,VCC =5.0 V
Parameter Symbol Test Conditions Min Typ Max Units
Operating voltage VCC Operating 3.0 6.5 V Supply current ICC Average 4.2 8.0 mA Output Current IOUT 1.0 1.5 mA Response Time Tack 3 uS Quiescent Output Voltage Vo B = 0G 2.25 2.5 2.75 V Sensitivity VOUT TA = 25°C 2.0 2.5 3.0 mV/G Min Output Voltage B = -1500G 0.86 V Max Output Voltage B = 1500G 4.21 V Linearity(% of Span) -0.007 Temperature Error (Null Drift)
-0.10 0.10 %/°C
Sensitivity Drift TA ≥ 25°C -0.15 0.05 %/°C TA < 25°C -0.04 0.185 %/°C

SS49E Linear Hall Effect Sensor
3 V3.10 Nov 1, 2013
Performance Characteristics

SS49E Linear Hall Effect Sensor
4 V3.10 Nov 1, 2013
Package Information Package UA, 3-Pin SIP:
4.0 ± 0.01
1
2
3
1.27
2.13 1.87
1.00 1.20
45° ± 1°
1.52
± 0
.1
3° ± 1°
0.75
± 0
.05
3.0 ±
0.01
0.44± 0.01
0.05 ± 0.05
1.6.±
0.1
0.84(Nom)
3° ± 1°
6° ± 1°
6° ± 1°
3° ± 1°
14 .5
± 1
Active Area Depth:
Sensor Location
1
2
3
Notes: 1). Controlling dimension : mm ; 2). Leads must be free of flash and plating voids ; 3). Do not bend leads within 1 mm of lead to package
interface ; 4). PINOUT: Pin 1 VDD Pin 2 GND Pin 3 Output
0.39± 0.01
0.38 ± 0.01
2.54