análisis de incentivos para reducir la deforestación en ... · análisis de incentivos para...
TRANSCRIPT

Análisis de Incentivos paraReducir la Deforestación en
Indonesia: Aplicación del Modelo OSIRIS
Ruben Lubowski, Environmental Defense Fund (EDF)
Based on work by: Jonah Busch, Ruben Lubowski, Fabiano Godoy, Farhan Helmy, Muhammad Farid, Doddy Sukadri, Kemen Austin,
Jenny Hewson, Daniel Juhn, Marc Steininger, Fred Boltz
Seminario sobre “Midiendo la Deforestación Evitada: Un enfoque de Políticas Publicas”
SEMARNAT, INE, CONAFOR, Tinker FoundationCiudad de México, 9 de Marzo 2011
http:www/conservation.org/osiris

The OSIRIS-Indonesia spreadsheet and map tool has been developed by Conservation International, the Environmental Defense Fund, and World Resources Institute, in collaboration with Indonesia DNPI and Ministry of Forestry, to estimate and map the impacts of alternative REDD policies and incentives on:
-deforestation (ha/yr)-emission reductions (tCO2e/yr)-national and district revenue ($/yr)
-Free-Transparent-Open-source-Based on peer-
reviewed scientific data and methods
-Publicly available:
http://www.conservation.org/osiris
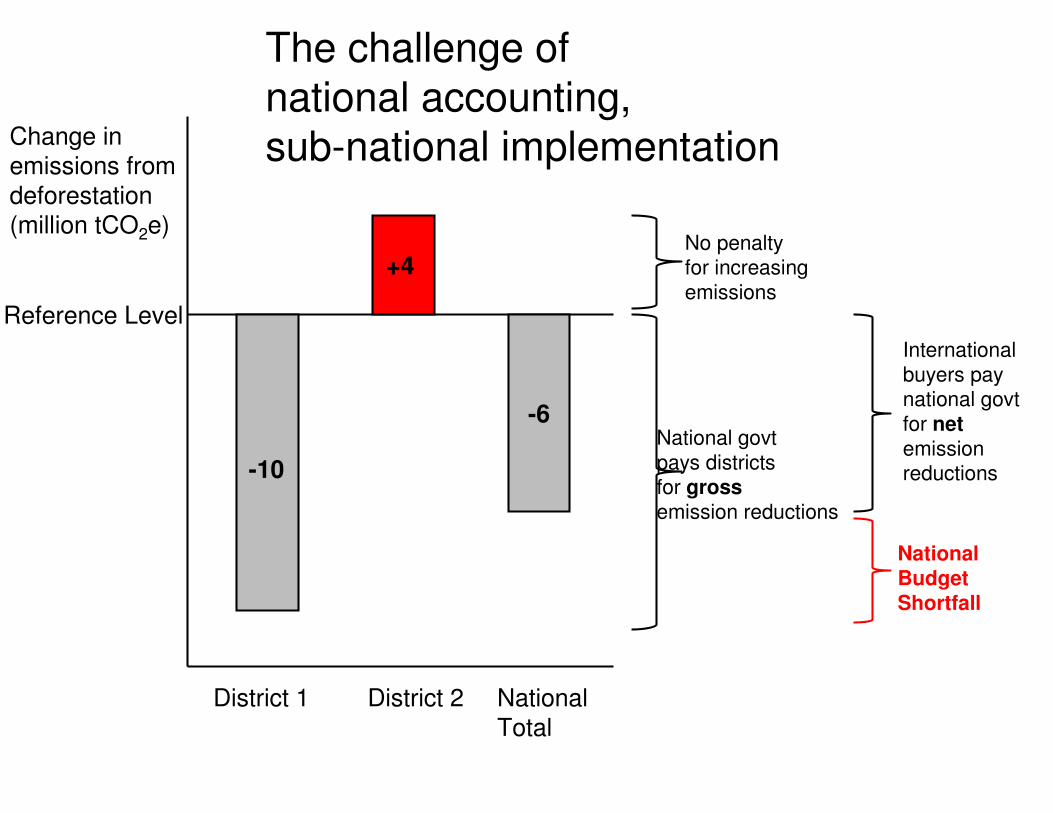
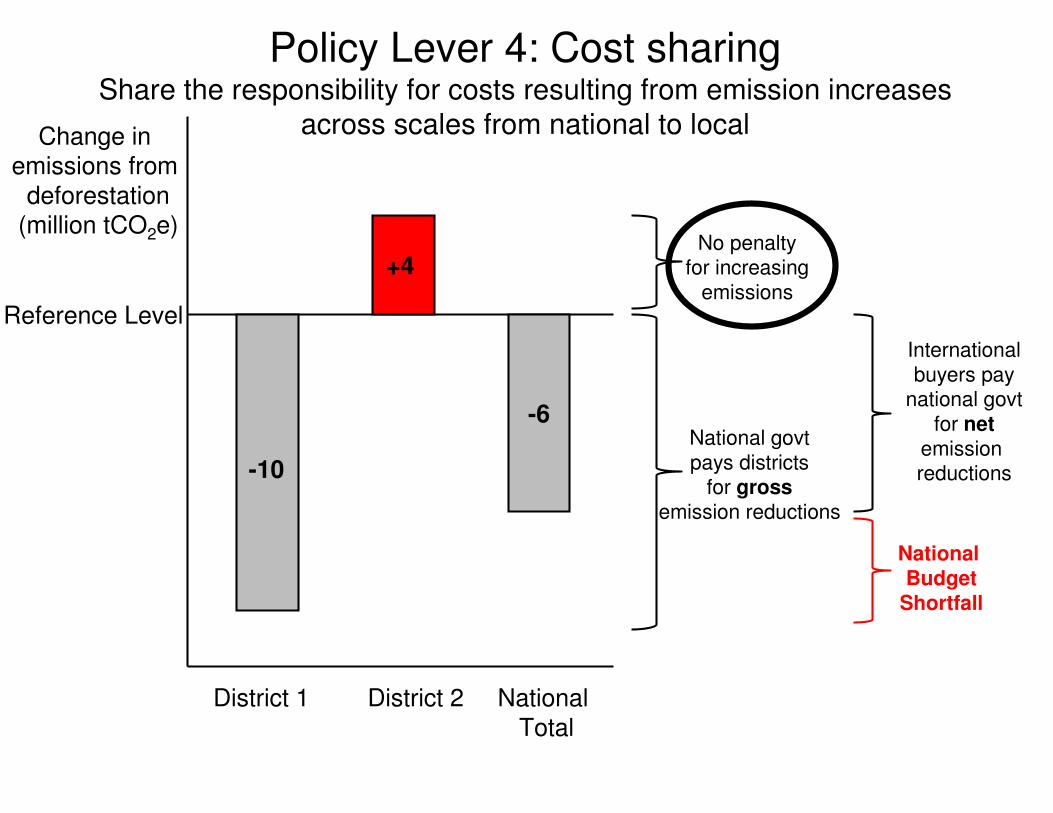
Change in emissions from deforestation(million tCO2e)
District 1 District 2 National Total
-10
-6
+4
National BudgetShortfall
Internationalbuyers paynational govtfor netemission reductions
National govtpays districtsfor grossemission reductions
Reference Level
The challenge of national accounting,sub-national implementation
No penaltyfor increasingemissions
Change in emissions from
deforestation(million tCO2e)
District 1 District 2 National Total
-10
-6
+4
National Budget
Shortfall
Internationalbuyers pay
national govtfor net
emission reductions
National govtpays districts
for grossemission reductions
Reference Level
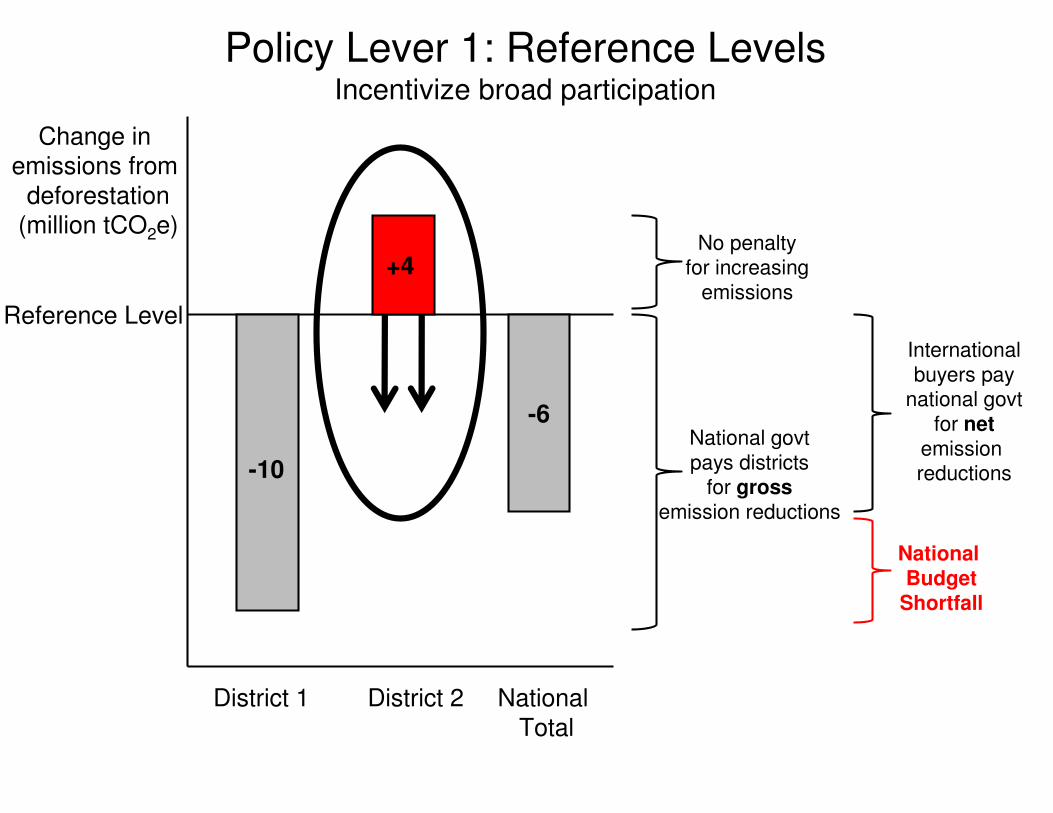
Policy Lever 1: Reference LevelsIncentivize broad participation
No penaltyfor increasing
emissions
Change in emissions from
deforestation(million tCO2e)
District 1 District 2 National Total
-10
-6
+4
National Budget
Shortfall
Internationalbuyers pay
national govtfor net
emission reductions
National govtpays districts
for grossemission reductions
Reference Level
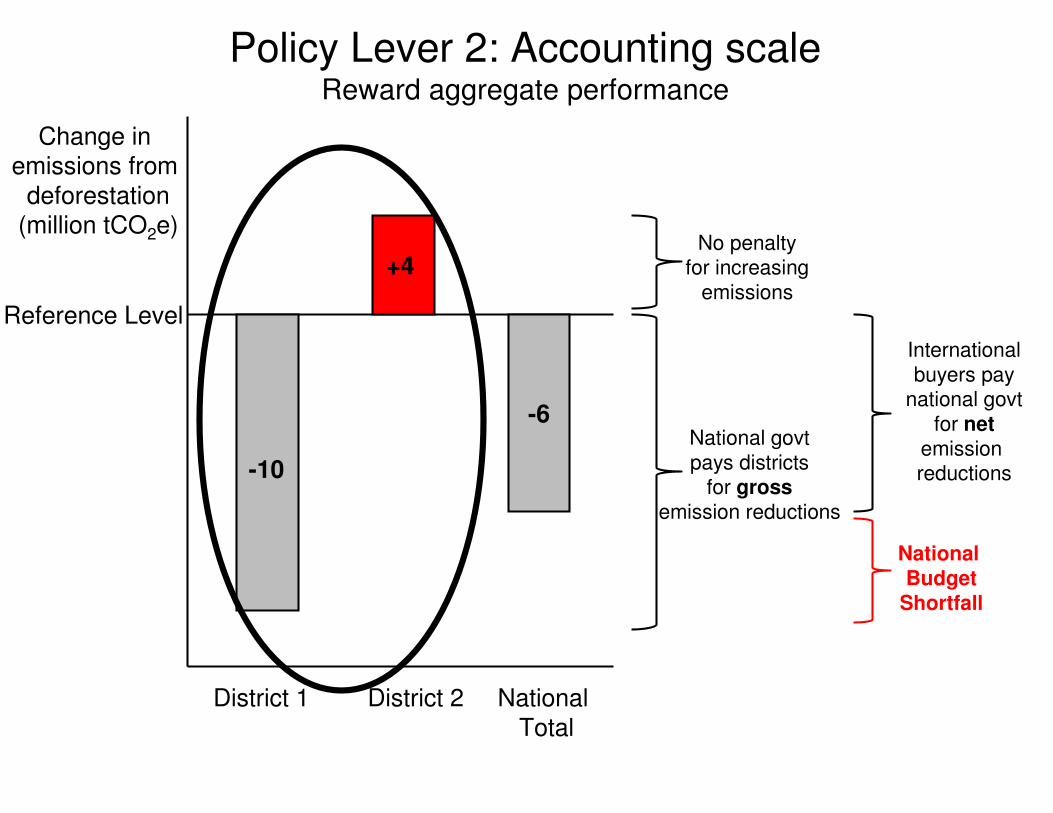
Policy Lever 2: Accounting scaleReward aggregate performance
No penaltyfor increasing
emissions
Change in emissions from
deforestation(million tCO2e)
District 1 District 2 National Total
-10
-6
+4
National Budget
Shortfall
Internationalbuyers pay
national govtfor net
emission reductions
National govtpays districts
for grossemission reductions
Reference Level
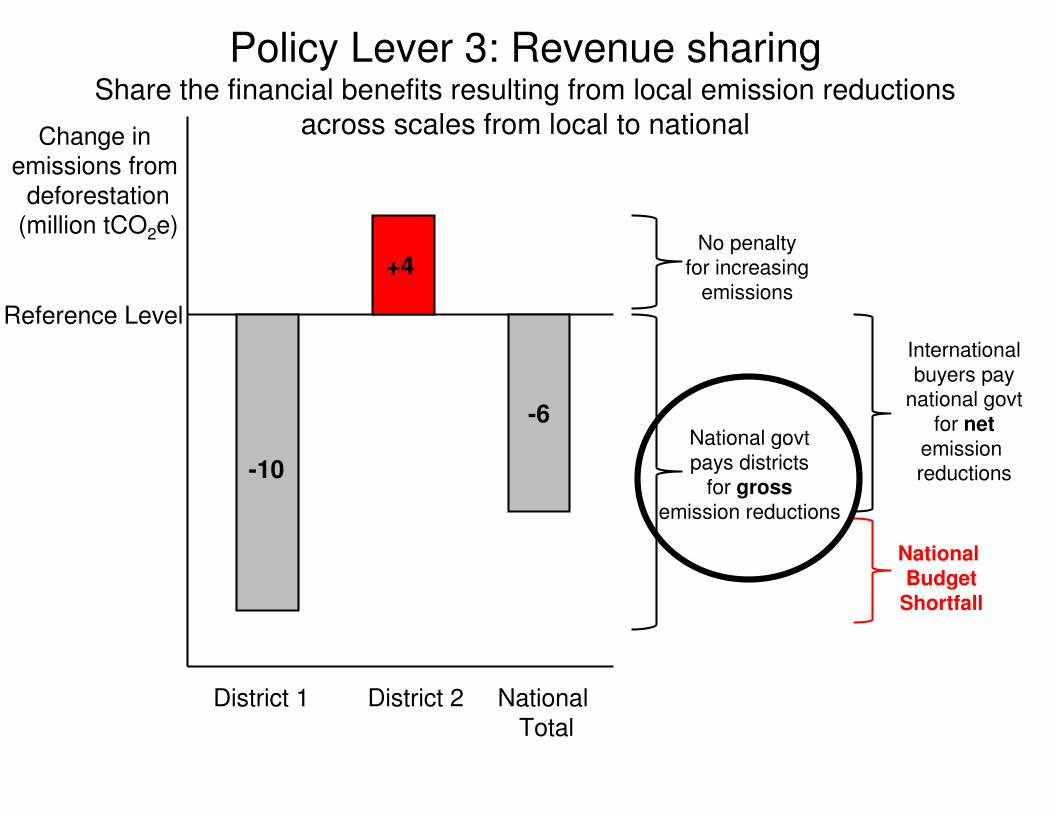
Policy Lever 3: Revenue sharingShare the financial benefits resulting from local emission reductions
across scales from local to national
No penaltyfor increasing
emissions
Change in emissions from
deforestation(million tCO2e)
District 1 District 2 National Total
-10
-6
+4
National Budget
Shortfall
Internationalbuyers pay
national govtfor net
emission reductions
National govtpays districts
for grossemission reductions
Reference Level
Policy Lever 4: Cost sharingShare the responsibility for costs resulting from emission increases
across scales from national to local
No penaltyfor increasing
emissions
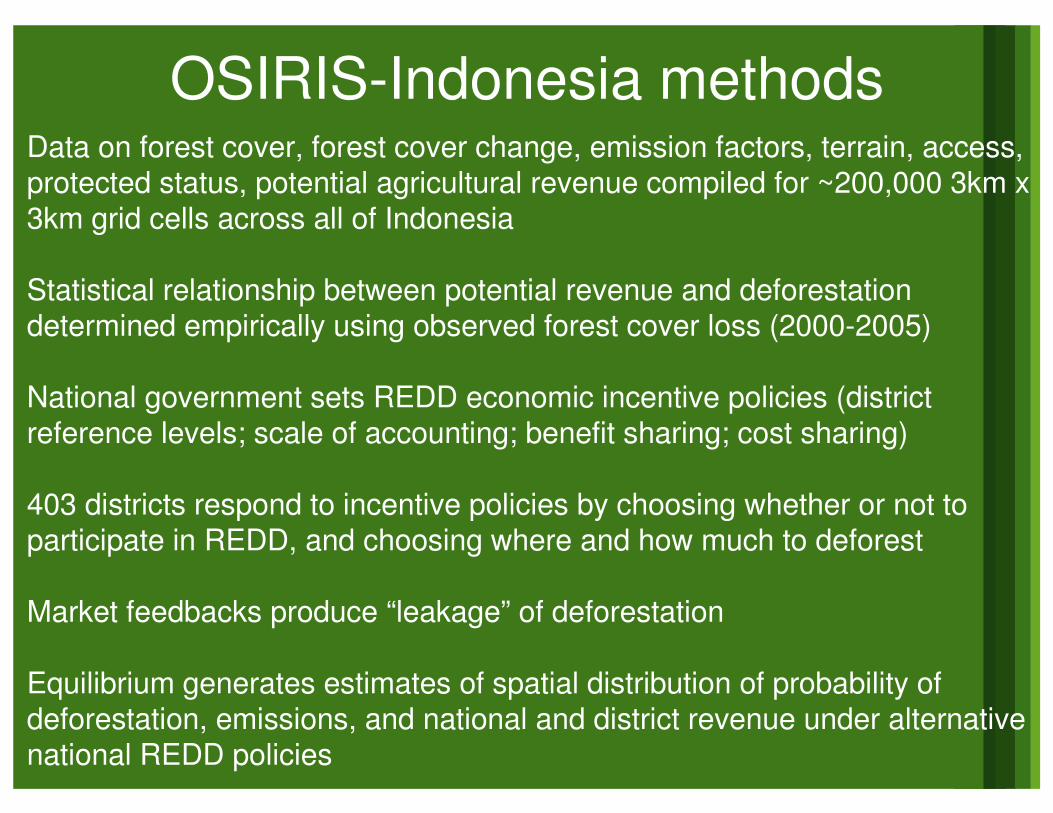
OSIRIS-Indonesia methods• Data on forest cover, forest cover change, emission factors, terrain, access,
protected status, potential agricultural revenue compiled for ~200,000 3km x 3km grid cells across all of Indonesia
• Statistical relationship between potential revenue and deforestation determined empirically using observed forest cover loss (2000-2005)
• National government sets REDD economic incentive policies (district reference levels; scale of accounting; benefit sharing; cost sharing)
• 403 districts respond to incentive policies by choosing whether or not to participate in REDD, and choosing where and how much to deforest
• Market feedbacks produce “leakage” of deforestation
• Equilibrium generates estimates of spatial distribution of probability of deforestation, emissions, and national and district revenue under alternative national REDD policies
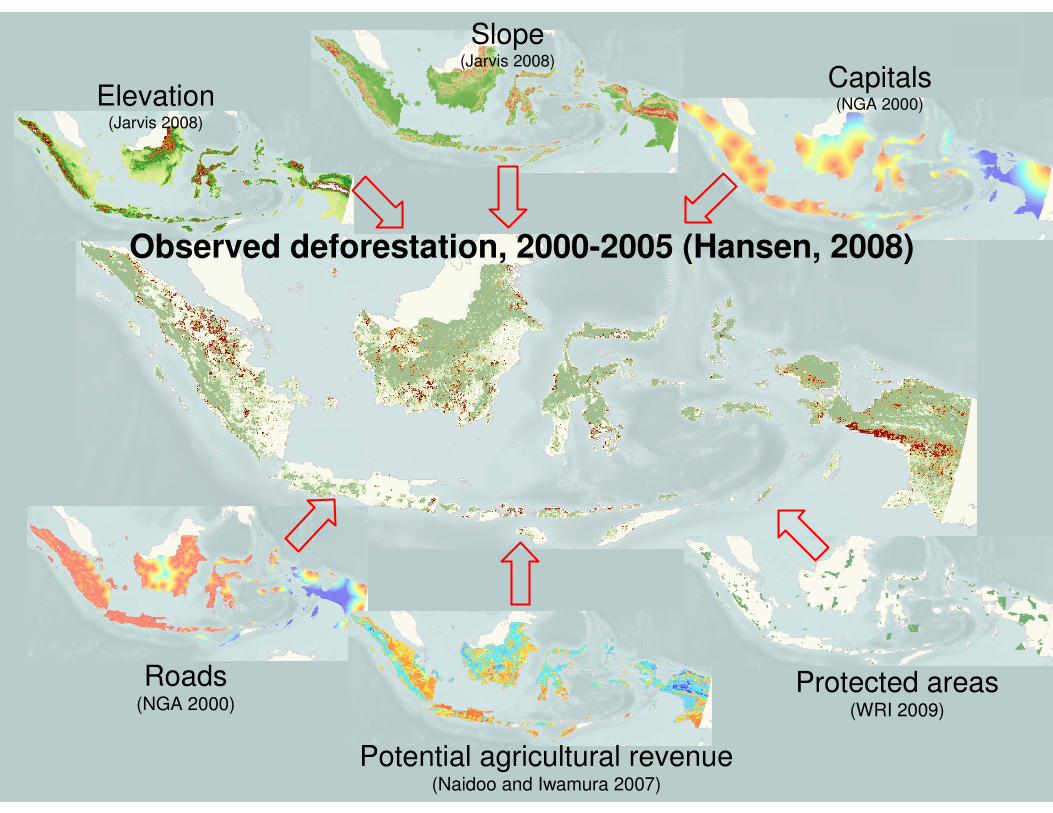
Observed deforestation, 2000-2005 (Hansen, 2008)
Elevation(Jarvis 2008)
Slope(Jarvis 2008)
Capitals(NGA 2000)
Roads(NGA 2000)
Protected areas(WRI 2009)
Potential agricultural revenue(Naidoo and Iwamura 2007)
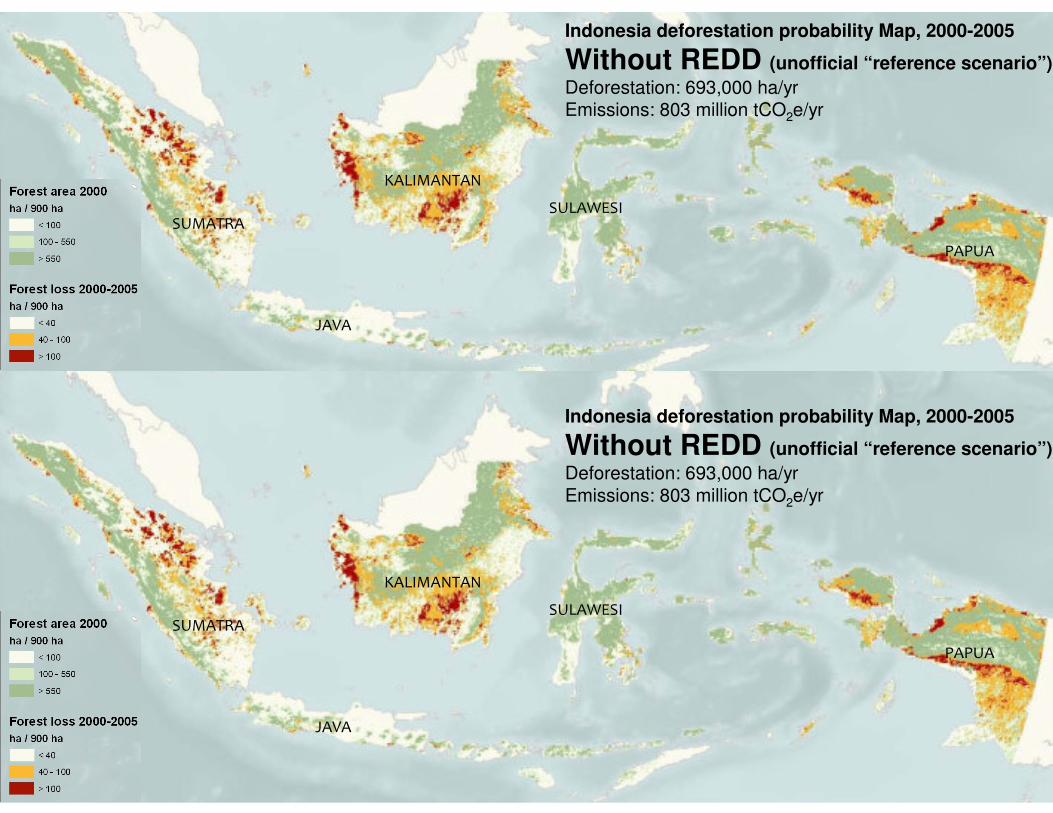
Indonesia deforestation probability Map, 2000-2005
Without REDD (unofficial “reference scenario”)Deforestation: 693,000 ha/yrEmissions: 803 million tCO2e/yr
Indonesia deforestation probability Map, 2000-2005
Without REDD (unofficial “reference scenario”)Deforestation: 693,000 ha/yrEmissions: 803 million tCO2e/yr
����������
���
� �����
� �� ��
���� �
����������
���
� �����
� �� ��
���� �
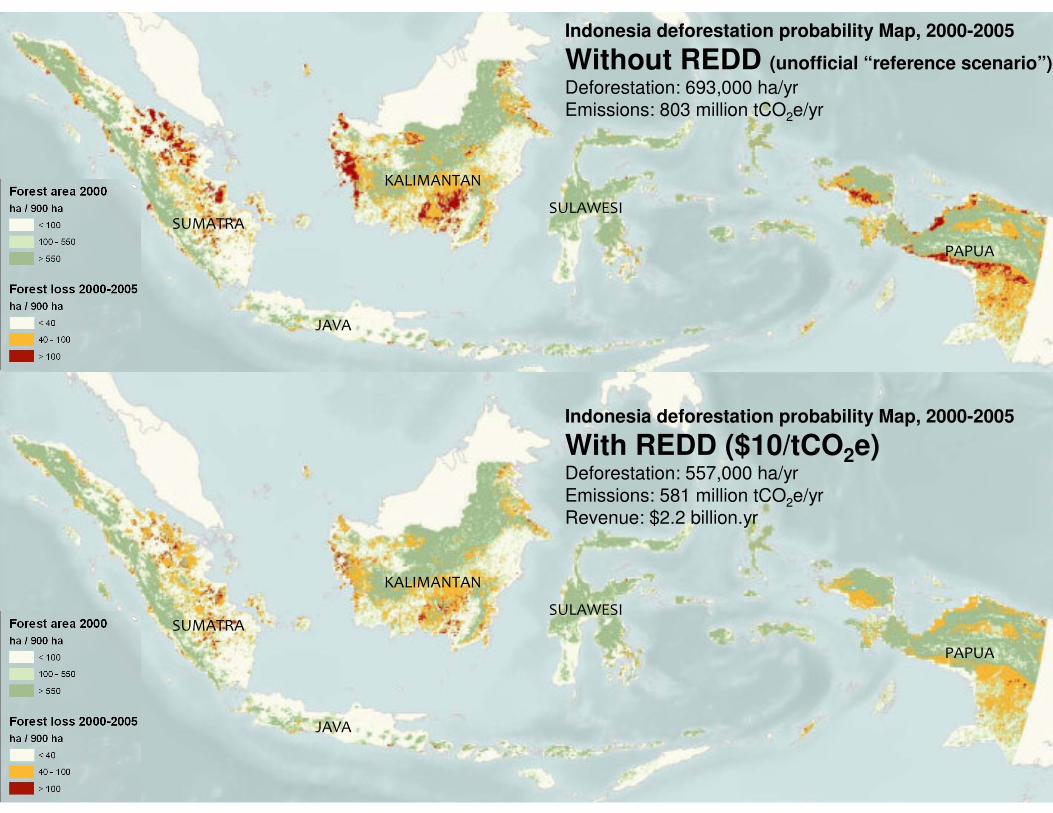
Indonesia deforestation probability Map, 2000-2005
With REDD ($10/tCO2e)Deforestation: 557,000 ha/yrEmissions: 581 million tCO2e/yr Revenue: $2.2 billion.yr
����������
���
� �����
� �� ��
���� �
����������
���
� �����
� �� ��
���� �
Indonesia deforestation probability Map, 2000-2005
Without REDD (unofficial “reference scenario”)Deforestation: 693,000 ha/yrEmissions: 803 million tCO2e/yr
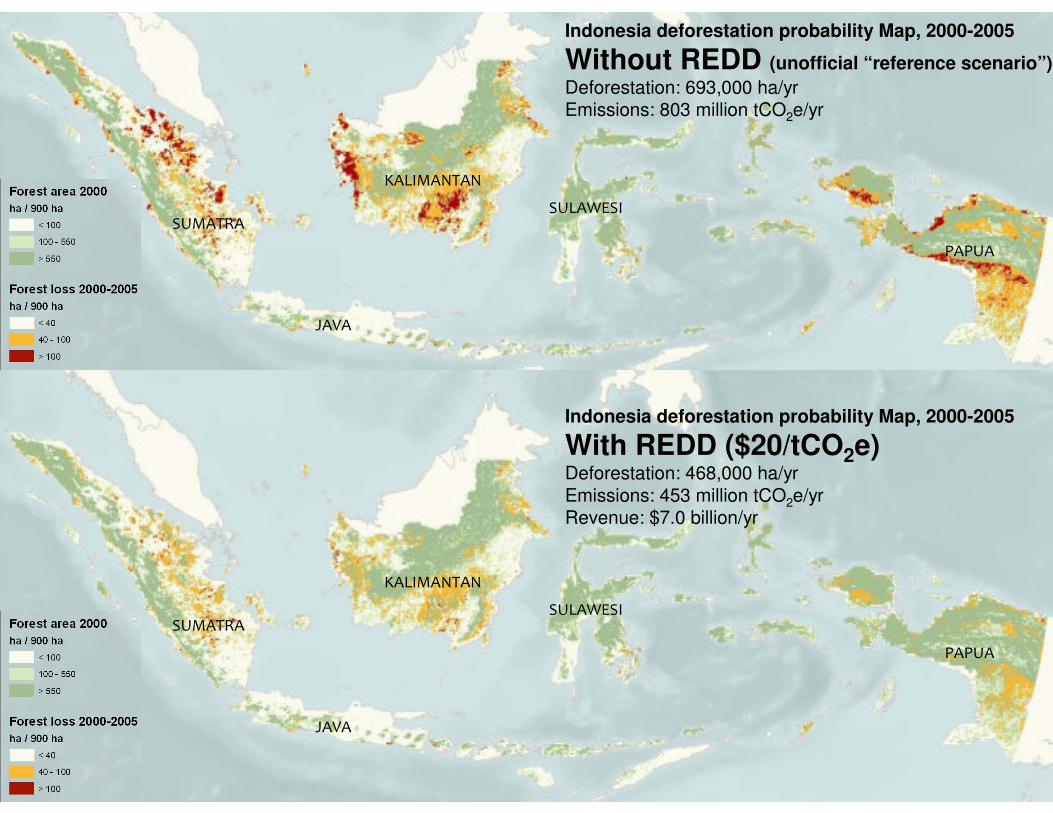
Indonesia deforestation probability Map, 2000-2005
With REDD ($20/tCO2e)Deforestation: 468,000 ha/yrEmissions: 453 million tCO2e/yr Revenue: $7.0 billion/yr
����������
���
� �����
� �� ��
���� �
����������
���
� �����
� �� ��
���� �
Indonesia deforestation probability Map, 2000-2005
Without REDD (unofficial “reference scenario”)Deforestation: 693,000 ha/yrEmissions: 803 million tCO2e/yr
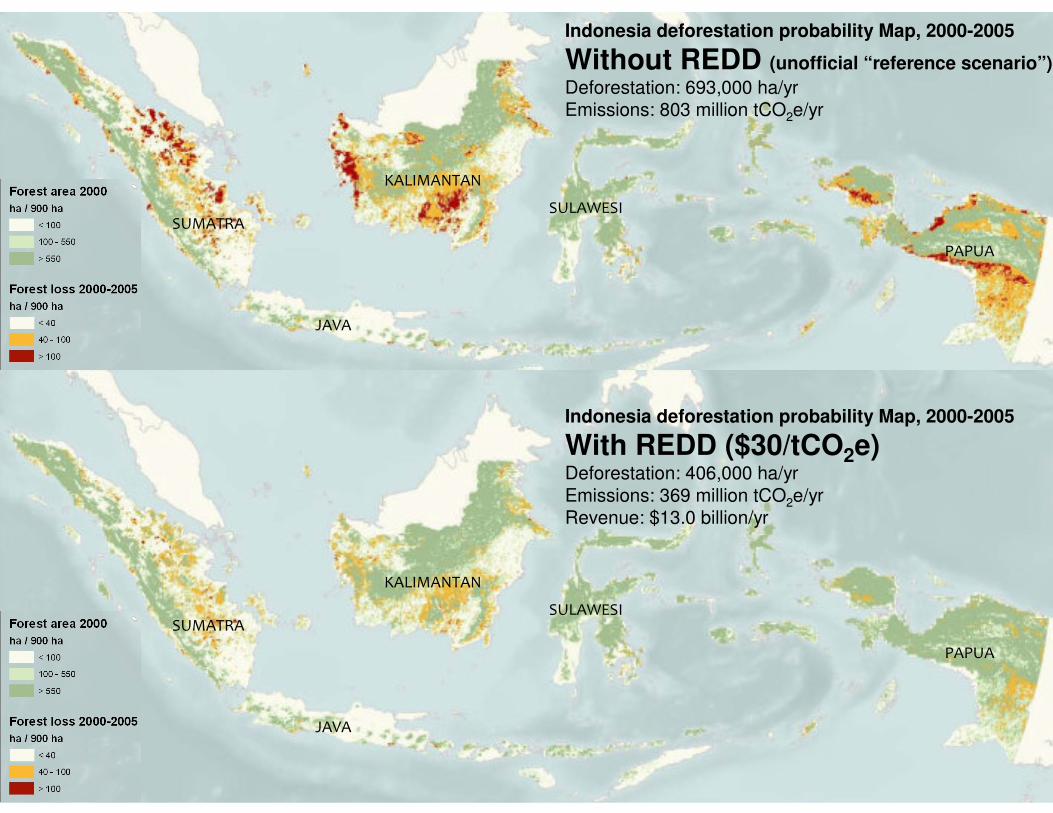
Indonesia deforestation probability Map, 2000-2005
With REDD ($30/tCO2e)Deforestation: 406,000 ha/yrEmissions: 369 million tCO2e/yr Revenue: $13.0 billion/yr
����������
���
� �����
� �� ��
���� �
����������
���
� �����
� �� ��
���� �
Indonesia deforestation probability Map, 2000-2005
Without REDD (unofficial “reference scenario”)Deforestation: 693,000 ha/yrEmissions: 803 million tCO2e/yr
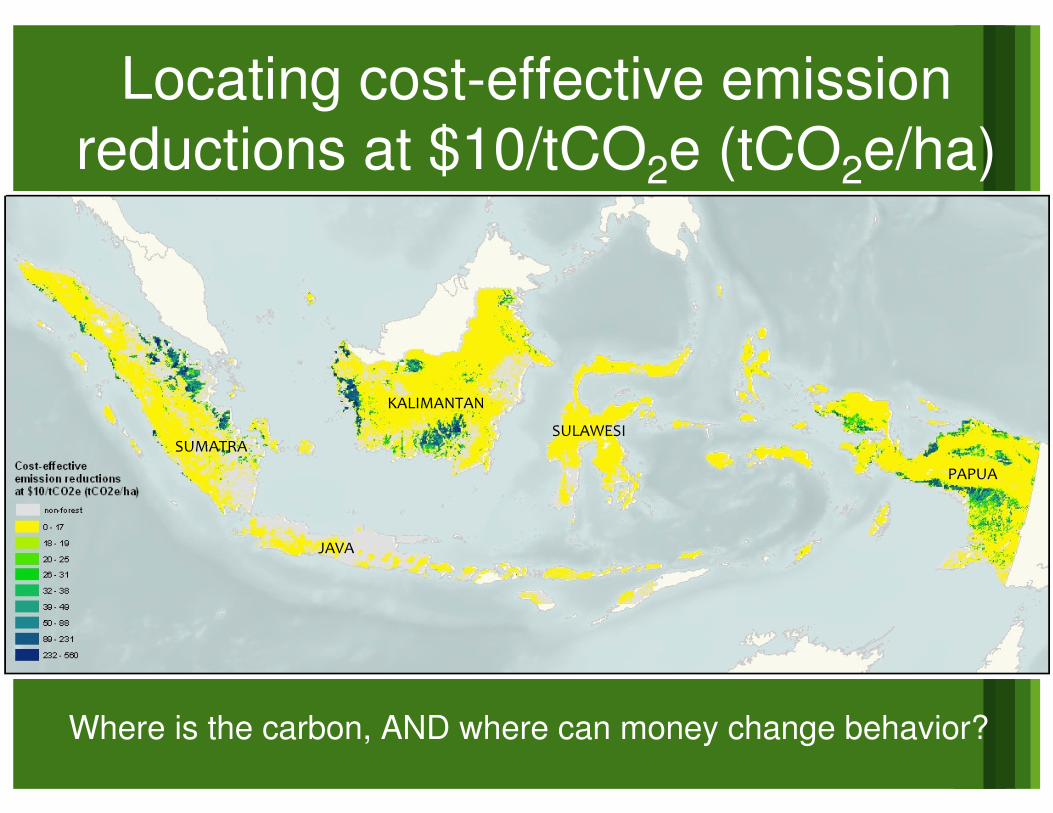
Locating cost-effective emission reductions at $10/tCO2e (tCO2e/ha)
����������
���
� �����
� �� ��
���� �
Where is the carbon, AND where can money change behavior?
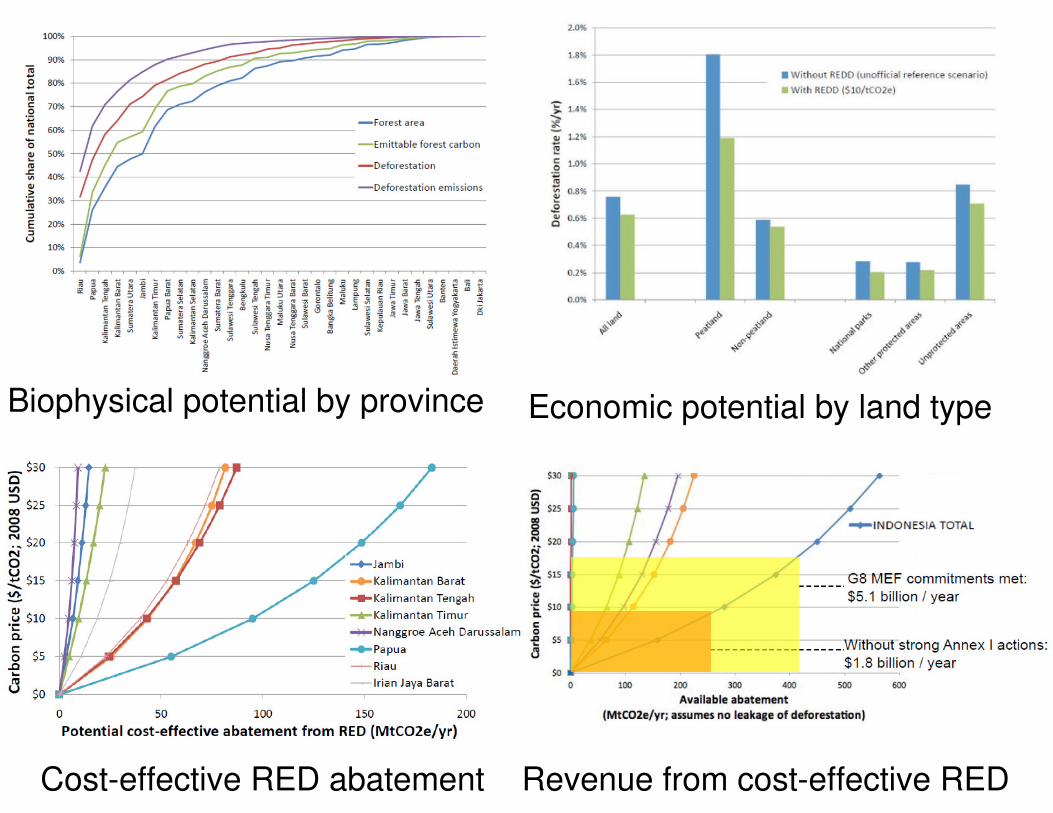
Biophysical potential by province Economic potential by land type
Cost-effective RED abatement Revenue from cost-effective RED
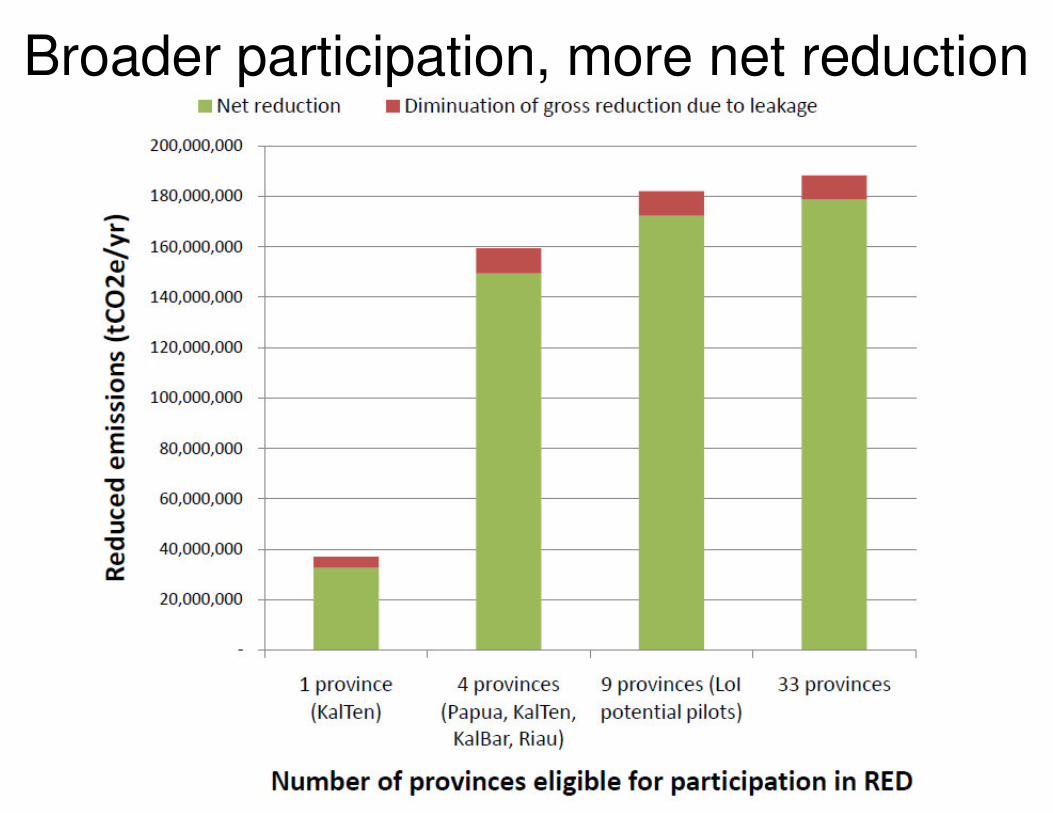
Broader participation, more net reduction
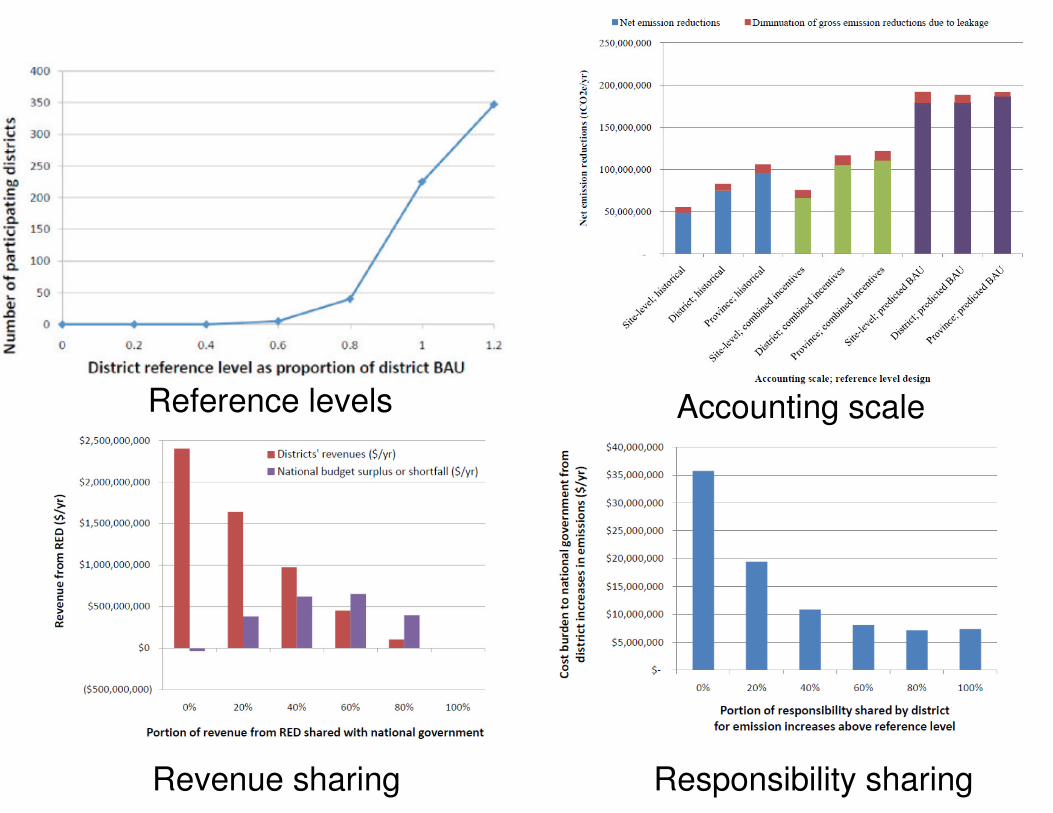
Reference levels Accounting scale
Revenue sharing Responsibility sharing
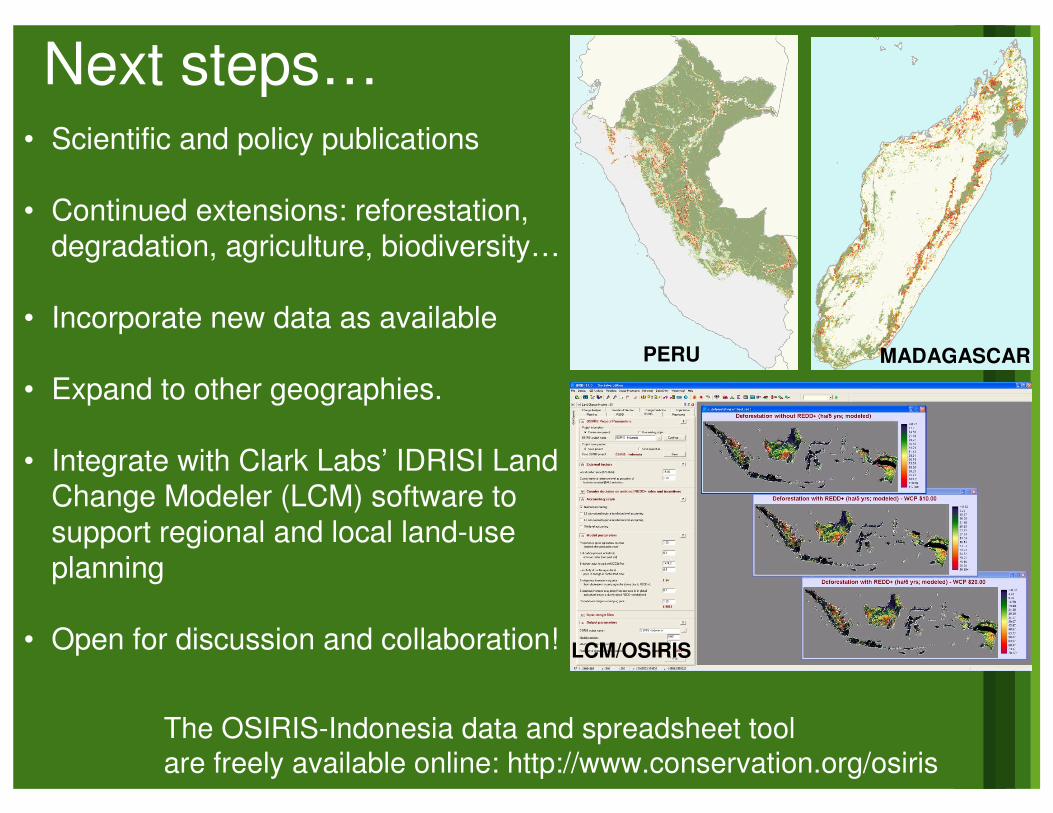
Next steps…• Scientific and policy publications
• Continued extensions: reforestation, degradation, agriculture, biodiversity…
• Incorporate new data as available
• Expand to other geographies.
• Integrate with Clark Labs’ IDRISI Land Change Modeler (LCM) software to support regional and local land-use planning
• Open for discussion and collaboration!
PERU MADAGASCAR
LCM/OSIRIS
The OSIRIS-Indonesia data and spreadsheet tool are freely available online: http://www.conservation.org/osiris
¡Muchas gracias!
Thanks to:Indonesia National Council on Climate Change (DNPI)
Indonesia Ministry of ForestryNorwegian Agency for Development Cooperation
Comments and feedback welcome:http://www.conservation.org/osiris