ambiente y antecedentes de floraciÓn en el crecimiento ... · rrollo de la planta (amasino y...
TRANSCRIPT
35
AMBIENTE Y ANTECEDENTES DE FLORACIÓN EN EL CRECIMIENTO, INDUCCIÓN Y DESARROLLO FLORAL DE Laelia anceps
subesp. anceps (ORCHIDACEAE)
ENVIRONMENT AND FLOWERING BACKGROUND IN GROWTH, INDUCTION AND FLOWER DEVELOPMENT IN Laelia anceps subsp. anceps (ORCHIDACEAE)
M. Rosario Sánchez-Vidaña, Olga Tejeda-Sartorius*, A. María Hernández-Anguiano, L. Iris Trejo-Téllez, R. Marcos Soto-Hernández, E. Araceli Gaytán-Acuña
Campus Montecillo. Colegio de Postgraduados. 56230. Montecillo, Estado de México. ([email protected])
Resumen
El manejo de factores ambientales es importante para el control de la inducción floral en orquídeas. Por lo tanto, el objetivo de este estudio fue investigar el efecto de dos am-bientes controlados y condiciones de invernadero, así como la influencia del antecedente de floración de plantas de Lae-lia anceps Lindl. subesp. anceps, de cuatro años de edad, en el crecimiento, inducción e indicadores de desarrollo floral. Los ambientes fueron: 1) ambiente invernadero (AInv) con temperatura promedio de 29/13 °C diurna/nocturna, foto-periodo natural estimado de 12 h y FFF de 90 mmol.m-2.s-1; 2) ambiente controlado 1 (AC1) con luz de lámparas de adi-tivos metálicos + lámparas de alta presión de sodio + tubos fluorescentes, con flujo de fotones fotosintéticos (FFF) de 80 mmol m-2 s-1; 3) ambiente controlado 2 (AC2) con luz de diodos emisores de luz, con FFF de 64 mmol m-2 s-1. Ambos ambientes controlados con fotoperiodo 9/15 h y temperatura 25/13 °C diurna/nocturna. Antecedente de floración: plantas con floración anterior (CFA) y sin floración anterior (SFA). El diseño experimental fue completamente al azar con trata-mientos: AInv + CFA; AInv + SFA; AC1 + CFA; AC1 + SFA; AC2 + CFA; AC2 + SFA, con 20 repeticiones. La unidad expe-rimental fue una planta. Los análisis estadísticos fueron AN-DEVA y prueba de comparación de medias (Tukey, p£0.05), regresión logística y correlación Pearson. Los ambientes eva-luados no influyeron en el crecimiento vegetativo de plantas inducidas a floración, pero plantas no inducidas, principal-mente en AC2 + CFA, disminuyeron su crecimiento. Plantas CFA promovieron mayor probabilidad de inducción floral. El AInv generó el mayor porcentaje de inducción floral. Am-bos ambientes controlados redujeron la antesis por 45 y 30 d.
* Autor responsable v Author for correspondence.Recibido: agosto, 2016. Aprobado: enero, 2017.Publicado como ARTÍCULO en Agrociencia 52: 35-54. 2018.
AbstRAct
Environmental factors management is important in the control of flower induction in orchids. Therefore, the objective of this study was to investigate the effect of two controlled environments and greenhouse conditions, as well as the influence of the flowering background in Laelia anceps Lindl. subesp. anceps, on four years old plants during their growth, induction, and indicators of flower development. The evaluated environments were: 1) greenhouse environment (AInv), with an average day/night 29/13 °C temperature, natural photoperiod of 12 h with a photosynthetic photon flux (FFF) of 90 mmol.m-2 s-1, 2) controlled environment 1 (AC1) with metal-halide lamps + high-pressure sodium lamps + fluorescent tubes lights with a FFF of 80 µmol m-2 s-1, and 3) controlled environment 2 (AC2) with light emitting diodes with a FFF of 64 mmol m-2 s-1. Both controlled environments had a 9/15 h photoperiod and 25/13 °C day/night temperature. Flowering background: plants with previous flowering (CFA) and without previous flowering (SFA). The experimental design was completely random with treatments: AInv + CFA, AInv + SFA, AC1 + CFA, AC1 + SFA, AC2 + CFA and AC2 + SFA, with 20 repetitions. Each plant was an experimental unit. Statistical analyses were ANOVA and Tukey test (p£0.05) for means comparison, logistic regression, and Pearson correlation. The evaluated environments did not have any influence on the vegetative growth of flowering induced plants, but the non-induced plants, mainly those in AC2 + CFA, decreased their growth. The CFA plants promoted a higher probability of flowering induction. The AInv generated the highest percentage of flower induction. Both controlled environments reduced the anthesis 45 and 30 d. For blooming, flower size and labellum were correlated among themselves in the three environments, meanwhile, in greenhouse conditions, they relate to the number of flowers.
AGROCIENCIA, 1 de enero - 15 de febrero, 2018
VOLUMEN 52, NÚMERO 136
Para floración, el tamaño de flor y labelo se correlacionaron entre sí en los tres ambientes, mientras que en invernadero se relacionaron con número de flores. La longitud del tallo floral se correlacionó con días a antesis en ambientes contro-lados.
Palabras clave: Orchidaceae, Laelia anceps Lindl. subesp. anceps, fuentes de luz, ambiente controlado, fotoperiodo, intensidad lu-mínica.
IntRoduccIón
Diversas especies de orquídeas cultivadas para flores de corte y para plantas en maceta tienen importancia económica, por lo que
hay gran interés en el mejoramiento de los aspectos de valor comercial (da Silva, 2013), de los cuales la floración es el más importante. Sin embargo, para propósitos comerciales, la floración en orquídeas es un problema porque tienen periodos juveniles largos y las plantas deben alcanzar un cierto grado de ma-durez para florecer. Este periodo juvenil varía entre especies e híbridos (Lopez y Runkle, 2005). Como en otras angiospermas, el desarrollo de las flores de las orquídeas empieza con la transición floral, y continúa con el inicio y la formación de los órganos florales (Yu y Goh, 2000).
La información cuantitativa del proceso de flora-ción es escasa para la mayoría de las orquídeas (Lopez et al., 2003), lo cual complica su manejo; además, el porcentaje de plantas que florece en una población puede tener gran variación entre años en muchas es-pecies silvestres (Pfeifer et al., 2006). En diversas her-báceas perennes, entre ellas orquídeas (Kindlmann y Balounová, 1999; Kindlmann y Balounová, 2001), las variaciones entre años de latencia, de esterilidad y de floración, en individuos y en poblaciones, son llamadas rutas irregulares de floración (Pfeifer et al., 2006). En las orquídeas Liparis lilifolia (L.) Richard y Tipularia discolor (Pursh) Nutall, estas variaciones son el resultado de factores negativos asociados con la reproducción sexual y la herbivoría foliar (Whigham y O’Neill, 1991). Primack y Stacy (1998) en un es-tudio con tres poblaciones silvestres de Cypripedium acaule compararon plantas polinizadas manualmen-te y con producción frecuente de frutos, vs plantas sin polinizar y que raramente produjeron frutos; las plantas que florecieron sin producir fruto no afecta-ron su tamaño ni la probabilidad de florecer en años subsecuentes, pero las que sí fructificaron mostraron
The length of the flower stalk was correlated with the days to anthesis in controlled environments.
Key words: Orchidaceae, Laelia anceps Lindl. subesp. anceps, light sources, controlled environment, photoperiod, light intensity.
IntRoductIon
Various orchid species cultivated as cut and potted flowers have economic importance. For that reason, there is great interest in
improving aspects of their commercial value (da Silva, 2013), from which flowers are the most important. However, for commercial purposes, flowering is a problem, because orchids have long juvenile periods and plants must achieve a certain degree of maturity to blossom. This juvenile period varies between species and hybrids (Lopez and Runkle, 2005). As in other angiosperms, the development of flowers starts with the floral transition and continues with the beginning and the formation of the floral organs (Yu and Goh, 2000).
Quantitative information on the flowering process is scarce for the majority of orchid species (Lopez et al., 2003), which complicates its management; the percentage of flowering plants in a population may also have great variability between years in many wild species (Pfeifer et al., 2006). In several perennial herbaceous, including orchids (Kindlmann and Balounová, 1999; Kindlmann and Balounová, 2001), the variability between dormancy years, sterility, and flowering in individuals and populations are called irregular flowering patterns (Pfeifer et al., 2006). In Liparis lilifolia (L.) Richard and Tipularia discolor (Pursh) Nutall these variations result from negative factors associated with sexual reproduction and foliar herbivory (Whigham and O´Neill, 1991). Primack and Stacy (1998) compared plants of three wild populations of Cypripedium acaule manually pollinated with the frequent production of fruits vs. plants without pollinating, which rarely produced fruits. Plants that bloomed without producing fruit did not affect its size or the blooming probability in subsequent years. Nevertheless, the plants which gave fruits showed a reproduction cost by reducing both variables. Some of the causes for terrestrial orchids irregularities in the flowering are the costs of sexual reproduction, diseases and leaf damage by herbivores, in addition to environmental factors such
37SÁNCHEZ-VIDAÑA et al.
CRECIMIENTO, INDUCCIÓN Y DESARROLLO FLORAL DE Laelia anceps subesp. anceps (ORCHIDACEAE)
un costo de reproducción al reducir ambas variables. Para orquídeas terrestres algunas de las causas de la irregularidad en la floración son los costos de la re-producción sexual, las enfermedades de las hojas y el daño foliar por herviboría y, además, aspectos am-bientales como el clima (Kindlmann y Balounová, 2001; Pfeifer et al., 2006).
La floración inicia en respuesta a aspectos am-bientales y rutas endógenas, éstas últimas referidas como autónomas (controladas genéticamente) que funcionan independientemente de las señales am-bientales y están relacionadas con el estado de desa-rrollo de la planta (Amasino y Michaels, 2010). El control genético de la floración fue investigado por Weigel y Nilsson (1995), Kobayashi y Weigel (2007), Barret (2008) y Andrés y Coupland (2012). La iden-tificación de los genes DOMADS1, DOMADS2 y DOMADS3 es el primer paso hacia la elucidación de los mecanismos moleculares de la transición floral en orquídeas (Yu y Goh, 2000).
Entre los factores climáticos que influyen en la flo-ración destacan los considerados secundarios (menos predecibles que los primarios), como la temperatura ambiental, la luz integral (irradiancia de la longitud del día) y la disponibilidad de agua (Bernier y Péri-lleux, 2005). Para Oncidium la proporción de óxido-reducción (REDOX) de AsA (ascorbato) bajo estrés ambiental por temperatura, representa un cambio maestro para mediar la fase de transición vegetativa a estado reproductivo (Chin et al., 2014).
El crecimiento de las plantas y el proceso de de-sarrollo son regulados por la calidad de la luz (color, longitud de onda); la cantidad (tasa de flujo); y el fotoperiodo (duración de iluminación) (Folta y Chil-ders, 2008). Según Cerdán y Chory (2003), hay una ruta de calidad de luz que regula el periodo de flo-ración en plantas. Un fotoperiodo apropiado gene-ra un estímulo inductivo basado en un mecanismo de coincidencia externa, y la naturaleza de la señal móvil de floración, el florígeno, libera la información dependiente del fotoperiodo, de la hoja al ápice de crecimiento del tallo (Kobayashi y Weigel, 2007).
El efecto de la luz sobre la inducción floral ha es-timulado el uso de la iluminación artificial para los cultivos, por lo cual las lámparas de alta presión de sodio y aditivos metálicos (HPS y MH, por sus si-glas en inglés, respectivamente) y las lámparas fluo-rescentes (FL) se usan en horticultura en cámaras de crecimiento y en invernaderos (Krizek et al., 1998; Hemming, 2011; Runkle, 2008). Las lámparas HPS
as climate (Kindlmann and Balounová, 2001; Pfeifer et al., 2006).
Flowering begins as a response to environmental factors and endogenous patterns, these last ones, also referred to as autonomous (genetically controlled), operate independently of the environmental signals and are related to the development phase of the plant (Amasino and Michaels, 2010). Genetic control of flowering was investigated by Weigel and Nilsson (1995), Kobayashi and Weigel (2007), Barrett (2008) and Andrés and Coupland (2012). The identification of the DOMADS1, DOMADS2, and DOMADS3 genes is the first step towards the elucidation of the molecular mechanisms of the floral transition in orchids (Yu and Goh, 2000).
Amongst the climatic factors that influence flowering, those considered secondary (less predictable than the primary) stand out, such as the environmental temperature, light (irradiance and day length) and water availability (Bernier and Périlleux, 2005). For Oncidium, the oxidation-reduction proportion (REDOX) of AsA (ascorbate), under temperature stress, represents a primordial change to mediate the transition between the vegetative and the reproductive phases (Chin et al., 2014).
Plant growth and development are regulated by the quality of light (color, wavelength), and quantity (flow rate), and photoperiod (lighting length) (Folta and Childers, 2008). According to Cerdán and Chory (2003), a light quality pathway that regulates the blooming period of plants has been identified. An appropriate photoperiod generates an inductive stimulus based on a mechanism of external matching and the nature of the blooming mobile signal, the florigen, releases the photoperiod-dependent information, from the leaf to the stem growth apex (Kobayashi and Weigel, 2007).
The effect of light on flower induction has stimulated the use of artificial lighting for crops. Therefore, high-pressure sodium and metal-halide (HPS and MH) and fluorescent lamps (FL) are used for horticulture in growth chambers and greenhouses (Krizek et al. 1998; Hemming, 2011; Runkle, 2008). High-pressure sodium lamps have a high-energy efficiency and a 550 to 650 nm spectrum (Hemming, 2011), but they are deficient in the UV and blue region. These lamps are not considered appropriate for cyclical lighting since the frequent on/off switch reduces the life expectancy of the bulbs and ballasts (Blanchard and Runkle, 2009). Metal halide lamps
AGROCIENCIA, 1 de enero - 15 de febrero, 2018
VOLUMEN 52, NÚMERO 138
tienen una eficiencia energética alta y un espectro de 550 a 650 nm (Hemming, 2011), aunque es defi-ciente en la región UV y azul. Estas lámparas no se consideran apropiadas para iluminación cíclica debi-do a que el frecuente cambio de encendido-apagado reduce la esperanza de vida de los bulbos y balastas (Blanchard y Runkle, 2009), mientras que las lám-paras MH emiten radiación en la región UV y azul, pero son deficientes en la porción del espectro rojo y rojo-lejano. Por ello, Krizek et al. (1998) sugirie-ron usar combinación de HPS y MH. Las lámparas o tubos fluorescentes emiten longitudes de onda entre los 400 y 700 nm, son más eficientes que las incan-descentes por la conversión a energía más utilizable para el crecimiento de plantas y por tener un espectro más balanceado. Además, los tubos distribuyen la luz de manera más uniforme que las lámparas (Runkle, 2008). Un reto importante en el uso de luz artificial es la reducción del uso de energía y costos, por lo cual se espera que los diodos emisores de luz (LED, por sus siglas en inglés) cubran este requerimiento (Hemming, 2011).
Los LEDs son un avance tecnológico importante en la horticultura por estas ventajas: tamaño peque-ño, largo periodo de operación, control de la compo-sición espectral, baja emisión de calor y eficiencia en la conversión de energía (Morrow, 2008; Massa et al, 2008). Además, su potencial se advierte en la investi-gación y producción en ambientes controlados, y en cultivo in vitro; asimismo, los LEDs se usan como luz complementaria para fotoperiodos de luz en inverna-dero. Pero Morrow (2008) indica que estas aplicacio-nes están aún en desarrollo, y el reto es encontrar las correctas combinaciones espectrales y de intensidades (Massa et al., 2008; Olle and Viršilė, 2013). La inves-tigación relacionada con el uso de LEDs para inducir floración de plantas adultas de orquídeas es escasa.
El objetivo de esta investigación fue evaluar la influencia del ambiente de invernadero y dos am-bientes controlados, cada uno con fuentes de luz diferentes, sobre el crecimiento, la inducción floral e indicadores de desarrollo floral de plantas adultas de L. anceps Lindl. subesp. anceps con y sin floración en el año anterior. La hipótesis fue que el ambiente controlado con iluminación LED promueve el cre-cimiento vegetativo y la inducción floral de plantas adultas de L. anceps subesp. anceps, de manera similar a los que resultan de la combinación de las lámpa-ras HPS+MH+FL y al de luz natural en invernadero;
emit radiation in the UV and blue regions but are deficient in the red and far-red spectrum portion. For this reason, Krizek et al. (1998) suggested using an HPS and MH combination. Fluorescent lamps emit wavelengths between 400 and 700 nm, are more efficient than the incandescent, offering more available energy for plant growth by having a more balanced spectrum. Also, tubes distribute light more evenly than lamps (Runkle, 2008). A major challenge in the use of artificial lighting is the reduction of energy and costs, which is expected to have the light emitting diodes (LED) to cover this requirement (Hemming, 2011).
Light emitting diodes are a major technological advance in horticulture. These advantages include small size, long operation periods, control of the spectral composition, low heat emission and efficient energy conversion (Massa et al., 2008; Morrow, 2008). Also, their potential is foreseen in research and production in controlled environments, and in vitro culture; also LEDs are used as complementary light to photoperiods in greenhouses. But Morrow (2008) indicated that these applications are still under development, and the challenge is to find the correct spectral and intensity combinations (Massa et al., 2008; Olle and Viršilė, 2013). Research related to the use of LEDs to induce flowering of orchid adult plants is scarce.
The objective of this research was to evaluate the influence of greenhouse and two controlled environments, each one with different light sources, during the growth, flower induction and flower development indicators in L. anceps Lindl. subsp. anceps old-age plants with and without flowering the previous year. We hypothesized that the environment controlled with LED lights promotes vegetative growth and flower induction in old-age plants of L. anceps subesp. anceps, similarly to those resulting from the combination of HPS+MH+FL lamps and those of natural light at the greenhouse; in addition, the flowering background influences flower induction of the current cycle.
mAteRIAls And methods
Plant material and experimental conditions
In this study, we used four years old adult L. anceps Lindl. subsp. anceps plants, 30 cm height, with 3±1 pseudobulbs
39SÁNCHEZ-VIDAÑA et al.
CRECIMIENTO, INDUCCIÓN Y DESARROLLO FLORAL DE Laelia anceps subesp. anceps (ORCHIDACEAE)
además, que el antecedente de floración influye en la inducción floral del ciclo actual.
mAteRIAles y métodos
Material vegetal y condiciones experimentales
En este estudio se usaron plantas adultas de L. anceps Lin-dl. subesp. anceps de cuatro años de edad y 30 cm de altura, con 3±1 pseudobulbos y hojas, y se trasplantaron en macetas traslúcidas de 1 L de capacidad, en corteza de pino como sus-trato (Ecorteza®; partículas con diámetro medio de 1.3 cm). Las plantas se mantuvieron en invernadero por tres meses, separa-das en dos grupos, de acuerdo con el antecedente de floración al momento del establecimiento del experimento: 1) plantas con floración anterior (CFA); 2) plantas sin floración anterior (SFA). Todas las plantas se fertilizaron con solución nutritiva preparada con 1 g L-1 de Peters® 30N-10P-10K (300, 100 y 100 mg L-1 de N, P y K, respectivamente). Cada 15 d se aplicaron 100 mL de solución por maceta.
En el ambiente invernadero (AInv), las plantas se colocaron en un invernadero construido con plástico blanco encima del cual se colocó malla sombra al 70 %. La temperatura promedio fue 29/13 °C diurna/nocturna y flujo de fotones fotosintéticos (FFF) de 90 mmol.m-2 s-1 (promedio diario duarante el experi-mento). Para dicho ambiente se estimó un fotoperiodo natural aproximado de 12 h, entre mayo y julio (meses cuando ocurrió la inducción).
Para el manejo de los factores ambientales en ambiente con-trolado se usaron dos cámaras de crecimiento, cada una con di-ferentes FFF proporcionados por distintas fuentes de luz. En el ambiente controlado 1 (AC1), la luz se proporcionó con ocho tubos fluorescentes de luz de día (FL) cada uno de 32 watts, com-binados con una lámpara de aditivos metálicos (MH) de 400 watts y una lámpara de alta presión de sodio (HPS) de 250 watts; todas las lámparas fueron marca Philips. La suma de estas fuentes de luz generó un FFF de 80 mmol m-2 s-1. En AInv y AC1, el FFF se estimó de acuerdo con Runkle (2008), y a partir de los luxes medidos con un data logger HOBOware ® Pro Onset. En el ambiente controlado 2 (AC2), la luz fue proporcionada por una lámpara de diodos emisores de luz (LEDs), modelo GROW LED CUBE marca ADAPTA® de 50W, con luz roja a 660 nm y luz azul a 460 nm, en proporción 8:1, respectivamente. El FFF en las lámparas LED fue 64 mmol m-2s-1y se estimó por la transfor-mación a lúmenes: (watts de la lámpara * 70), (erenovable.com), dividido por 54 (Runkle, 2008). En los ambientes controlados las fuentes de luz se distribuyeron en un área de 1 m2 y se colo-caron a una distancia de 50 cm sobre las plantas en estudio. Con base en observaciones previas y dado que no hay información
and leaves. These plants were transplanted into 1 L translucent containers, using pine bark as a substrate (Ecorteza®; particles with 1.3 cm average diameter). The plants were separated into two groups, according to the flowering background at the time of the experiment establishment and kept in a greenhouse for three months: (1) plants with previous flowering (CFA) and (2) plants without previous flowering (SFA). All plants were fertilized with a nutrient solution prepared with 1 g L-1 of Peters® 30 N - 10 P - 10 K (300, 100 and 100 mg L-1 of N, P, and K, each). Every 15 d, 100 mL of the solution was applied to each pot.
At the greenhouse environment (AInv), the plants were placed in a white plastic greenhouse with a 70 % shade mesh over it. The day/night mean temperature was 29/13 °C and the photosynthetic photon flux (FFF) was 90 mmol m-2 s-1 (daily average during the experiment). For this environment, we estimated a natural photoperiod of approximately 12 h, between May and July (when the induction took place).
We used two growth chambers, each with different FFF provided by different light sources. The controlled environment 1 (AC1) had lighting provided by eight fluorescent daylight tubes (FL) of 32 watts each, combined with a 400 W MH lamp and a 250 W HPS lamp; all lights Philips® . The sum of these light sources generated an 80 mmol m-2 s-1 FFF. In AInv and AC1, we assessed FFF following Runkle (2008), and from the measured lux recorded with a HOBOware® Pro Onset data logger. In the controlled environment 2 (AC2), the light was provided by a 50 W LED lamp (GROW LED CUBE ADAPTS® model) with 660 nm red light and 460 nm blue light, in an 8:1 ratio. LED lamps emitted a 64 µmol m-2 s-1 FFF, which it was estimated by the transformation to lumens: (lamp watts bbbvc* 70), (erenovable.com), divided by 54 (Runkle, 2008). Light sources were distributed in a 1 m2 area and placed at a distance of 50 cm above the plants in the controlled environments. Based on previous observations, and since there is no information for the studied species, both environments were set to 9 h light and 15 h dark photoperiod and 25/13 °C day/night temperature.
Plants were fertilized as soon as they entered the growth chamber with Peters® 10N - 30 P – 20 K (100, 300 and 200 mg L-1 of N, P and K, each). Every 7 d we applied 100 mL of nutrient solution to each pot. Plants were irrigated with acidified tap water pH 5.5, before each fertilization and two additional irrigations were made between each fertilization to avoid substrate desiccation and salts accumulation.
For the experiment, based on previous observations that showed scapes abortion before 5 cm, the flower induction was considered once the flower stalk reached a 5 cm height above the pseudobulb apex. At that time, we removed the plants from the growth chambers, and the blooming development was finally completed under greenhouse conditions. Anthesis appeared in
AGROCIENCIA, 1 de enero - 15 de febrero, 2018
VOLUMEN 52, NÚMERO 140
para la especie estudiada, ambos ambientes se establecieron con fotoperiodo 9 h luz y 15 h oscuridad, y temperatura 25/13 °C diurna/nocturna.
Desde su ingreso a las cámaras, las plantas se fertilizaron con Peters® 10N-30P-20K (100, 300 y 200 mg L-1 de N, P y K, res-pectivamente). En cada maceta se aplicaron 100 mL de solución nutritiva cada 7 d. Previo a cada fertilización, el material se regó con agua corriente acidificada a pH de 5.5, y entre cada fertiliza-ción se hicieron dos riegos adicionales para evitar la desecación del sustrato y la acumulación de sales.
Para el experimento y con base en observaciones previas que mostraron el aborto de los escapos antes de los 5 cm, la inducción a floración se consideró una vez que el tallo floral alcanzó 5 cm de altura por encima del ápice del pseudobulbo. En ese momento, las plantas se retiraron de las cámaras de crecimiento y el desarro-llo de la floración se completó en condiciones de invernadero. La antesis se presentó en días cortos (fotoperiodo aproximado de 11 h), entre los meses de octubre y noviembre.
Diseño experimental y diseño de tratamientos
El diseño experimental fue completamente al azar con 20 repeticiones por tratamiento y la unidad experimental fue una maceta con una planta. Los tratamientos se generaron con las dos condiciones de floración (CFA y SFA) y los tres ambientes (AInv, AC1 y AC2) y fueron: 1) AInv + CFA (luz natural con FFF de 90 mmol.m-2.s-1 + con floración anterior); 2) AInv + SFA (luz natural con FFF de 90 mmol.m-2 s-1 + sin floración anterior); 3) AC1 + CFA (HPS+MH+FL con FFF de 80 mmol m-2 s-1 + con floración anterior); 4) AC1 + SFA (HPS+MH+FL con FFF de 80 mmol m-2 s-1 + sin floración anterior); 5) AC2 + CFA (LED con FFF de 64 mmol m-2 s-1 + con floración anterior); 6) AC2 + SFA (LED con FFF de 64 mmol m-2 s-1 + sin floración anterior). El experimento de inducción floral duró 60 d.
Variables
Variables de crecimiento vegetativo
La altura total de la planta (AP) se midió desde la base del pseudobulbo hasta el ápice de la hoja más grande; también se midió el número total de hojas (NTH), pseudobulbos (NTPsb) y brotes (NTBr); así como el diámetro (DPsb) y la longitud del pseudobulbo (LPsb) del brote inducido y no inducido a flora-ción, y la longitud de la hoja de los mismos (LH). Las variables se midieron cada semana durante el experimento.
short days (approximately 11 h photoperiod), between October and November.
Experimental design and treatments
Experimental design was completely random, with 20 repetitions per treatment. The experimental unit was a pot with a plant. Treatments were generated with two flowering conditions (CFA and SFA) and the three environments (AInv, AC1 and AC2). These were: 1) AInv + CFA (natural light with mean 90 mmol m-2 s-1 FFF + previous flowering), 2) AInv + SFA (natural light with mean 90 mmol m-2 s-1 FFF + without previous flowering), 3) AC1 + CFA (HPS + MH + FL with 80 mmol m-2 s-1 FFF + previous flowering), 4) AC1 + SFA (HPS + MH + FL with 80 mmol m-2 s-1 FFF + without previous flowering), 5) AC2 + CFA (LED with 64 mmol m-2 s-1 FFF + previous flowering) and 6) AC2 + SFA (LED with 64 mmol m-2 s-1 FFF + without previous flowering). The flower induction experiment lasted 60 d.
Variables
Vegetative growth variables
Total plant height (AP) was measured from the base of the pseudobulb up to the apex of the largest leaf; the total number of leaves (NTH), pseudobulbs (NTPsb), and shoots (NTBr); as well as diameter (DPsb) and length of the pseudobulb (LPsb) and leaf length (LH) of the shoot induced and not induced to flowering. Variables were weekly measured.
Flowering variables
1) Days to anthesis of the first flower (DA); 2) flower life (VF); 3) number of flowers per raceme (NF); 4) flower stalk length (LTF), from the first node of the stalk, next to the apex of the pseudobulb, up to the start of the raceme; 5) flower stalk diameter (DTF) measured in the first node, next to the apex of the pseudobulb; 6) flower size, which included the length from the apex of the superior sepal to the apex of the inferior sepal (LS), as well as the width, from the apex of the left petal to the apex of the right petal (LP); 7) labellum size, which include its length (LLab) and width (ALab).
Supplementary variables
1) Probability model of the flower induction, according to the effect of light intensity (in both controlled environments)

41SÁNCHEZ-VIDAÑA et al.
CRECIMIENTO, INDUCCIÓN Y DESARROLLO FLORAL DE Laelia anceps subesp. anceps (ORCHIDACEAE)
Variables de floración
1) Días a antesis de la primera flor (DA); 2) vida de la flor (VF); 3) número de flores por racimo (NF); 4) longitud del tallo floral (LTF), desde el primer nudo del tallo, inmediato al ápice del pseudobulbo, hasta el inicio del racimo; 5) diámetro del tallo floral (DTF) medido en el primer nudo inmediato al ápice del pseudobulbo; 6) tamaño de la flor, que incluyó la longitud des-de el ápice del sépalo superior al ápice del sépalo inferior (LS), así como el ancho desde el ápice del pétalo izquierdo al ápice el pétalo derecho (LP); 7) tamaño del labelo, que comprendió su longitud (LLab) y ancho (ALab).
Variables complementarias
1) Modelación de la probabilidad de inducción a floración, según efecto de la intensidad de luz (en los dos ambientes contro-lados) y la CFA (en los tres ambientes), mediante el número de plantas inducidas en cada tratamiento; 2) porcentaje de induc-ción floral; 3) correlación de variables de crecimiento vegetativo y reproductivo.
Análisis de datos
Para evaluar la relación entre las variables respuesta de creci-miento vegetativo y de floración se usó un ANDEVA y las medias se compararon con la prueba de Tukey (p£0.05), para lo cual se usó SAS Enterprise Guide (SAS Institute, Inc., 2009). La pro-babilidad de la inducción floral en los tres ambientes se modeló con regresión logística. El coeficiente de correlación de Pearson se usó para estimar la relación de las variables de crecimiento vegetativo vs. las de floración, y la correlación entre las variables de floración.
ResultAdos y dIscusIón
Análisis del crecimiento vegetativo
Altura de plantas
La altura de las plantas que presentaron brotes in-ducidos o no inducidos a floración durante el experi-mento mostró diferencias significativas en ambiente controlado e invernadero: las plantas CFA en inver-nadero tuvieron la mayor altura, en relación con las de AInv + SFA, y mayor que en los tratamientos en AC2 + SFA (en plantas inducidas); AC1 + CFA y AC2 + CFA (plantas no inducidas), (p£0.05; Figura 1).
and the CFA (in the three environments), by number of induced plants in each treatment; 2) percentage of flower induction; 3) vegetative and reproductive growth variables correlation.
Data analysis
To evaluate the relationships among the response variables for vegetative growth and flowering, we performed an ANOVA on the data and compared their means using Tukey test (p£0.05). For which, SAS Enterprise Guide was used (SAS Institute, Inc., 2009). The blooming induction probability in the three environments was modeled with logistic regression. We used the Pearson correlation coefficient to estimate the relation between the variables of vegetative growth vs. flowering variables, and the correlation between the flowering variables.
Results And dIscussIon
Vegetative growth analysis
Plant height
The plants height of induced and non-induced shoots during the experiment was significantly different between the controlled environment and the greenhouse: CFA plants in greenhouse were higher, in relation to the AInv + SFA and AC2 + SFA (induced plants), AC1 + CFA and AC2 + CFA (non induced plants) treatments (p£0.05; Figure 1).
These results show that in the analyzed controlled environments, plants that bloomed the previous year exhibited lower height, which can be one of the causes of the blooming non-induction in our research. Also, the height of the L. anceps subsp. anceps plants induced or not to flowering in a controlled environment (LED light or combination of HPS + MH + FL) was equal to or less than the plants in the greenhouse, where the CFA factor is an important supplement to the obtained results from the same lighting source. Our results contrasted with those reported by Terfa et al. (2012), who analyzed quality parameters of potted roses (Rose × hybrid ‘Toril’) grown in 100 µmol m-2 s-1 light intensity with different light qualities provided by LEDs (80 % red and 20 % blue) and HPS lamps, in closed growth chambers and in greenhouse. The length of the stem and the pedicel were significantly shorter in plants that grew under LED light compared to those on HPS lighting, although the total production

AGROCIENCIA, 1 de enero - 15 de febrero, 2018
VOLUMEN 52, NÚMERO 142
Lo anterior muestra que en los ambientes con-trolados analizados las plantas que florecieron el año anterior presentaron una altura menor, lo cual puede ser una de las causas de la no inducción a floración en nuestra investigación. Además, la altura de las plantas de L. anceps subesp. anceps inducidas o no induci-das a floración en ambiente controlado (luz LED o combinación de HPS+MH+FL) fue igual o inferior a las de plantas en invernadero, donde el factor CFA es un complemento importante para los resultados obtenidos de la fuente de luz por si misma. Nuestros resultados contrastan con los de Terfa et al. (2012), quienes analizaron parámetros de calidad de rosas en maceta (Rosa × hybrida ‘Toril’) crecidas con inten-sidad lumínica de 100 mmol m-2 s-1 con diferentes calidades de luz provistas por LED (80 % roja y 20 % azul), y lámparas HPS, tanto en cámaras cerra-das de crecimiento como en invernadero. La longi-tud del tallo y del pedicelo fueron significativamente más cortos en plantas que crecieron bajo luz LED
Figura 1. Altura de plantas de L. anceps subesp. anceps con brotes vegetativos inducidos y no inducidos a floración, en diferentes ambientes de cultivo y con distintos antecedentes de floración, al final del ciclo experimental (60 d).
Figure 1. Plant height of L. anceps subsp. anceps with vegetative shoots induced and not induced to flowering, in different culti-vation environments and with different flowering background, at the end of the experimental cycle (60 d).
Valores promedio con letras distintas en barras indican diferencias significativas entre tratamientos (Tukey, p£0.05) v Mean values with different letters on the bars indicate significant differences between treatments (Tukey, p£0.05).AInv: ambiente invernadero (luz natural con intensidad lumínica promedio de 90 mmol m-2 s-1); AC1: ambiente controlado 1 (HPS+MH+FL con intensidad lumínica de 80 mmol m-2 s-1); AC2: ambiente controlado 2 (LED con intensidad lumínica de 64 mmol m-2 s-1); CFA: plantas con floración anterior; SFA: plantas sin floración anterior v AInv: greenhouse environment (natural light with 90 mmol m-2 s-1 average light intensity), AC1: controlled environment 1 (HPS + MH + FL with 80 mmol m-2 s-1 light intensity), AC2: controlled environment 2 (LED with 64 mmol m-2 s-1 light intensity), CFA: plants with previous flowering, and SFA: plants without previous flowering.
40
Altu
ra (
cm)
35
30 b
a
Plantas no inducidas a floraciónPlantas inducidas a floración
25
20
15
10
5
0
AIn
v+C
FA
AIn
v+SF
A
AC
1+C
FA
AC
1+SF
A
AC
2+C
FA
AC
2+SF
A
AIn
v+C
FA
AIn
v+SF
A
AC
1+C
FA
AC
1+SF
A
AC
2+C
FA
AC
2+SF
A
ab
c
abab
a
b abb
bab
period did not change. Yamada et al. (2008) used different light sources: red (660±30 nm) and far red (730±30 nm), all with 5 mmol·m−2·s−1 FFF, in Eustoma grandiflorum ‘Neilpeach Neo’. They found that the stem elongation rate was higher in plants grown under far red fluorescent lamps, it was similar under fluorescent and incandescent lamps and lower under daylight like fluorescent lamps compared with the control (without additional lighting). But in our study there was greater FFF (64 mmol m-2 s-1) with LED light, with a red light component, and the height of the plants was reduced compared to the greenhouse plants (without supplementary red light). The nature of the studied species promotes different responses.
Heo et al. (2006) used different mixes of LED type (with FFF = 90 ± 10 mmol m-2 s-1) radiation in the growth of agerato (Ageratum houstonianum Mill. cv. Blue Field), marigold (Tagetes erecta L. cv. Orange Boy) and sage (Salvia splendens E Sello ex Ruem &

43SÁNCHEZ-VIDAÑA et al.
CRECIMIENTO, INDUCCIÓN Y DESARROLLO FLORAL DE Laelia anceps subesp. anceps (ORCHIDACEAE)
comparada con HPS, aunque el periodo de produc-ción total no cambió. Yamada et al. (2008) usaron diferentes fuentes de luz: roja (660±30 nm) y roja lejana (730±30 nm), todas con FFF de 5 mmol·m-
2·s-1, en Eustoma grandiflorum ‘Neilpeach Neo’, y en-contraron que la tasa de elongación del tallo fue más alta en plantas crecidas bajo lámparas fluorescentes rojo-lejano, fue similar con lámparas fluorescentes e incandescentes, y menor con lámparas fluorescentes tipo luz de día, comparado con el testigo (sin ilu-minación complementaria). Pero, en nuestro estudio hubo mayor FFF (64 mmol m-2 s-1) con luz LED, con componente de luz roja, y redujo la altura de las plantas en comparación con las de invernadero (sin luz roja complementaria). La naturaleza de la especie en estudio promueve respuestas diferentes.
Heo et al. (2006) usaron diferentes mezclas de ra-diación tipo LED (con FFF = 90±10 mmol m-2 s-1) en el crecimiento de agerato (Ageratum houstonianum Mill. cv. Blue Field), cempasúchil (Tagetes erecta L. cv. Orange Boy), y salvia (Salvia splendens E Sello ex Ruem & Schult. cv. Red Vista). Ellos encontraron que la longitud de los tallos fue mayor (257, 147 y 140 %, respectivamente) con el componente de luz roja-lejana combinada con luz azul o roja, en com-paración con luz fluorescente (testigo). Nuestros re-sultados difieren porque el crecimiento en altura de plantas fue menor al usar luz LED (con combinación de luz roja y azul).
Número de órganos de crecimiento
Los resultados de crecimiento son a los 60 d por-que los muestreos semanales no mostraron diferen-cias significativas. El crecimiento de la orquídea en estudio es lento y el periodo experimental fue corto para apreciar diferencias antes de ese periodo.
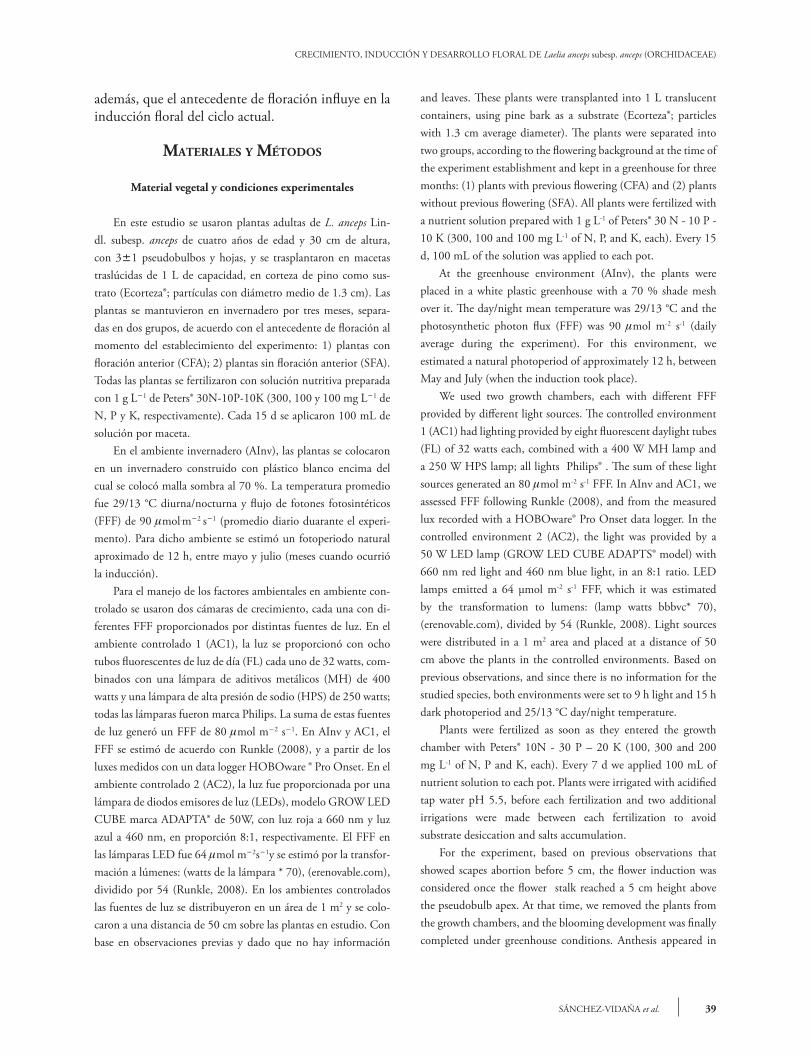
El NTH, NTPsb, y NTBr en plantas induci-das a floración no presentó diferencias significativas (p>0.05) entre los ambientes (Figura 2A). En las plantas no inducidas a floración el tratamiento AC2 + CFA tuvo un efecto negativo en el número de ho-jas, pseudobulbos y brotes (p£0.01) en comparación con los otros tratamientos (Figura 2B). Al igual que para la variable altura total de la planta, las plantas CFA cultivadas en el AC2 (con luz LED), dismi-nuyeron la producción de órganos de crecimiento, lo cual se reflejó en la ausencia de inducción floral. Esto puede indicar que para L. anceps subesp. anceps
Schult. cv. Red Vista). They found that the stem length was greater (257, 147 and 140 %, respectively) with a far red light component combined with blue or red light, compared to the fluorescent light (control). Our results differed because the plant height growth was lower when using LED lighting (red and blue light combination).
Number of growth organs
We report our results at 60 d because weekly samplings did not show significant differences. The orchid growth is slow and the experimental period here analyzed was short to appreciate differences before the evaluated period.
The NTH, NTPsb and NTBr in plants induced to flowering showed no significant differences (p>0.05) among the environments (Figure 2A). On plants not induced to flowering, the AC2 + CFA treatment had a negative effect on the number of leaves, pseudobulbs and shoots (p£0.01) compared with other treatments (Figure 2B). As for the total plant height, the CFA plants cultivated in the AC2 (with LED light) decreased the growth organs production, which resulted in the absence of flower induction. This may indicate that for L. anceps subsp. anceps the light intensity threshold for growth promoting induction could be of more than 60 mmol m-2 s-1, but less than 120 mmol m-2 s-1, because the plant leaves turn yellow, wither and fall when grown in a greenhouse with higher light intensity.
Vegetative shoots induced and non-induced to flowering
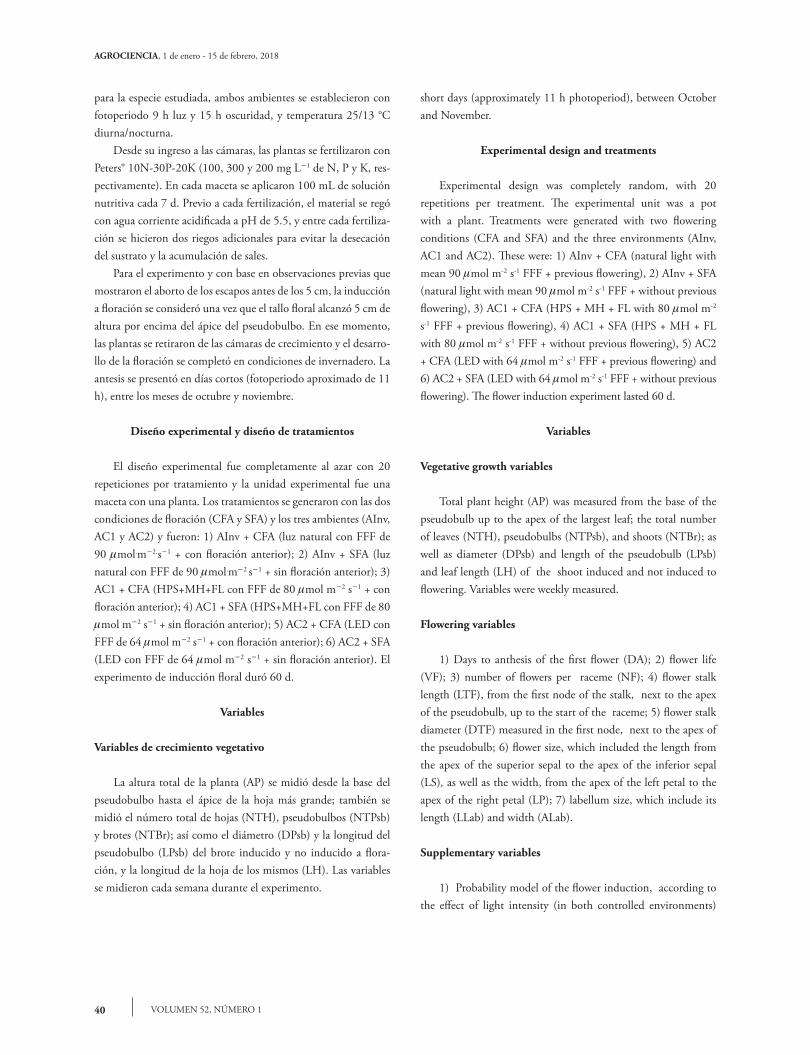
Treatments did not affect the growth of the vegetative shoots induced to bloom, but the length of the shoot leaves (LH) that were not induced to bloom decreased 17 % (p£0.05), due to AC1+ SFA and AC2 + CFA action, respect to the other treatments average. Also, the diameter of the pseudobulbs (DPsb) of the shoots not induced was 38 % lower (p£0.01), due to the action of the AC2 + CFA and AC2 + SFA (Table 1). It is important to highlight that the DPsb of the flowering-induced plants in AInv and AC1 was lower than that of the non-induced plants. That is to say, under the same treatments there were induced plants that had a smaller pseudobulb than those not induced; thus, it is likely that the previous
AGROCIENCIA, 1 de enero - 15 de febrero, 2018
VOLUMEN 52, NÚMERO 144
el umbral de intensidad de luz para un crecimiento que promueva inducción podría ser más de 60 mmol m-2 s-1, pero la intensidad de luz no debe ser me-nor a 120 mmol m-2 s-1 porque las hojas se tornan amarillas, se marchitan y caen cuando se cultivan en invernadero con una intensidad lumínica superior. Brotes vegetativos inducidos y no inducidos a flo-ración
Los tratamientos no afectaron el crecimiento de los brotes vegetativos inducidos a floración, pero la longitud de la hoja (LH) de brotes que no se induje-ron a floración disminuyó 17 % (p£0.05) por acción de AC1 + SFA y AC2 + CFA, respecto al promedio de los otros tratamientos. Además, el diámetro de los pseudobulbos (DPsb) de brotes no inducidos fue 38 % menor (p£0.01) por acción de AC2 + CFA y AC2 + SFA (Cuadro 1). Es importante resaltar que el DPsb de las plantas inducidas a floración en AInv y
Figura 2. Crecimiento vegetativo de plantas de L. anceps subesp. anceps con brotes inducidos (A) y no inducidos (B) a floración, en diferentes ambientes de cultivo y con distintos antecedentes de floración, al final del ciclo experimental (60 d).
Figure 2. Vegetative growth of L. anceps subesp. anceps with induced shoots (A) and not induced shoots (B) to flowering, in dif-ferent cultivation environments and with different flowering background at the end of the experimental cycle (60 d).
Valores promedio con letras distintas en barras indican diferencias significativas entre tratamientos (Tukey, p£0.05). AInv: ambiente invernadero (luz natural con intensidad lumínica promedio de 90 mmol m-2 s-1); AC1: ambiente controlado 1 (HPS+MH+FL con intensidad lumínica de 80 mmol m-2 s-1); AC2: ambiente controlado 2 (LED con intensidad lumínica de 64 mmol m-2 s-1). CFA: plantas con floración anterior; SFA: plantas sin floración anterior v Mean values with different letters in bars show significant differences between treatments (Tukey, p£0.05). AInv: environment greenhouse (natural light with 90 mmol m-2 s-1 average light intensity), AC1: controlled environment 1 (HPS + MH + FL with 80 mmol m-2 s-1 light intensity), AC2: controlled environment 2 (LED with 64 mmol m-2 s-1 light intensity), CFA: plants with previous flowering, and SFA: plants without previous flowering.
6N
úmer
o de
órg
anos
por
pla
nta 5
4
a
Hojas
3
2
1
0Pseudobulbos Brotes
aa
aa
a
a
aa
aa
a
a
a
aa
a
a
6
Núm
ero
de ó
rgan
os p
or p
lant
a
5
4
a
Hojas
3
2
1
0Pseudobulbos Brotes
b
a
ab
a a
a
b
a
ab
a
a
b
a
a
a
a
a
7A B
AInv+CFAAC1+CFAAC2+CFA
AInv+SFAAC1-SFAAC2-SFA
pseudobulbs are responsible, at least partially, of the photosynthates production of the current flower induction. In the production of new stems from the hybrid Cattleya forbesii Lindl. x Laelia tenebrosa Rolfe cultivated under higher light intensity (@ 1650 mmol m-2 s-1) the development depended on compounds in the pseudobulbs. Instead, with less light intensity (@ 400 mmol m-2 s-1) it depended on the stored compounds in the pseudobulbs and the photosynthetic rate. Therefore, adequate light levels optimize the development of new stems and flowers on C. forbesii X L. tenebrosa (Stancato et al., 2002).
Analysis of the flowering
Flower induction
The regression analysis used to model the flower induction showed that in the controlled environments and in the greenhouse the flowering background
45SÁNCHEZ-VIDAÑA et al.
CRECIMIENTO, INDUCCIÓN Y DESARROLLO FLORAL DE Laelia anceps subesp. anceps (ORCHIDACEAE)
AC1, fue menor que los de plantas no inducidas. Es decir, bajo los mismos tratamientos hubo plantas que se indujeron teniendo un pseudobulbo más pequeño que las no inducidas; así, es probable que los pseu-dobulbos anteriores al brote nuevo sean responsables, al menos en parte, de la producción de fotosintatos para la inducción floral actual.. En la producción de nuevos tallos del híbrido Cattleya forbesii Lindl. x Laelia tenebrosa Rolfe cultivado en mayor intensidad de luz (@ 1650 mmol m-2 s-1) el desarrollo dependió de los compuestos en los pseudobulbos, en cambio, con menor intensidad de luz (@ 400 mmol m-2 s-1) dependió de los compuestos almacenados en pseudo-bulbos y en la tasa fotosintética. Por lo tanto, niveles de luz adecuados optimizan el desarrollo de nuevos tallos y flores de C. forbesii X L. tenebrosa (Stancato et al., 2002).
Análisis de la floración
Inducción floral
El análisis de regresión utilizado para modelar la inducción floral mostró que en los ambientes contro-lados y en el invernadero, el antecedente de floración influyó significativamente en la inducción (Cuadro 2). Este resultado concuerda con los porcentajes de
Cuadro 1. Crecimiento de brotes vegetativos inducidos y no inducidos a floración de L. anceps subesp. anceps, en diferentes am-bientes de cultivo y con distintos antecedentes de floración, al final del ciclo experimental (60 d).
Table 1. Growth of vegetative shoots induced and non-induced to flowering of L. anceps subsp. anceps, in different cultivation environments and with different flowering backgrounds, at the end of the experimental cycle (60 d).
TratamientoBrote inducido a floración (cm) Brote no inducido a floración (cm)
DPsb LPsb LH DPsb LPsb LH
AInv + CFA 1.61±0.22 a 8.18±1.50 a 17.71±1.22 a 2.34±0.50 a 8.60±0.95 a 18.96±1.95 aAInv + SFA 1.78±0.69 a 7.70±1.42 a 18.10±2.72 a 2.44±0.38 a 7.83±1.23 a 16.38±3.10 aAC1 + CFA 1.43±0.28 a 6.94±1.29 a 15.79±3.13 a 2.33±0.48 a 7.55±1.36 a 15.84±2.51 aAC1 + SFA 1.44±0.05 a 8.63±1.28 a 16.96±0.45 a 2.38±0.53 a 7.02±1.59 a 14.01±3.98 bAC2 + CFA 1.52±0.28 a 7.96±1.96 a 17.05±1.12 a 1.45±0.33 b 6.96±1.65 a 14.23±5.03 bAC2 + SFA 1.59±0.10 a 7.63±1.42 a 14.93±0.40 a 1.46±0.40 b 7.98±1.50 a 15.59±2.73 aCV (%) 21.96 19.34 11.69 21.85 18.96 22.11
Valores promedio con letras distintas en columnas indican diferencias significativas entre tratamientos (Tukey, p£0.05). AInv: ambiente invernadero (luz natural con intensidad lumínica promedio de 90 mmol m-2 s-1); AC1: ambiente controlado 1 (HPS+MH+FL con in-tensidad lumínica de 80 mmol m-2 s-1); AC: ambiente controlado 2 (LED con intensidad lumínica de 64 mmol m-2 s-1). CFA: plantas con floración anterior; SFA: plantas sin floración anterior. DPsb: diámetro del pseudobulbo; LPsb: longitud del pseudobulbo; LH: longi-tud de la hoja v Mean values with different letters in columns indicate significant differences between treatments (Tukey, p£0.05). AInv: greenhouse environment (natural light with 90 mmol m-2 s-1 average light intensity), AC1: controlled environment 1 (HPS + MH + FL with 80 mmol m-2 s-1 light intensity), AC: controlled environment 2 (LED with 64 mmol m-2 s-1 light intensity), CFA: plants with previ-ous flowering, and SFA: plants without previous flowering. DPsb: pseudobulb diameter, LPsb: pseudobulb length, and LH: leaf length.
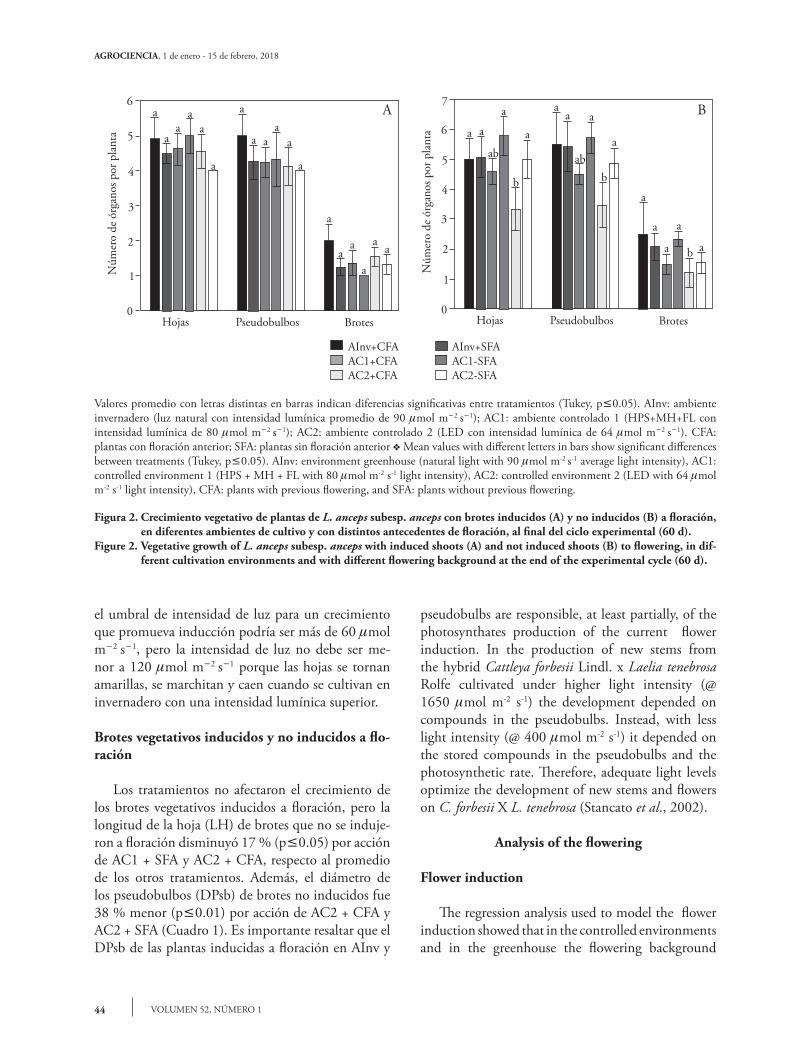
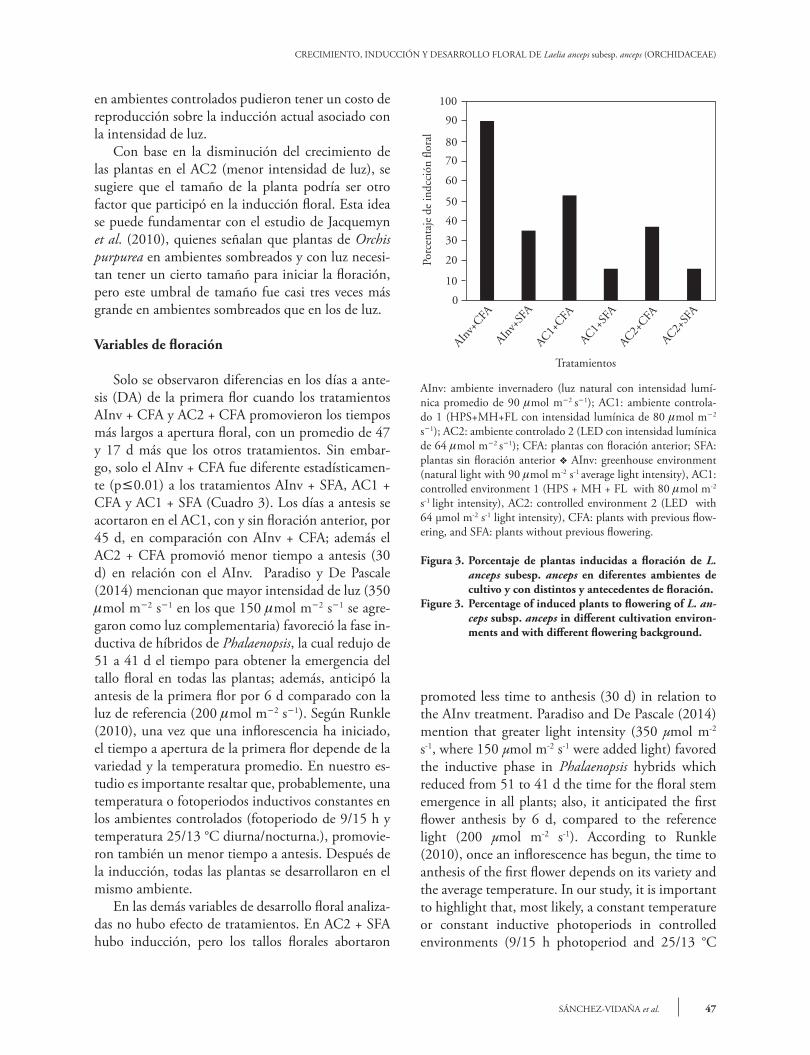
significantly affected the induction (Table 2). This result is consistent with the percentages of induction in different environments because the highest corresponded to the treatments where the plants had previous flowering, compared to those that did not (Figure 3). In controlled environments (AC1 + CFA and AC2 + CFA with 50 and 35 % flower induction, and AC1 + SFA and AC2 + SFA, with 15 % induction) the percentages were inferior compared to the greenhouse percentages. Even so, plants in the greenhouse did not show a 100 % of flower induction (90 % in CFA plants and 35 % in SFA plants).
The growth results showed above indicated that the non-induced plants in AC2, in combination with CFA plants, mainly, reduced the vegetative growth of the orchid under study. The results show that induced plants and with previous flowering have higher probability to induce flowering the next year (Table 2). In such situation, although the light intensity was not a significant factor in the probability of the flower induction, each environment (with different light intensities) in combination with the previous flowering suggests a directly proportional effect on the induction percentage (to higher light intensity in the environment, higher induction percentage) (Figure 3). The above shows that SFA plants in

AGROCIENCIA, 1 de enero - 15 de febrero, 2018
VOLUMEN 52, NÚMERO 146
inducción en los diferentes ambientes, porque los más altos correspondieron a tratamientos donde las plantas tuvieron floración anterior en comparación con las que no la tuvieron (Figura 3). En los ambien-tes controlados (AC1 + CFA y AC2 + CFA con in-ducción floral de 50 y 35 %; y AC1 + SFA y AC2 + SFA, con inducción de 15 %), los porcentajes fueron menores en comparación con los de invernadero. Aun así, las plantas en invernadero tampoco presen-taron 100 % de inducción floral (90 % en plantas CFA y 35 % en plantas SFA).
Los resultados de crecimiento ya indicados sugie-ren que plantas no inducidas en el AC2, en combi-nación con plantas CFA, principalmente, disminuye-ron el crecimiento vegetativo de la orquídea en estu-dio. Pero los resultados muestran que las plantas que sí se indujeron y con floración anterior tienen mayor probabilidad de que se induzcan el año siguiente (Cuadro 2). En tal situación, aunque la intensidad de luz no fue un factor significativo en la probabilidad de la inducción floral, cada ambiente (con diferentes intensidades de luz) en combinación con la floración anterior sugiere un efecto directamente proporcional al porcentaje de inducción (a mayor intensidad lumí-nica en el ambiente, mayor porcentaje de inducción) (Figura 3). Lo anterior muestra que las plantas SFA
Cuadro 2. Probabilidad de la influencia del ambiente (intensidad de luz) y el antecedente de floración en la inducción a floración de L. anceps subesp. anceps.
Table 2. Probability of the environment influence (light intensity) and the flowering background on flower induction of L. anceps subsp. an-ceps.
Factor de estudio Ambiente controladoPr
Ambiente invernadero Pr
Ambiente (intensidad de luz) 0.570 ns Factor no incluido¶
Antecedente de floración 0.009† 0.0014†
Ambiente (intensidad de luz) X Antecedente de floración
0.570 ns Factor no incluido¶
†Diferencias estadísticamente significativas (p£0.05); ns: no significativo. Pr: pro-babilidad de que el factor de estudio tenga efecto sobre la inducción a floración v Significant differences (p£0.05), ns: not significant, Pr: probability of the study factor to affect flower induction.¶El factor Ambiente (intensidad de luz) no fue constante en invernadero, y por consecuencia, dicho factor y Ambiente (intensidad de luz) X antecedente de flo-ración no fueron analizados en el ambiente invernadero v Environment factor (light intensity) was not constant in the greenhouse, and therefore that factor and environment (light intensity) X flowering background were not analyzed in the greenhouse environment.
controlled environments might have a reproduction cost on the current induction associated with the light intensity.
Based on the growth decrease in plants of AC2 treatment (lower light intensity), it suggests that the plant size could be another factor that participated in the flower induction. This idea is substantiated by Jacquemyn et al. (2010) study; they pointed out that Orchis purpurea plants in both shaded and with light environments need to have a certain size to start flowering. Nevertheless, this size threshold was almost three times larger in shaded environments than in the light.
Flowering variables
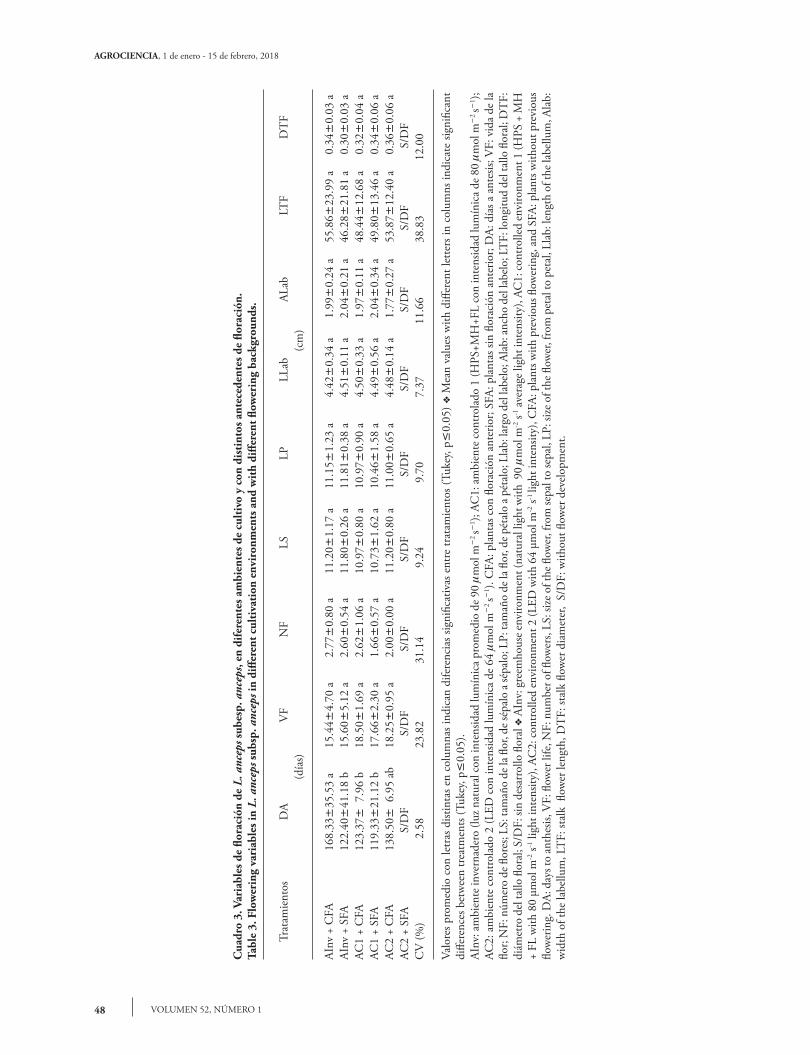
Differences were only in the days to anthesis (DA) of the first flower when the treatments AInv + CFA and AC2 + CFA promoted longer times to anthesis. These had an average of 47 and 17 d more than the other treatments. However, only AInv + CFA was statistically different (p ≤ 0.01) to the AInv + SFA, AC1 + CFA and AC1 + SFA treatments (Table 3). The days to anthesis were shortened in AC1 by 45 d, with and without previous flowering, compared to those of the greenhouse. Also, AC2 + CFA
47SÁNCHEZ-VIDAÑA et al.
CRECIMIENTO, INDUCCIÓN Y DESARROLLO FLORAL DE Laelia anceps subesp. anceps (ORCHIDACEAE)
AInv: ambiente invernadero (luz natural con intensidad lumí-nica promedio de 90 mmol m-2 s-1); AC1: ambiente controla-do 1 (HPS+MH+FL con intensidad lumínica de 80 mmol m-2
s-1); AC2: ambiente controlado 2 (LED con intensidad lumínica de 64 mmol m-2 s-1); CFA: plantas con floración anterior; SFA: plantas sin floración anterior v AInv: greenhouse environment (natural light with 90 mmol m-2 s-1 average light intensity), AC1: controlled environment 1 (HPS + MH + FL with 80 mmol m-2 s-1 light intensity), AC2: controlled environment 2 (LED with 64 µmol m-2 s-1 light intensity), CFA: plants with previous flow-ering, and SFA: plants without previous flowering.
Figura 3. Porcentaje de plantas inducidas a floración de L. anceps subesp. anceps en diferentes ambientes de cultivo y con distintos y antecedentes de floración.
Figure 3. Percentage of induced plants to flowering of L. an-ceps subsp. anceps in different cultivation environ-ments and with different flowering background.
100
Porc
enta
je d
e in
dcci
ón fl
oral
90
80
70
60
50
0
AInv+
CFAAIn
v+SF
AAC1+
CFAAC1+
SFA
AC2+CFA
AC2+SF
A
Tratamientos
20
30
40
10
en ambientes controlados pudieron tener un costo de reproducción sobre la inducción actual asociado con la intensidad de luz.
Con base en la disminución del crecimiento de las plantas en el AC2 (menor intensidad de luz), se sugiere que el tamaño de la planta podría ser otro factor que participó en la inducción floral. Esta idea se puede fundamentar con el estudio de Jacquemyn et al. (2010), quienes señalan que plantas de Orchis purpurea en ambientes sombreados y con luz necesi-tan tener un cierto tamaño para iniciar la floración, pero este umbral de tamaño fue casi tres veces más grande en ambientes sombreados que en los de luz.
Variables de floración
Solo se observaron diferencias en los días a ante-sis (DA) de la primera flor cuando los tratamientos AInv + CFA y AC2 + CFA promovieron los tiempos más largos a apertura floral, con un promedio de 47 y 17 d más que los otros tratamientos. Sin embar-go, solo el AInv + CFA fue diferente estadísticamen-te (p£0.01) a los tratamientos AInv + SFA, AC1 + CFA y AC1 + SFA (Cuadro 3). Los días a antesis se acortaron en el AC1, con y sin floración anterior, por 45 d, en comparación con AInv + CFA; además el AC2 + CFA promovió menor tiempo a antesis (30 d) en relación con el AInv. Paradiso y De Pascale (2014) mencionan que mayor intensidad de luz (350 mmol m-2 s-1 en los que 150 mmol m-2 s-1 se agre-garon como luz complementaria) favoreció la fase in-ductiva de híbridos de Phalaenopsis, la cual redujo de 51 a 41 d el tiempo para obtener la emergencia del tallo floral en todas las plantas; además, anticipó la antesis de la primera flor por 6 d comparado con la luz de referencia (200 mmol m-2 s-1). Según Runkle (2010), una vez que una inflorescencia ha iniciado, el tiempo a apertura de la primera flor depende de la variedad y la temperatura promedio. En nuestro es-tudio es importante resaltar que, probablemente, una temperatura o fotoperiodos inductivos constantes en los ambientes controlados (fotoperiodo de 9/15 h y temperatura 25/13 °C diurna/nocturna.), promovie-ron también un menor tiempo a antesis. Después de la inducción, todas las plantas se desarrollaron en el mismo ambiente.
En las demás variables de desarrollo floral analiza-das no hubo efecto de tratamientos. En AC2 + SFA hubo inducción, pero los tallos florales abortaron
promoted less time to anthesis (30 d) in relation to the AInv treatment. Paradiso and De Pascale (2014) mention that greater light intensity (350 µmol m-2 s-1, where 150 µmol m-2 s-1 were added light) favored the inductive phase in Phalaenopsis hybrids which reduced from 51 to 41 d the time for the floral stem emergence in all plants; also, it anticipated the first flower anthesis by 6 d, compared to the reference light (200 µmol m-2 s-1). According to Runkle (2010), once an inflorescence has begun, the time to anthesis of the first flower depends on its variety and the average temperature. In our study, it is important to highlight that, most likely, a constant temperature or constant inductive photoperiods in controlled environments (9/15 h photoperiod and 25/13 °C
AGROCIENCIA, 1 de enero - 15 de febrero, 2018
VOLUMEN 52, NÚMERO 148
Cua
dro
3. V
aria
bles
de
flora
ción
de
L. a
ncep
s sub
esp.
anc
eps,
en d
ifere
ntes
am
bien
tes d
e cu
ltiv
o y
con
dist
into
s ant
eced
ente
s de
flora
ción
.Ta
ble
3. F
low
erin
g va
riab
les i
n L.
anc
eps s
ubsp
. anc
eps i
n di
ffere
nt c
ulti
vati
on e
nvir
onm
ents
and
wit
h di
ffere
nt fl
ower
ing
back
grou
nds.
Trat
amie
ntos
DA
VF
NF
LSLP
LLab
ALab
LTF
DT
F(d
ías)
(cm
)
AInv
+ C
FA16
8.33
±35
.53
a 15
.44±
4.70
a2.
77±
0.80
a11
.20±
1.17
a11
.15±
1.23
a4.
42±
0.34
a1.
99±
0.24
a55
.86±
23.9
9 a
0.34
±0.
03 a
AInv
+ S
FA12
2.40
±41
.18
b15
.60±
5.12
a2.
60±
0.54
a11
.80±
0.26
a11
.81±
0.38
a4.
51±
0.11
a2.
04±
0.21
a46
.28±
21.8
1 a
0.30
±0.
03 a
AC1
+ C
FA12
3.37
± 7
.96
b18
.50±
1.69
a2.
62±
1.06
a10
.97±
0.80
a10
.97±
0.90
a4.
50±
0.33
a1.
97±
0.11
a48
.44±
12.6
8 a
0.32
±0.
04 a
AC1
+ SF
A11
9.33
±21
.12
b17
.66±
2.30
a1.
66±
0.57
a10
.73±
1.62
a10
.46±
1.58
a4.
49±
0.56
a2.
04±
0.34
a49
.80±
13.4
6 a
0.34
±0.
06 a
AC2
+ C
FA13
8.50
± 6
.95
ab18
.25±
0.95
a2.
00±
0.00
a11
.20±
0.80
a11
.00±
0.65
a4.
48±
0.14
a1.
77±
0.27
a53
.87±
12.4
0 a
0.36
±0.
06 a
AC2
+ SF
AS/
DF
S/D
FS/
DF
S/D
FS/
DF
S/D
FS/
DF
S/D
FS/
DF
CV
(%)
2.58
23.8
231
.14
9.24
9.70
7.37
11.6
638
.83
12.0
0
Valo
res p
rom
edio
con
letr
as d
istin
tas e
n co
lum
nas i
ndic
an d
ifere
ncia
s sig
nific
ativ
as e
ntre
trat
amie
ntos
(Tuk
ey, p£
0.05
) v M
ean
valu
es w
ith d
iffer
ent l
ette
rs in
col
umns
indi
cate
sign
ifica
nt
diffe
renc
es b
etw
een
treat
men
ts (T
ukey
, p£
0.05
).AI
nv: a
mbi
ente
inve
rnad
ero
(luz n
atur
al co
n in
tens
idad
lum
ínic
a pr
omed
io d
e 90 m
mol
m-
2 s-
1 ); A
C1:
am
bien
te co
ntro
lado
1 (H
PS+M
H+F
L co
n in
tens
idad
lum
ínic
a de
80 m
mol
m-
2 s-
1 );
AC2:
am
bien
te c
ontro
lado
2 (L
ED c
on in
tens
idad
lum
ínic
a de
64 m
mol
m-
2 s-
1 ). C
FA: p
lant
as c
on fl
orac
ión
ante
rior;
SFA:
pla
ntas
sin
flora
ción
ant
erio
r; D
A: d
ías a
ant
esis;
VF:
vid
a de
la
flor;
NF:
núm
ero
de fl
ores
; LS:
tam
año
de la
flor
, de s
épal
o a s
épal
o; L
P: ta
mañ
o de
la fl
or, d
e pét
alo
a pét
alo;
Lla
b: la
rgo
del l
abel
o; A
lab:
anch
o de
l lab
elo;
LT
F: lo
ngitu
d de
l tal
lo fl
oral
; DT
F:
diám
etro
del
tallo
flor
al; S
/DF:
sin
desa
rrol
lo fl
oral
v A
Inv:
gre
emho
use e
nviro
nmen
t (na
tura
l lig
ht w
ith 9
0 m
mol
m-2 s-1
aver
age l
ight
inte
nsity
), AC
1: co
ntro
lled
envi
ronm
ent 1
(HPS
+ M
H
+ FL
with
80
µmol
m-2 s-1
ligh
t int
ensit
y), A
C2:
con
trolle
d en
viro
nmen
t 2 (L
ED w
ith 6
4 µm
ol m
-2 s-1
ligh
t int
ensit
y), C
FA: p
lant
s with
pre
viou
s flow
erin
g, a
nd S
FA: p
lant
s with
out p
revi
ous
flow
erin
g. D
A: d
ays t
o an
thes
is, V
F: fl
ower
life
, NF:
num
ber o
f flow
ers,
LS: s
ize o
f the
flow
er, f
rom
sepa
l to
sepa
l, LP
: size
of t
he fl
ower
, fro
m p
etal
to p
etal
, Lla
b: le
ngth
of t
he la
bellu
m, A
lab:
w
idth
of t
he la
bellu
m, L
TF:
stal
k fl
ower
leng
th, D
TF:
stal
k flo
wer
dia
met
er,
S/D
F: w
ithou
t flow
er d
evel
opm
ent.
49SÁNCHEZ-VIDAÑA et al.
CRECIMIENTO, INDUCCIÓN Y DESARROLLO FLORAL DE Laelia anceps subesp. anceps (ORCHIDACEAE)
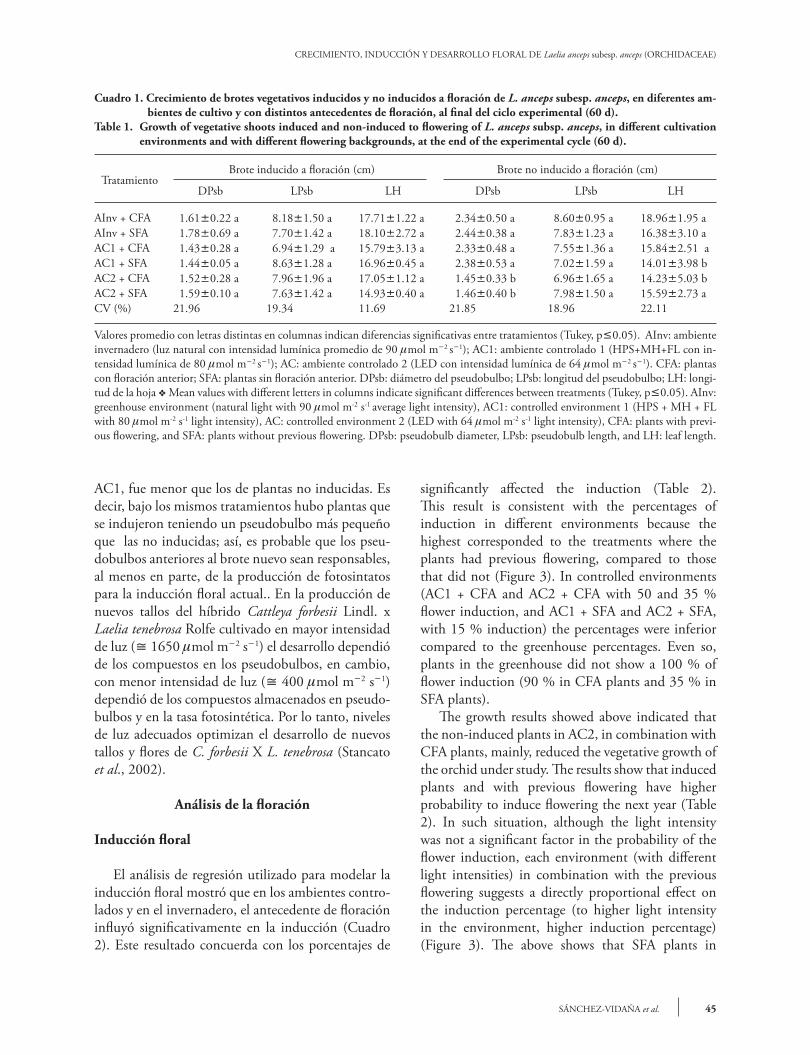
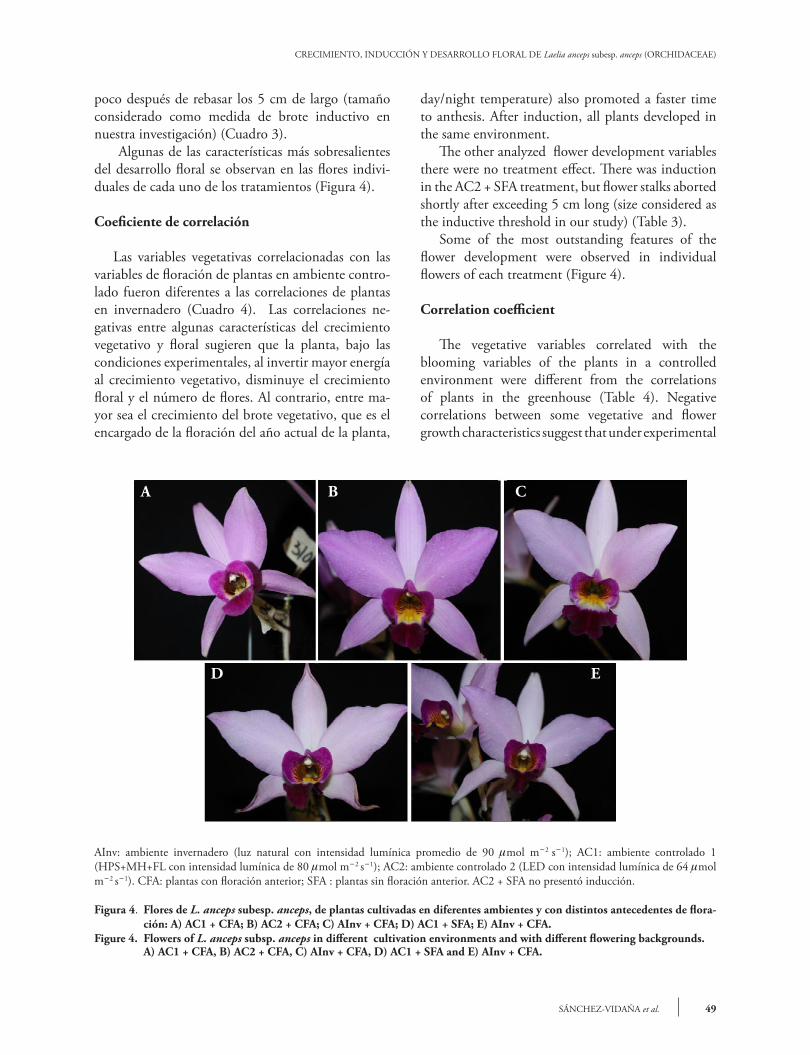
AInv: ambiente invernadero (luz natural con intensidad lumínica promedio de 90 mmol m-2 s-1); AC1: ambiente controlado 1 (HPS+MH+FL con intensidad lumínica de 80 mmol m-2 s-1); AC2: ambiente controlado 2 (LED con intensidad lumínica de 64 mmol m-2 s-1). CFA: plantas con floración anterior; SFA : plantas sin floración anterior. AC2 + SFA no presentó inducción.
Figura 4. Flores de L. anceps subesp. anceps, de plantas cultivadas en diferentes ambientes y con distintos antecedentes de flora-ción: A) AC1 + CFA; B) AC2 + CFA; C) AInv + CFA; D) AC1 + SFA; E) AInv + CFA.
Figure 4. Flowers of L. anceps subsp. anceps in different cultivation environments and with different flowering backgrounds. A) AC1 + CFA, B) AC2 + CFA, C) AInv + CFA, D) AC1 + SFA and E) AInv + CFA.
poco después de rebasar los 5 cm de largo (tamaño considerado como medida de brote inductivo en nuestra investigación) (Cuadro 3). Algunas de las características más sobresalientes del desarrollo floral se observan en las flores indivi-duales de cada uno de los tratamientos (Figura 4).
Coeficiente de correlación
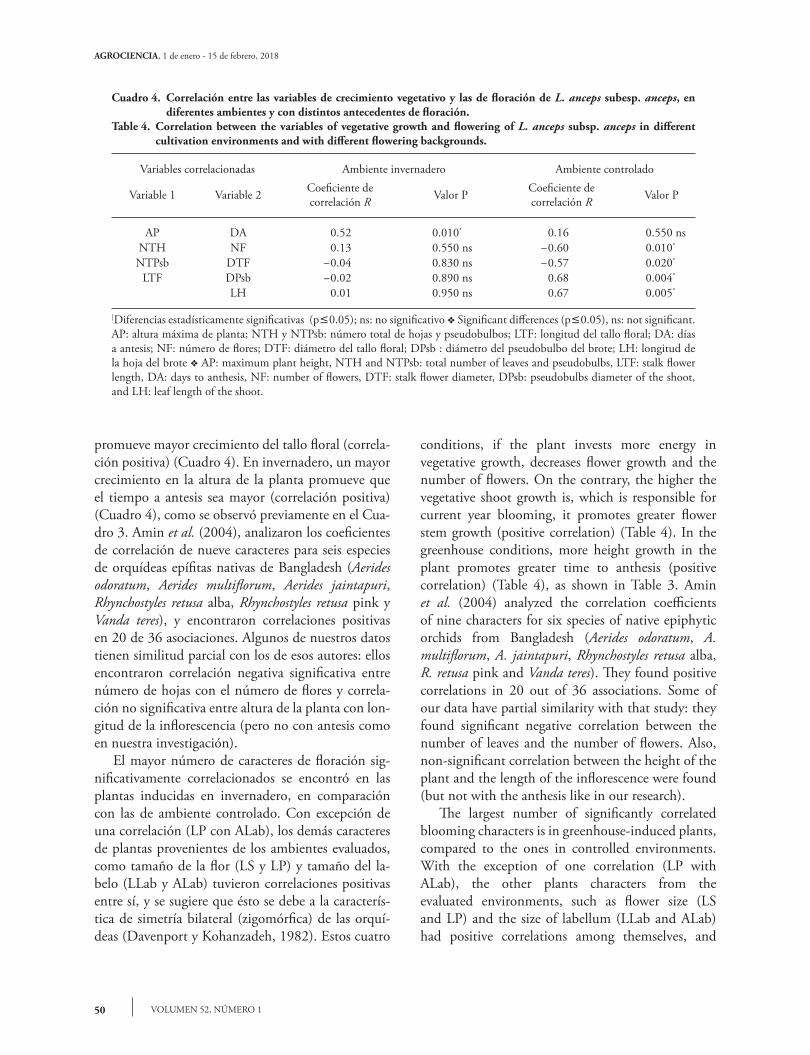
Las variables vegetativas correlacionadas con las variables de floración de plantas en ambiente contro-lado fueron diferentes a las correlaciones de plantas en invernadero (Cuadro 4). Las correlaciones ne-gativas entre algunas características del crecimiento vegetativo y floral sugieren que la planta, bajo las condiciones experimentales, al invertir mayor energía al crecimiento vegetativo, disminuye el crecimiento floral y el número de flores. Al contrario, entre ma-yor sea el crecimiento del brote vegetativo, que es el encargado de la floración del año actual de la planta,
A B C
D E
day/night temperature) also promoted a faster time to anthesis. After induction, all plants developed in the same environment.
The other analyzed flower development variables there were no treatment effect. There was induction in the AC2 + SFA treatment, but flower stalks aborted shortly after exceeding 5 cm long (size considered as the inductive threshold in our study) (Table 3).
Some of the most outstanding features of the flower development were observed in individual flowers of each treatment (Figure 4).
Correlation coefficient
The vegetative variables correlated with the blooming variables of the plants in a controlled environment were different from the correlations of plants in the greenhouse (Table 4). Negative correlations between some vegetative and flower growth characteristics suggest that under experimental
AGROCIENCIA, 1 de enero - 15 de febrero, 2018
VOLUMEN 52, NÚMERO 150
promueve mayor crecimiento del tallo floral (correla-ción positiva) (Cuadro 4). En invernadero, un mayor crecimiento en la altura de la planta promueve que el tiempo a antesis sea mayor (correlación positiva) (Cuadro 4), como se observó previamente en el Cua-dro 3. Amin et al. (2004), analizaron los coeficientes de correlación de nueve caracteres para seis especies de orquídeas epífitas nativas de Bangladesh (Aerides odoratum, Aerides multiflorum, Aerides jaintapuri, Rhynchostyles retusa alba, Rhynchostyles retusa pink y Vanda teres), y encontraron correlaciones positivas en 20 de 36 asociaciones. Algunos de nuestros datos tienen similitud parcial con los de esos autores: ellos encontraron correlación negativa significativa entre número de hojas con el número de flores y correla-ción no significativa entre altura de la planta con lon-gitud de la inflorescencia (pero no con antesis como en nuestra investigación).
El mayor número de caracteres de floración sig-nificativamente correlacionados se encontró en las plantas inducidas en invernadero, en comparación con las de ambiente controlado. Con excepción de una correlación (LP con ALab), los demás caracteres de plantas provenientes de los ambientes evaluados, como tamaño de la flor (LS y LP) y tamaño del la-belo (LLab y ALab) tuvieron correlaciones positivas entre sí, y se sugiere que ésto se debe a la caracterís-tica de simetría bilateral (zigomórfica) de las orquí-deas (Davenport y Kohanzadeh, 1982). Estos cuatro
Cuadro 4. Correlación entre las variables de crecimiento vegetativo y las de floración de L. anceps subesp. anceps, en diferentes ambientes y con distintos antecedentes de floración.
Table 4. Correlation between the variables of vegetative growth and flowering of L. anceps subsp. anceps in different cultivation environments and with different flowering backgrounds.
Variables correlacionadas Ambiente invernadero Ambiente controlado
Variable 1 Variable 2 Coeficiente de correlación R Valor P Coeficiente de
correlación R Valor P
AP DA 0.52 0.010* 0.16 0.550 nsNTH NF 0.13 0.550 ns -0.60 0.010*
NTPsb DTF -0.04 0.830 ns -0.57 0.020*
LTF DPsb -0.02 0.890 ns 0.68 0.004*
LH 0.01 0.950 ns 0.67 0.005*
]Diferencias estadísticamente significativas (p£0.05); ns: no significativo v Significant differences (p£0.05), ns: not significant.AP: altura máxima de planta; NTH y NTPsb: número total de hojas y pseudobulbos; LTF: longitud del tallo floral; DA: días a antesis; NF: número de flores; DTF: diámetro del tallo floral; DPsb : diámetro del pseudobulbo del brote; LH: longitud de la hoja del brote v AP: maximum plant height, NTH and NTPsb: total number of leaves and pseudobulbs, LTF: stalk flower length, DA: days to anthesis, NF: number of flowers, DTF: stalk flower diameter, DPsb: pseudobulbs diameter of the shoot, and LH: leaf length of the shoot.
conditions, if the plant invests more energy in vegetative growth, decreases flower growth and the number of flowers. On the contrary, the higher the vegetative shoot growth is, which is responsible for current year blooming, it promotes greater flower stem growth (positive correlation) (Table 4). In the greenhouse conditions, more height growth in the plant promotes greater time to anthesis (positive correlation) (Table 4), as shown in Table 3. Amin et al. (2004) analyzed the correlation coefficients of nine characters for six species of native epiphytic orchids from Bangladesh (Aerides odoratum, A. multiflorum, A. jaintapuri, Rhynchostyles retusa alba, R. retusa pink and Vanda teres). They found positive correlations in 20 out of 36 associations. Some of our data have partial similarity with that study: they found significant negative correlation between the number of leaves and the number of flowers. Also, non-significant correlation between the height of the plant and the length of the inflorescence were found (but not with the anthesis like in our research).
The largest number of significantly correlated blooming characters is in greenhouse-induced plants, compared to the ones in controlled environments. With the exception of one correlation (LP with ALab), the other plants characters from the evaluated environments, such as flower size (LS and LP) and the size of labellum (LLab and ALab) had positive correlations among themselves, and

51SÁNCHEZ-VIDAÑA et al.
CRECIMIENTO, INDUCCIÓN Y DESARROLLO FLORAL DE Laelia anceps subesp. anceps (ORCHIDACEAE)
Cuadro 5. Correlación entre las variables de floración de plantas de L. anceps subesp. anceps, cultivadas en diferentes ambientes y con distintos antecedentes de flo-ración.
Table 5. Correlation between flowering variables in L. anceps subsp. anceps plants in dif-ferent cultivation environments and with different flowering backgrounds.
Variables correlacionadas Ambiente invernadero Ambiente controlado
Variable 1 Variable 2 Coeficiente de correlación R Valor P Coeficiente de
correlación R Valor P
LTF DA 0.16 0.45 ns 0.56 0.02*
DTF 0.57 0.003* 0.75 0.001*
ALab -0.49 0.01* -0.01 0.95 nsLS LP 0.97 <.0001* 0.95 <0.0001*
LLab 0.95 <.0001* 0.86 <0.0001*ALab 0.70 0.0002* 0.57 0.02*NF -0.64 0.0009* -0.09 0.74 ns
LP LLab 0.94 <.0001* 0.82 0.0001ALab 0.72 <.0001* 0.45 0.06 nsNF -0.63 0.001* -0.14 0.60 ns
LLab ALab 0.69 0.0002* 0.60 0.01*NF -0.64 0.0008* 0.07 0.79 ns
ALab DTF -0.42 0.04* -0.03 0.88 nsNF -0.52 0.01* 0.04 0.88 ns
†Diferencias estadísticamente significativas (p£0.05); ns: no significativo v Statistically signifi-cant differences (p£0.05), ns: not significant.LTF: longitud del tallo floral; LS: tamaño de la flor, de sépalo a sépalo; LP: tamaño de la flor, de pétalo a pétalo; Llab: largo del labelo; Alab: ancho del labelo; DA: días a antesis; DTF: diámetro del tallo floral; NF: número de flores por racimo v LTF: flower stalk length, LS: flower size from sepal to sepal, LP: flower size from petal to petal, Llab: length of the labellum, Alab: width of the labellum, DA: days to anthesis, DTF: flower stalk diameter NF: number of flowers per raceme.
caracteres también tuvieron correlación positiva con el número de flores (NF) en las plantas inducidas en invernadero, pero no en las del ambiente controlado (Cuadro 5).
Asimismo, las plantas que se indujeron a floración en el ambiente controlado mostraron correlaciones positivas significativas entre la longitud del tallo flo-ral (LTF) con el diámetro del mismo (DTF) y con los días a antesis (DA) (Cuadro 5). Con base en este último dato y la floración de la especie en estudio du-rante el experimento, se consideró que la LTF se co-rrelacionaría con los DA en las plantas inducidas en el invernadero, ya que se ha observado que a mayor longitud, mayor es el tiempo a antesis. Sin embargo, no hubo correlación significativa entre estos caracte-res debido probablemente a la variación del tamaño de los tallos de estas plantas en el invernadero, pero el dato se sustenta en el Cuadro 3 en lo referente a DA. Esos datos son contrarios de manera parcial a los de
suggests that this is due to the bilateral symmetry characteristic (zigomorphic) of orchids (Davenport and Kohanzadeh, 1982). These four characters were also positively correlated with the number of flowers (NF) in greenhouse-induced plants, but not in the controlled environments (Table 5).
In addition, plants induced in the controlled environment showed significant positive correlations between the length of the flower stalk (LTF) with its own diameter (DTF) and the days to anthesis (DA) (Table 5). Based on above and the flowering of the species under study during the experiment, it was considered that LTF could be correlated with DA in induced greenhouse plants, because at greater length, greater the time to anthesis is. However, there was no significant correlation between these characters, probably due to the variation in the stems size in these plants in the greenhouse. Regard to no significant values, the data is supported in Table 3 in relation

AGROCIENCIA, 1 de enero - 15 de febrero, 2018
VOLUMEN 52, NÚMERO 152
Moniruzzaman et al. (2012) para orquídeas Dendro-bium, quienes encontraron que la longitud del tallo floral y de la inflorescencia se correlacionaron con el número de flores y vida de la flor. En nuestra inves-tigación se sugiere que la característica de la longitud del tallo puede ser uniformizada por la influencia del ambiente controlado en las plantas inducidas en él.
En cuatro años de observaciones de la población de estudio, L. anceps subesp. anceps, en condiciones experimentales en invernadero, presenta variaciones en la floración (inducción floral, longitud del tallo floral, tamaño de flor, días a antesis) conforme cambia el manejo (según condiciones experimentales) o los factores ambientales (altas o más bajas temperaturas; años muy lluviosos que promueven alta nubosidad y baja intensidad lumínica), aunque prevalezca el mis-mo fotoperiodo. A pesar de los múltiplies factores, nuestra investigación muestra hallazgos importantes para la inducción y desarrollo floral de la especie en estudio, como la reducción de los días a antesis. Tam-bién resalta el desarrollo de la flor sin anormalidades al retirarse de las cámaras a cierto tiempo después de la inducción floral.
conclusIones
Las condiciones experimentales en el ambiente controlado 2 (con luz LED) disminuyen el creci-miento vegetativo de plantas de Laelia anceps sub-esp. anceps que tuvieron floración anterior. El ante-cedente de floración tiene efectos en el crecimiento e inducción floral, y es significativamente mayor la probabilidad de inducción floral en plantas con flo-ración anterior. El ambiente invernadero promueve el mayor porcentaje de inducción floral, pero las tres condiciones ambientales evaluadas tienen efectos si-milares en el desarrollo floral.
La reducción de los días a antesis en cualquiera de los dos ambientes controlados contribuye al avance del establecimiento de un programa de floración en fechas específicas para la especie en estudio. Los aná-lisis de correlación muestran asociaciones positivas y negativas según ambientes evaluados, lo que estable-ce bases para la selección de la arquitectura vegetativa y las características florales. Con base en la necesidad de aplicación de tecnologías más compatibles con el ambiente, se advierte potencial en el uso de LEDs para la inducción floral de la especie de orquídea en estudio, pero se requiere mayor investigación
to DA. These data are partially inconsistent with the data obtained by Moniruzzaman et al. (2012) for Dendrobium orchids. The length of the flower stem and the length of the inflorescence correlate with the number and life of flowers. Our research suggests that the stem length characteristic can be standardized with the influence of the controlled environment in the induced plants.
Throughout the four years of observations of the L. anceps subsp. anceps population, under experimental conditions in greenhouse, there are flowering variations (flower induction, flower stem size, flower size, days to anthesis), as its management (depending on experimental conditions) or the environmental factors changed (high or low temperature; highly rainy years which promoted overcast cloudiness and low light intensity), although, the same prevailing photoperiod. Despite multiple factors, our research shows important findings for the induction and flower development of the subjects under study, such as their reduction in the days to anthesis. This also highlights the development the flowers without abnormalities, after their removal from the chambers at a specific time once the flower induction had happened.
conclusIons
Experimental conditions in controlled environment 2 (with LED light) decrease the vegetative growth of Laelia anceps subsp. anceps plants with previous flowering. The flowering background has effects on vegetative growth and flower induction, being significantly higher the probability of flower induction in plants with previous flowering. The greenhouse environment promotes the highest percentage of flower induction, but the three evaluated environmental conditions have similar effects on flower development.
The reduction of the days to anthesis in any of the two controlled environments each, contributes to the establishment of a flowering program at specific dates for the studied species. Correlation analyzes show positive and negative associations according to the evaluated environments, which establishes bases for the selection of the vegetative architecture and the flower characteristics. Based on the need for compatible technologies with the environment, there is potential in the use of LEDs for flower induction
53SÁNCHEZ-VIDAÑA et al.
CRECIMIENTO, INDUCCIÓN Y DESARROLLO FLORAL DE Laelia anceps subesp. anceps (ORCHIDACEAE)
respecto a otras intensidades lumínicas, temperatu-ras y fotoperiodos.
AgRAdecImIentos
Los autores agradecen al Consejo Nacional de Ciencia y Tec-nología por la beca otorgada para los estudiuos de maestría de MRSV; así como al Fideicomiso 167304 del Colegio de Postgra-duados, por el financiamiento otorgado para la realización de la presente investigación.
lIteRAtuRA cItAdA
Amasino, R. M., and S. D. Michaels. 2010. The timing of flowering. Plant Physiol. 154: 516-520.
Amin, M. M. U., M. S. Mollah, S. A. Tania, M. R. Ahmad, and F. N. Khan. 2004. Performance study of six indigenous epiphytic monopodial orchids of Bangladesh. J. Biol. Sci. 4: 87-89.
Andrés, F., and G. Coupland. 2012. The genetic basis of flowe-ring responses to seasonal cues. Nat. Rev. Genet. 13: 627-639.
Barret, S. C. H. 2008. Major evolutionary transitions in flowe-ring plant production: An overview. Int. J. Plant Sci. 169: 1-5.
Bernier, G., and C. Périlleux. 2005. A physiological overview of the genetics of flowering time control. Plant Biotechnol. J. 3: 3-16
Blanchard, M. G., and E. S. Runkle. 2009. Use of a cyclic high-pressure sodium lamp to inhibit flowering of chrysanthe-mum and velvet sage. Sci. Hortic. 122: 448-454.
Cerdán, P. D., and J. Chory. 2003. Regulation of flowering time by light quality. Nature 423: 881-885.
Chin, D.-Ch., Ch.-H. Shen, R. SenthiKimar, and K. W. Yeh. 2014. Prolonged exposure to elevated temperature induces floral transition via up-regulation of cytosolic ascorbate pe-roxidase 1 and subsequent reduction of the ascorbate redox ratio in Oncidium hybrid orchid. Plant Cell Physiol. 55: 2164-2176.
Davenport, D., and Y. Kohanzadeh. 1982. Orchids, bilateral symmetry and insect perception. J. Theor. Biol. 94: 241-252.
Folta, K. M., and K. S. Childers. 2008. Light as a growth regula-tor: controlling plant biology with narrow-bandwidth solid-state lighting systems. HortSci 43: 1957-1964.
Hemming, S. 2011. Use of natural and artificial light in hor-ticulture - interaction of plant and technology. Acta Hort. 907: 25-35.
Heo, J. W., K. S. Shin, S. K. Kim, and K. Y. Paek. 2006. Light quality affects in vitro growth of grape ‘Teleki 5BB7’. J. Plant Biol. 49:276-280.
Jacquemyn, H., R. Brys, and E. Jongejans. 2010. Size-dependent flowering and costs of reproduction affect population dyna-mics in a tuberous perennial woodland orchid. J. Ecol. 98: 1204-1215.
Kindlmann, P., and Z. Balounová. 1999. Flowering regimes of terrestrial orchids: unpredictability or regularity? J. Veg. Sci. 10: 269-273.
Kindlmann, P., and Z. Balounová. 2001. Irregular flowering pat-terns in terrestrial orchids: theories vs. empirical data. Web Ecol. 2: 75-82.
Kobayashi, Y., and D. Weigel. 2007. Move on up, it’s time for change—mobile signals controlling photoperiod-dependent flowering. Genes Dev. 21: 2371-2384.
Krizek, D. T., R. W. Mirecki, S. J. Britz, W. G. Harris, and R. W. Thimijan. 1998. Spectral properties of microwave-powered sulfur lamps in comparison to sunlight and high pressure sodium/metal halide lamps. Biotronics 27: 69-80.
Lopez, R. G., and E. S. Runkle. 2005. Environmental physio-logy of growth and flowering of orchids. HortScience 40: 1969-1973.
Lopez, R. G., E. S. Runkle, R. D. Heins, and C. M. Whitman. 2003. Temperature and photoperiodic effects on growth and flowering of Zygopetalum redvale. Fire kiss. Orchids. Acta Hort. 624: 155-162.
Massa, G. D., H. H. Kim, R. M. Wheeler, and C. A. Mitchell. 2008. Plant productivity in response to LED lighting. HortScience 43: 1951-1956.
Moniruzzaman, M., M. A. Zaman, M. E. Hossan, M. M. H. Bhuiyan, and M. Z. Rahman. 2012. Genetic variability and character association in some native orchid species (Dendro-bium spp.). The Agriculturists 10: 1-9.
Morrow, R. C. 2008. LED lighting in horticulture. HortScience 43: 1947-1950.
Olle, M., and A. Viršilė. 2013. The effects of light-emiting dio-de lighting on greenhouse plant growth and quality. Agric. Food Sci. 22: 223-234.
Paradiso, R., and S. De Pascale. 2014. Effects of plant size, tem-perature, and light intensity on flowering of Phalaenopsis hy-brids in Mediterranean greenhouses. Sci. World J. 2014: 1-9.
Pfeifer, M., W. Heinrich, and G. Jetschke. 2006. Climate, size and flowering history determine flowering pattern of an or-chid. Bot. J. Linnean Soc. 151: 511-526.
Primack, R., and E. Stacy. 1998. Cost of reproduction in the Pink Lady’s slipper orchid (Cypripedium acaule, Orchida-ceae): an eleven-year experimental study of three popula-tions. Am. J. Bot. 85(12): 1672–1679.
Runkle, E. 2008. Principles of light. Understanding the basics to grow better orchids. Orchids 77: 350-353.
Runkle, E. S. 2010. Environmental and hormonal regulation of flowering in Phalaenopsis orchids: a mini review. Acta Hort. 878: 263-267.
SAS Institute, Inc. 2009. SAS/STAT User´s Guide. Ver. 9.3. SAS Institute, Inc. Cary, North Caroline, 8621 p.
Stancato, G. C., P. Mazzafera, and M. S. Buckeridge. 2002. Effects of light stress on the growth of the epiphytic orchid Cattleya forbesii Lindl. X Laelia tenebrosa Rolfe. Rev. Bras. Bot. 25: 229-235.
Da Silva, J. T. 2013. Orchids: Advances in tissue culture, gene-tics, phytochemistry and transgenic biotechnology. Floricult. Ornamental Biotech. 7: 1-52.
of the studied orchid species, but further research is needed on other luminous intensities, photoperiods and temperatures.
—End of the English version—
pppvPPP

AGROCIENCIA, 1 de enero - 15 de febrero, 2018
VOLUMEN 52, NÚMERO 154
Terfa, M. T., M. S. Poudel, A. G. Roro, H. R. Gislerød, J. E. Olsen, and S. Torre. 2012. Light emitting diodes with a high proportion of blue light affects external and internal quality parameters of pot roses differently than the traditional high pressure sodium lamp. Acta Hort. 956: 635-641.
Weigel, D., and O. Nilsson. 1995. A developmental switch suffi-cient for flower initiation in diverse plants. Nature 377: 495-500.
Whigham, D., and J. P. O’Neill. 1991. The dynamics of flowe-ring and fruit production in two eastern North American
terrestrial orchids, Tripularia discolor and Liparis lilifolia. In: Wells, T C. E., and J. H. Willems (eds). Population Ecology of Terrestrial Orchids. SPB Academic Publishing. The Ha-gue, The Netherlands. pp: 89-101.
Yamada, A., T. Tanigawa, T. Suyama, T. Matsuno, and T. Ku-nitake. 2008. Night break treatment using different light sources promotes or delays growth and flowering of Eustoma grandiflorum (Raf.) Shinn. J. Japan. Soc. Hort. 77: 69-74.
Yu, H., and C. J. Goh. 2000. Identification and characterization of three orchid MADS-Box genes of the AP1/AGL9 subfa-mily during floral transition. Plant Physiol. 123: 1325-1336.