acciones estrategicas para asegurar agua limpia y …€¦ · frontera 2020 reunion de...
TRANSCRIPT
FRONTERA 2020REUNION DE COORDINADORES NACIONALES
GRUPO DEL AGUA
ACCIONES ESTRATEGICASPARA
ASEGURAR AGUA LIMPIA Y SEGURA
EL PASO, TEXASSEPTIEMBRE 22, DE 2015
PRIORIDADES REGIONALES
• Impacto del cambio climático para la región
• Intercambio de información de recursos hídricos en la región
• Continuar explorardo el utilizar agua salobre de la región para proporcionar agua potable a las comunidades
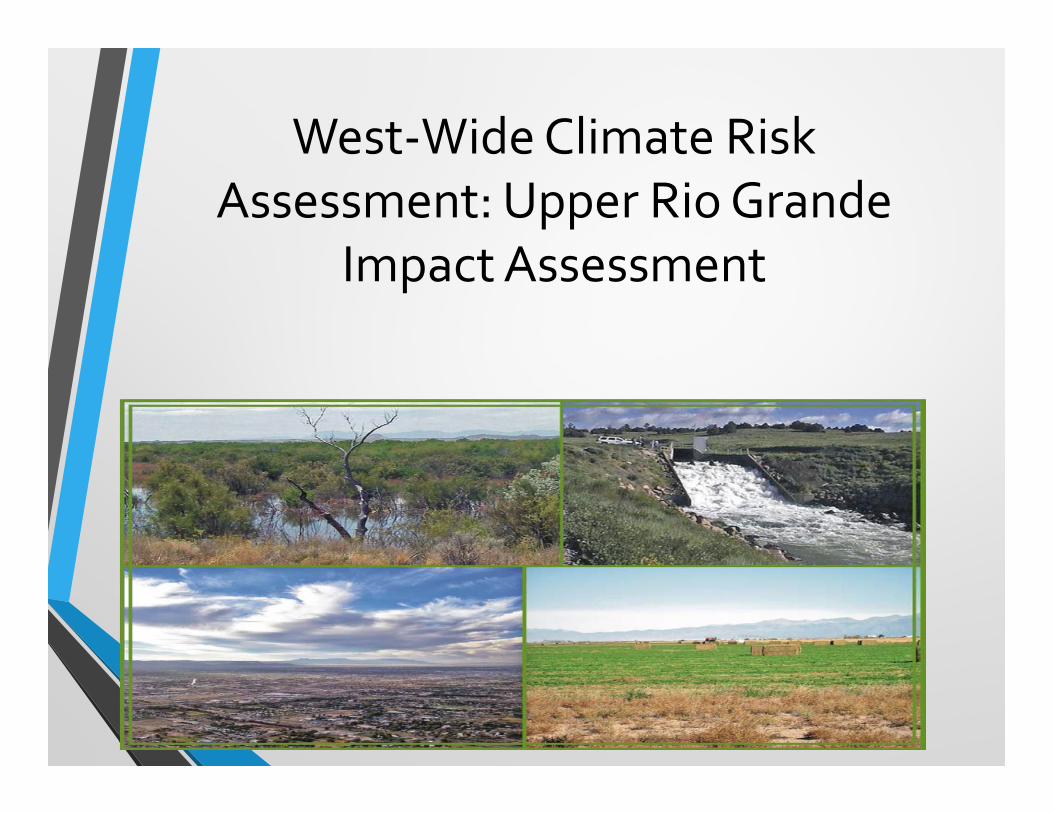
West‐Wide Climate Risk Assessment: Upper Rio Grande
Impact Assessment
• U.S. Department of the Interior
• Bureau of Reclamation ‐December 2013
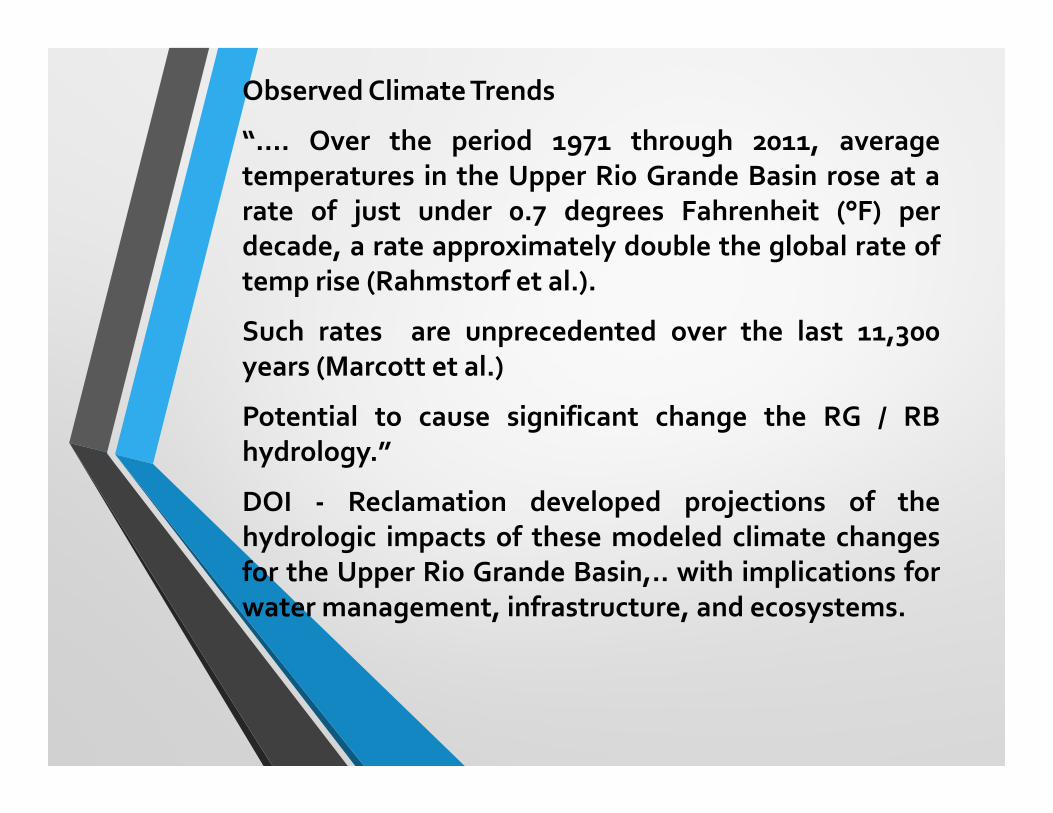
ObservedClimateTrends
“…. Over the period 1971 through 2011, averagetemperatures in the Upper Rio Grande Basin rose at arate of just under 0.7 degrees Fahrenheit (°F) perdecade, a rate approximately double the global rate oftemp rise (Rahmstorf et al.).
Such rates are unprecedented over the last 11,300years (Marcott et al.)
Potential to cause significant change the RG / RBhydrology.”
DOI ‐ Reclamation developed projections of thehydrologic impacts of these modeled climate changesfor the Upper Rio Grande Basin,.. with implications forwater management, infrastructure, and ecosystems.
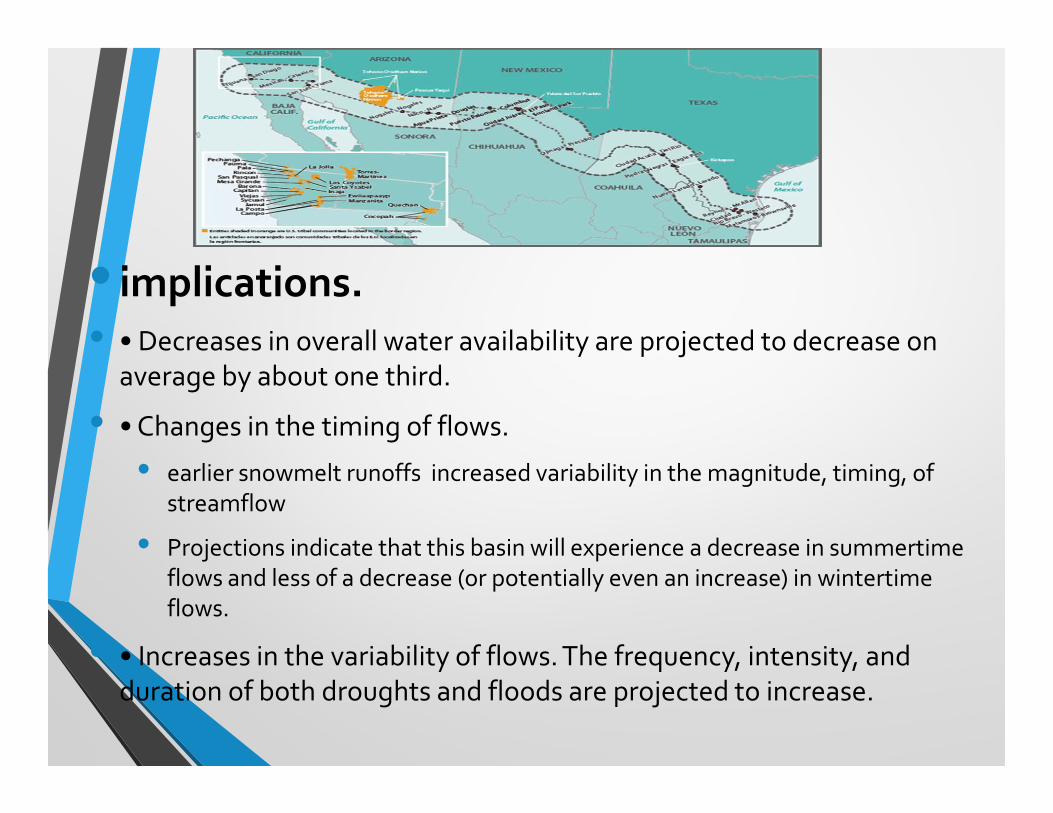
• implications.• • Decreases in overall water availability are projected to decrease on
average by about one third.
• • Changes in the timing of flows.
• earlier snowmelt runoffs increased variability in the magnitude, timing, of streamflow
• Projections indicate that this basin will experience a decrease in summertime flows and less of a decrease (or potentially even an increase) in wintertime flows.
• • Increases in the variability of flows. The frequency, intensity, and duration of both droughts and floods are projected to increase.
• Loss of winter snowpack, decrease water supply,
• Increases in temperature lead to increase in all demands ( agricultural, riparian, and urban landscaping)
• The decrease in water supply will increase demand; the gap between supply and demand will grow even if there are no decreases in average annual precipitation.
• The imbalance of supply and demand will lead to a greater reliance on groundwater resources. Increased reliance on groundwater resources will lead to greater losses from the river into the groundwater system. In summary increased variability and uncertainty.
Summary of Impacts‐ change hydrology + Water Management
Acciones Binacionales
• Reinicio del Grupo de Trabajo Paso del Norte
• Se volvió apoyar y reformalizar por los organismos operadores, el Acuerdo de Cooperación para el intercambio de información y trabajo conjuntos en una región donde utilizamos los mismos acuíferos
ACCIONES PRIORITARIAS PARA LOS SIGUIENTES 2 AÑOS
• PLANTA DE TRATAMIENTO DE PURIFICACIÓN –PLANTA BUSTAMANTE (REUTILIZACIÓN DE AGUAS RESIDUALES) BUSTAMANTE (EQUIVALENTE A CERRAR 10 POZOS, AMPLÍA VIDA DEL ACUÍFERO)
• SEGUIMIENTO DEL PLAN MAESTRO DE AGUA
• COMPLETAR EL 100% DE SANEAMIENTO DE AGUAS RESIDUALES
• CONSTRUCCION DE UNIDAD DE CO‐GENERACION EN PLANTA NORTE
• AMPLIAR RED DE LINEA MORADA
• BAJAR A 200 LTS/PERSONA/DIA EL CONSUMO
• IMPLEMENTAR LOS DIAS DE RIEGO DE JARDINES• POTABILIZADORA PARA AGUA DEL RIO BRAVO
META DE 100% DE SANEAMIENTO DE AGUAS RESIDUALES
• SE LOGRARA CON EL APOYO DE EPA, CNA, JMAS Y EL SECTOR PRIVADO
• YA CONTAMOS CON 5 PLANTAS MUNICIPALES
• APPROXIMADAMENTE EL 99% DE LAS AGUAS VERTIDAS AL RIO BRAVO SERAN SANEADAS
• LOS AGRICULTORES DEL VALLE RECIBEN YA AGUA DE MEJOR CALIDAD
ACTUALIZACION DEL PLAN MAESTRO
(FINANCIADO POR COCEF, USAID, Y LA JMAS)
• UTILIZAR AGUA DEL RIO BRAVO
• POSIBILIDAD DE TRATAMIENTO TERCIARIO PARA RE‐INYECTARLA AL ACUIFERO
• INCREMENTAR RUTAS DE AGUA MORADA
• BUSCAR NUEVAS ALTERNATIVAS PARA AHORRO DE ENERGIA
PROYECTO DE CO‐GENERACION
• SE INSTALA ACTUALMENTE EN LA PLANTA SUR
• SOLO HAY UNA PLANTA CON CO‐GENRACION EN MEXICO (ATOTONILCO)
• UTILIZARA GAS METANO PRODUCIDO POR LOS LODOS
• ES PARA AUTO‐CONSUMO UNICAMENTE (70% DEL CONSUMO)
• EL SIGUIENTE PASO ES UTILIZAR ENERGIA FOTOVOLTAICA
ACCIONES COMPLEMENTARIAS
• SE HA INCREMENTADO EL NUMERO DE KMS DE LINEA MORADA EN LA CIUDAD (100 KMS)
• SE HAN INICIADO HORARIOS DE RIEGO
• SE HAN IMPLEMENTADO PROGRAMAS DE CULTURA DEL AGUA
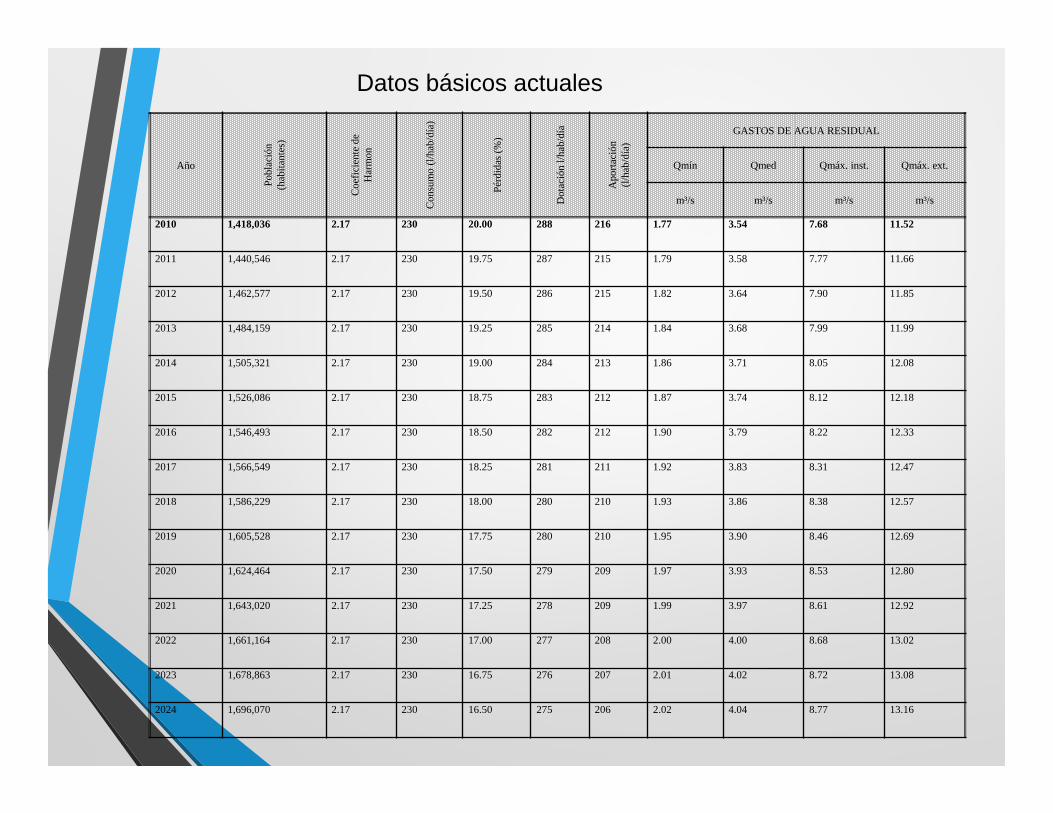
• SE SIGUE TRABAJANDO EN BAJAR EL CONSUMO A MENOS DE 200 LTS. POR HABITANTE/DIA, ACTUALMENTE ES DE 230
Año
Pobl
ació
n (h
abita
ntes
)
Coe
ficie
nte
de
Har
mon
Con
sum
o (l/
hab/
día)
Pérd
idas
(%)
Dot
ació
n l/h
ab/d
ía
Apo
rtaci
ón
(l/ha
b/dí
a)
GASTOS DE AGUA RESIDUAL
Qmín Qmed Qmáx. inst. Qmáx. ext.
m³/s m³/s m³/s m³/s
2010 1,418,036 2.17 230 20.00 288 216 1.77 3.54 7.68 11.52
2011 1,440,546 2.17 230 19.75 287 215 1.79 3.58 7.77 11.66
2012 1,462,577 2.17 230 19.50 286 215 1.82 3.64 7.90 11.85
2013 1,484,159 2.17 230 19.25 285 214 1.84 3.68 7.99 11.99
2014 1,505,321 2.17 230 19.00 284 213 1.86 3.71 8.05 12.08
2015 1,526,086 2.17 230 18.75 283 212 1.87 3.74 8.12 12.18
2016 1,546,493 2.17 230 18.50 282 212 1.90 3.79 8.22 12.33
2017 1,566,549 2.17 230 18.25 281 211 1.92 3.83 8.31 12.47
2018 1,586,229 2.17 230 18.00 280 210 1.93 3.86 8.38 12.57
2019 1,605,528 2.17 230 17.75 280 210 1.95 3.90 8.46 12.69
2020 1,624,464 2.17 230 17.50 279 209 1.97 3.93 8.53 12.80
2021 1,643,020 2.17 230 17.25 278 209 1.99 3.97 8.61 12.92
2022 1,661,164 2.17 230 17.00 277 208 2.00 4.00 8.68 13.02
2023 1,678,863 2.17 230 16.75 276 207 2.01 4.02 8.72 13.08
2024 1,696,070 2.17 230 16.50 275 206 2.02 4.04 8.77 13.16
Datos básicos actuales
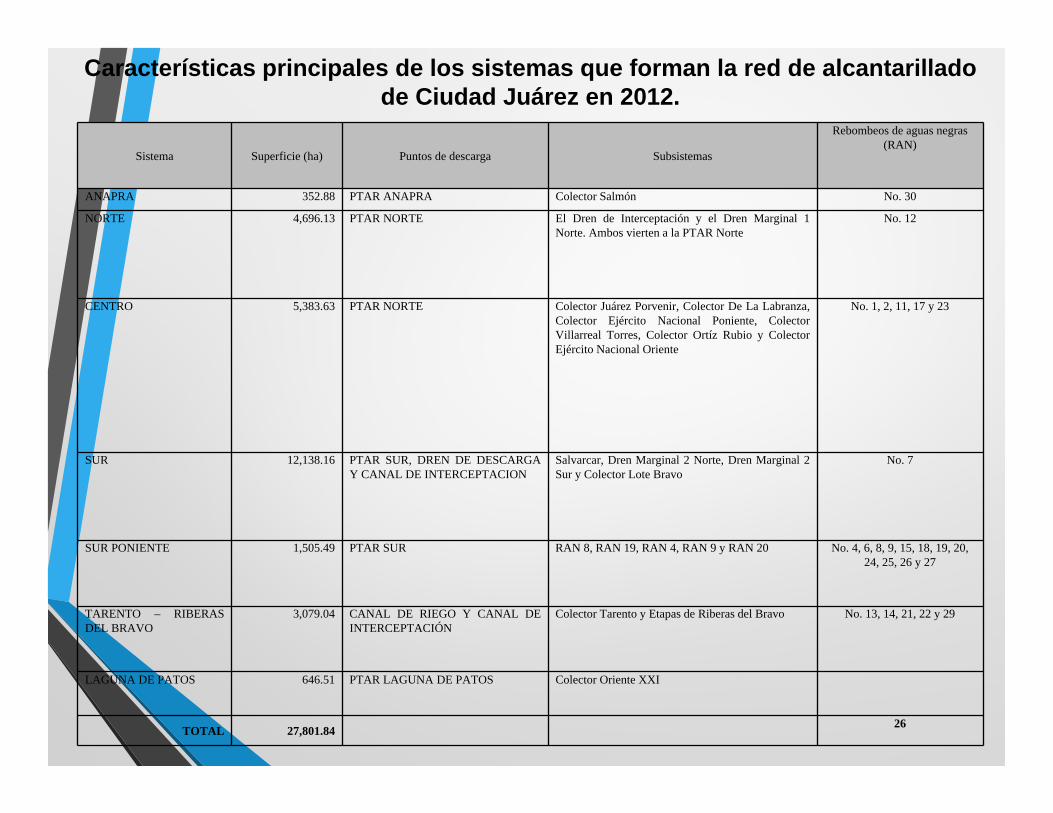
Sistema Superficie (ha) Puntos de descarga Subsistemas
Rebombeos de aguas negras (RAN)
ANAPRA 352.88 PTAR ANAPRA Colector Salmón No. 30
NORTE 4,696.13 PTAR NORTE El Dren de Interceptación y el Dren Marginal 1Norte. Ambos vierten a la PTAR Norte
No. 12
CENTRO 5,383.63 PTAR NORTE Colector Juárez Porvenir, Colector De La Labranza,Colector Ejército Nacional Poniente, ColectorVillarreal Torres, Colector Ortíz Rubio y ColectorEjército Nacional Oriente
No. 1, 2, 11, 17 y 23
SUR 12,138.16 PTAR SUR, DREN DE DESCARGAY CANAL DE INTERCEPTACION
Salvarcar, Dren Marginal 2 Norte, Dren Marginal 2Sur y Colector Lote Bravo
No. 7
SUR PONIENTE 1,505.49 PTAR SUR RAN 8, RAN 19, RAN 4, RAN 9 y RAN 20 No. 4, 6, 8, 9, 15, 18, 19, 20, 24, 25, 26 y 27
TARENTO – RIBERASDEL BRAVO
3,079.04 CANAL DE RIEGO Y CANAL DEINTERCEPTACIÓN
Colector Tarento y Etapas de Riberas del Bravo No. 13, 14, 21, 22 y 29
LAGUNA DE PATOS 646.51 PTAR LAGUNA DE PATOS Colector Oriente XXI
TOTAL 27,801.84 26
Características principales de los sistemas que forman la red de alcantarillado de Ciudad Juárez en 2012.
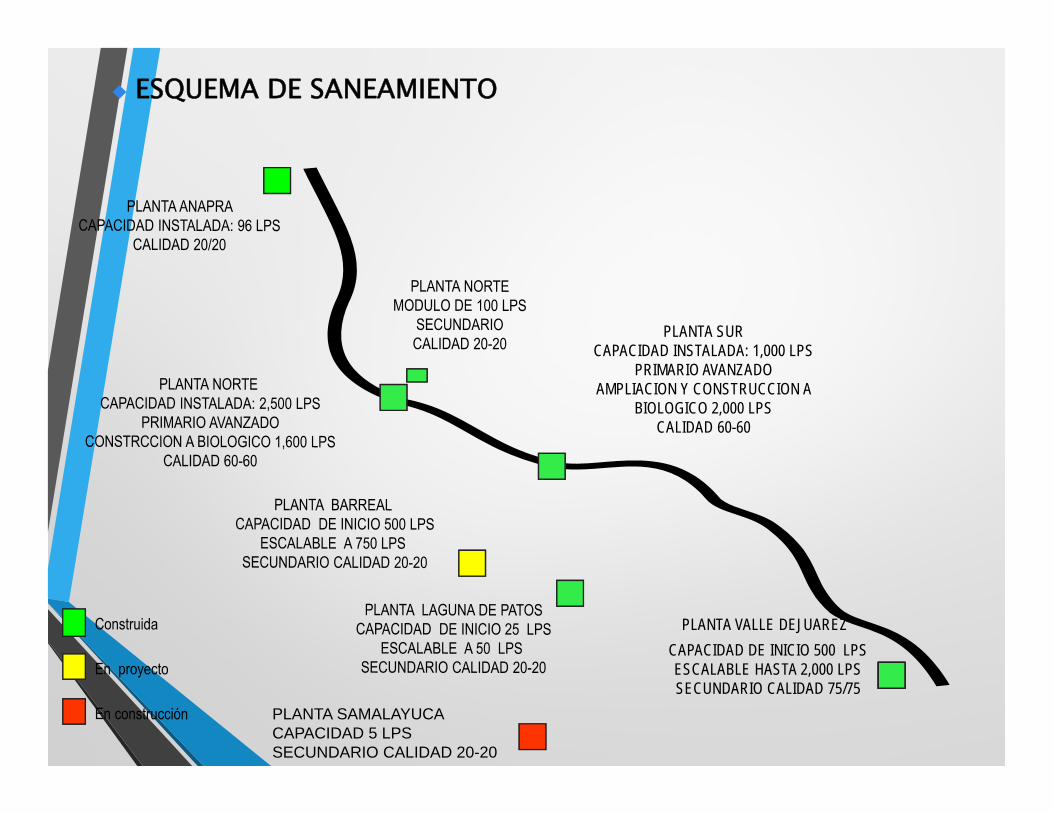
PLANTA SUR CAPACIDAD INSTALADA: 1,000 LPS
PRIMARIO AVANZADOAMPLIACION Y CONSTRUCCION A
BIOLOGICO 2,000 LPSCALIDAD 60-60
CAPACIDAD DE INICIO 500 LPSESCALABLE HASTA 2,000 LPSSECUNDARIO CALIDAD 75/75
ESQUEMA DE SANEAMIENTO
PLANTA VALLE DEJUAREZ
PLANTA SAMALAYUCACAPACIDAD 5 LPSSECUNDARIO CALIDAD 20-20
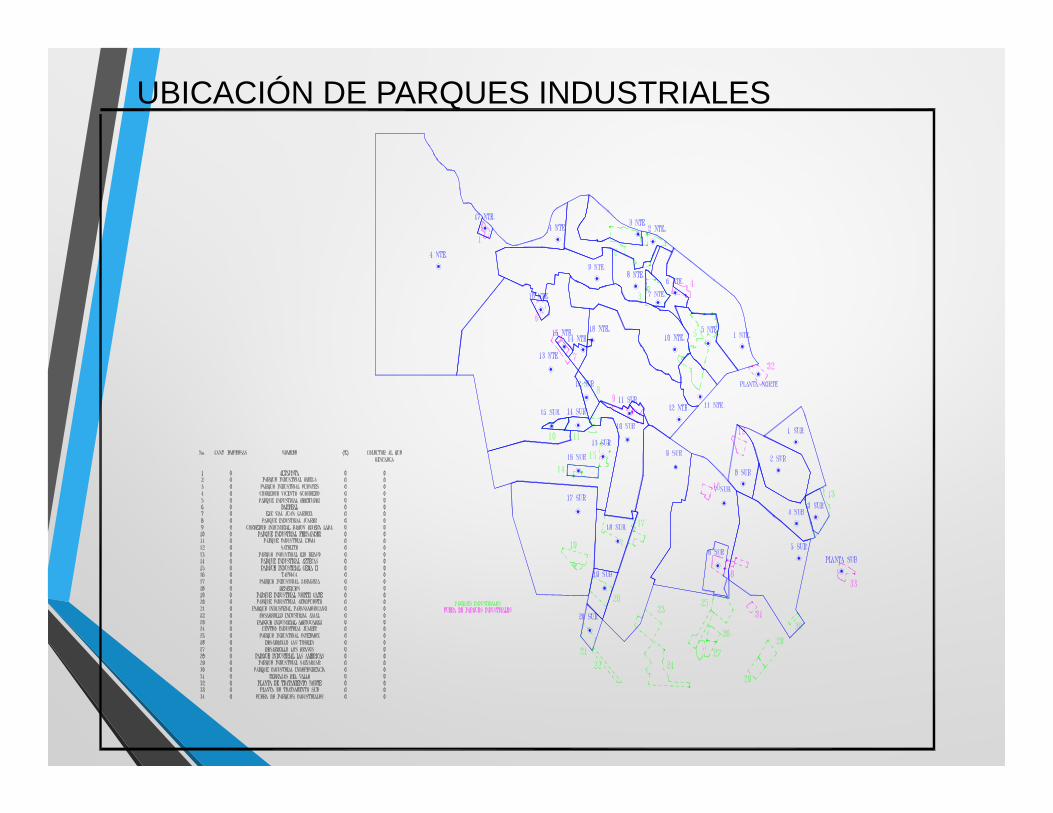
UBICACIÓN DE PARQUES INDUSTRIALES