a multivariate bernstein copula model for permeability ... · conjunta de propiedades petrofísicas...
TRANSCRIPT
GEOFÍSICA INTERNACIONAL (2014) 53-2: 163-181
Resumen
En este trabajo se presenta un método no paramétrico general de simulación estocástica conjunta de propiedades petrofísicas utilizando la cópula Bernstein. Este método consiste básicamente generar simulaciones estocásticas de una determinada propiedad petrofísica (variable primaria) modelando la dependencia empírica subyacente con otras propiedades petrofísicas (variables secundarias), mientras también es reproducida la dependencia espacial de la primera.Este enfoque multivariado provee una herramienta
laciones de dependencia de las propiedades petrofísicas. Tiene varias ventajas sobre otros métodos tradicionales, ya que no se limita al caso de la dependencia lineal entre las variables, y tampoco requiere de la suposición de normalidad
En este trabajo este método es aplicado para
porosidad vugular y velocidad de onda de corte (Ondas S) como covariables, en una formación carbonatada de doble porosidad a escala de pozo. Los valores simulados de la permeabilidad muestran un alto grado de precisión en comparación con los valores reales.
Palabras clave: permeabilidad, porosidad, velocidad de onda de corte, dependencia multivariada, cópula de Bernstein, simulación geoestadística.
Abstract
This paper introduces a general nonparametric method for joint stochastic simulation of petrophysical properties using the Bernstein copula. This method consists basically in generating stochastic simulations of a given petrophysical property (primary variable) modeling the underlying empirical dependence with other petrophysical properties (secondary variables) while reproducing the spatial
This multivariate approach provides a very
relationships of petrophysical properties. It has several advantages over other traditional methods, since it is not restricted to the case of linear dependence among variables, it does not require the assumption of normality and/or
In this paper this method is applied to simulate rock permeability using Vugular Porosity and
log scale. Simulated permeability values show a high degree of accuracy compared to the actual values.
Key words: permeability, porosity, shear wave velocity, multivariate dependence, Bernstein copula, geostatistical simulation.
163
A multivariate Bernstein copula model for permeability stochastic simulation
*
*
Eje Central Lázaro Cárdenas 152
*Corresponding autor
ORIGINAL PAPER
*
VOLUME 53 NUMBER 2
Introduction
most accepted way to obtain the spatial distribution of petrophysical properties in
common task performed in this method is the estimation of permeability, because it is well known that this petrophysical property is quite
information about permeability, and therefore
with another petrophysical property (such as porosity, water saturation, etc.) in order to
et al., 1996).
The linear regression approach is the most common way to model permeability values using other petrophysical properties as covariates (Balan et al., 1995). To meet the requirement of linearity it is common to perform transformations which imply that the
transformed; there are approaches that, in
transformations to induce this behavior, for
necessary to have a linear relationship since it requires the linear corregionalization model
The main disadvantage of linear dependency models is their lack of ability to capture and
Harthy et al. 2005). In other words, traditional
of data, in terms of variance or standard deviation; hence, the predicted permeability
data. In other words, these approaches will not be able to represent impermeable barriers or
point of view this aspects are the most important characteristics that determine the patterns of
its oversmoothing nature.
model permeability. However, neural networks have some disadvantages too. First, the training process has to be done with caution and can be a lengthy process. The good results obtained by this technique are reached using a comprehensive training data set, which is not
always available. On the other hand, failing in correctly calibrating the network may result
consideration is that the methodology is not yet an “off the shelf” application and requires
2001).
however, the traditional framework of the Bayesian analysis is based on the multivariate normal distribution where the lower and upper
et alproposed an alternative Bayesian analysis that
joint distribution does not have to be normal
type of copula.
Constructing numerical models of the reservoir that honor all available data (core measurements, well logs, seismic and geological interpretations, etc.) having sparse knowledge of rock properties, leads us to consider the
1992). This is not a new concept (Haldorsen
1990), stochastic models of physical systems
Stochastic simulation is the process of building alternate, equally probable models of the spatial distribution of a random function. It is said that a simulation is conditional if the resulting realizations honor the raw data values at their locations. The most straightforward algorithms for generating realizations of a
Sequential Gaussian Simulation (SGS) and Sequential Indicator Simulation (SIS), which
simulations (Holden et al. 1995). However despite of their improvements (Journel and
are limited to cases when the spatial continuity
for predicting permeability may be achieved by applying stochastic joint simulations, in which
between petrophysical properties is crucial
of an annealing geostatistical cosimulation of
joint distribution.
GEOFÍSICA INTERNACIONAL
APRIL - JUNE 2014 165
González, (2005). Here, it was proposed the
joint distribution function between porosity and permeability rather than use the joint distribution function of the sample data, the
was applied to simulate permeability from the
et al. 2006).
proposal can reproduce adequately the
applied copula is parametric, and consequently, it is based on a given distribution function,
single copula family to be able to model any kind of dependency relationship seems to be too restrictive, at least for the petrophysical properties under consideration. It does not mean that parametric copulas have not practical use. It means that petrophysical properties modeling, where dependence
parametric copulas could be available but in a very complicated form, Sancetta and Satchell
The copula approach has been successfully used to model dependence patterns in few
et al. 2005).
In a recent work we use the copula approach to model the bivariate dependence between petrophysical properties in a
et al. 2012), it means we did not impose a priori a parametric joint distribution function to characterize the dependence structure of the sample; instead, we used a bivariate Bernstein copula function to model the intrinsic distribution of data values. In this work we introduce a multivariate method for estimating empirical dependence among several petrophysical properties using a nonparametric copula. The dependency model obtained is then used to stochastically simulate one property (primary variable) given other ones (secondary variables). Here, we apply a method widely used in geostatistics,
global optimization framework where we can add restrictions to simulation. In this case, in addition of using multivariate dependence by sampling the empirical copula model, a spatial correlation function (a variogram) for the
if any raw data of the primary variable is
the method can be conditional.
In this paper this method is applied to simulate rock permeability using a trivariate copula model where permeability is described by Vugular Porosity and Shear Wave Velocity. It is introduced a two stage simulation method in a multivariate fashion to model stochastically the spatial distribution of permeability at well log scale. Conditional and nonconditional simulations, and the median of simulations are performed in order to show the results that this method provides; also it is established that, as far as more descriptive variables integrate the Bernstein copula it will reproduce permeability values in a very precise form, consequently it will not be necessary to perform many simulations to reduce small scale variability.
Brief introduction to multivariate copulas
The main disadvantage of dependency models based on a linear regression approach is their lack of ability to capture and model
alternative a copula can model the joint distribution of petrophysical properties in better ways. The essence of the copula approach is that a joint distribution of random variables
et al., 2005).
1959), the underlying copula associated to a multivariate random vector (X
1, X
2, ..., X
m)
represents a functional link between the joint probability distribution and the univariate marginal distributions F
1, F
2, ..., F
M respectively:
H(x1, x
2, ..., x
m) = C(F
1(x
1), F
2(x
2), ..., F
m(x
m))
(1)
For all x1, x
2, ..., x
mnumbers system, where C:[0, 1]m [0, 1] the underlying copula is unique whenever X1, X
2, and X
m are continuous random variables.
Therefore, all the information about the
riables is contained in their corresponding copula. Several properties may be derived for copulas (Nelsen, 2006), and among them
*
166 VOLUME 53 NUMBER 2
theorem: X1, X
2 and X
m are independent
continuous random variables if and only if their underlying copula is C(u
1,...,u
n)=u,...,u
n.
Let S={(x11
, x21
, ... xm1
), ..., (x1n
, x2n
, ... xmn
)} be n observations of a random vector (X
1, X
2, ...,
Xm). We may obtain empirical estimates for the
marginal distributions X1, X
2, ..., X
m by means
of:
( )
nx xj jk
k
n
= £{ }=
11
1 (2)
where stands for an indicator function which takes value whenever its argument is true, and
that the empirical distribution Fj is a consistent estimator of F
j that is, F
j that is Fj(t) is a
converges almost surely to Fj(t) as n all t.
Similarly, we have the empirical copula C
n with domain 1
0 1ni n
m
: , ,...,= (where n is the sample size)
C vn
vn n
rank x v rank x vnm
k mk mk
n
( ,..., ) ( ) ,...,11 1
1
11= £ ( ) £{ }
= (3)
and its convergence to the true copula has also been proved (Fermanian et alThe empirical copula is not a copula, since it is
unit hypercube [0, 1]n
(Sklar, 1959) Cn
a joint distribution function can be constructed using the copula function. The copula separates the marginal distributions from correlation and the copula itself can capture the dependence structure. This is an essential property of copulas.
model that describes the relationship of three random variables (a trivariate copula)
H(x1, x
2, x
3) = C(F
1(x
1), F
2(x
2), F
3(x
3))
There are different classes and families of copulas but, for this study, we will work with the Bernstein copula, which is a nonparametric copula since it is a nonparametric smoothing based on the empirical copula.
Joint stochastic simulation method using a multivariate Bernstein copula
The method presented here basically consists in generating a stochastic simulation of a primary variable, where the joint distribution function of its covariates is modeled using a nonparametric copula. In other words, the spatial dependence and dependence pattern between variables are decoupled; in this
the dependence between variables and the spatial dependence is modeled by a variogram
relationship between petrophysical properties under study; and second, the spatial structure.
structure of petrophysical properties using a multivariate nonparametric copula (the Bernstein copula), then a geostatistical simulation of primary variable is performed using simulated annealing technique, whose objective function is the variogram model
description of each step of the algorithm will be described.
Multivariate Bernstein Copula Modeling.
Each petrophysical property is modeled as an absolutely continuous random variable X with unknown marginal distribution function F. For simulation of continuous random variables, the use of the empirical distribution function (2) is not appropriate since Fj is a step function, and therefore discontinuous, so a smoothing technique is needed. Since our main goal is to simulate a primary variable using more than one descriptive variable, it will be better to have a smooth estimation of the marginal quantile function Q(u) = F-1(u) = inf{x:F(x u u which is possible by means of Bernstein
Palacín (1987).
�Q u x xnku un k kk n k
k
n
( ) = +( ) -( )+-
=
1
211
0
(5)
For a smooth estimation of the underlying copula we make use of the Bernstein copula
�C u u vn
vn
P uB mv
nm
mv m
vm1
0
1
1
1 1 1
1
1
,..., ... ,..., ,( ) = ( )= =
α00
n
vm nm m
m
P u( )... ,
(6)
GEOFÍSICA INTERNACIONAL
APRIL - JUNE 2014 167
where;
P unvu uv m j
j
jjv
jn v
j j
j j j, ( ) ( )= - -
1 (7)
For every (u1, ..., u
m) in the unit hypercube
[0, 1]m, and α vn
vnm
m
1
1
,..., is the empirical
model derived from (6) is:
�C u v w C injnkn
niu uB n
k
n
j
n
i
ni n
, , , ,( ) = -( )=== 000
1-- i
- --( ) -( )j n j k n knjv v
nkw w1 1
(8)Sampling algorithm of a Bernstein copula
model
For a pair of random variables (X1, X
2) with
joint distribution function H and underlying copula C we need to generate an observation of uniform (0, 1) random variables (U, V) whose joint distribution function is C and then transform those uniform variables as in step 3 of the sampling bivariate algorithm. For generating such pair (u, v) it is used a conditional distribution method, this method needs the conditional distribution function for V given U = u, which we denote as c
u (v):
c v C u v
uuB( )( , )
=�
(9)
where is the bivariate Bernstein copula model, obtained by (6).
To simulate replications from the random vector with the dependence structure estimated from the observed data S:={(x
11, x
21), ..., (x
1n,
x2n
)} it is applied the following algorithm:
Sampling bivariate algorithm:
1.Generate two independent and continuous Uniform (0,1) random variates u and t
2.Set v = cu-1 (t); where c
u
3.The desired pair is ( , ) ( ( ), ( ))x x Q u R vn n1 2 where Qn and Rn according to (5), are the estimated and smoothed quantile functions X
1
of X2 and, respectively.
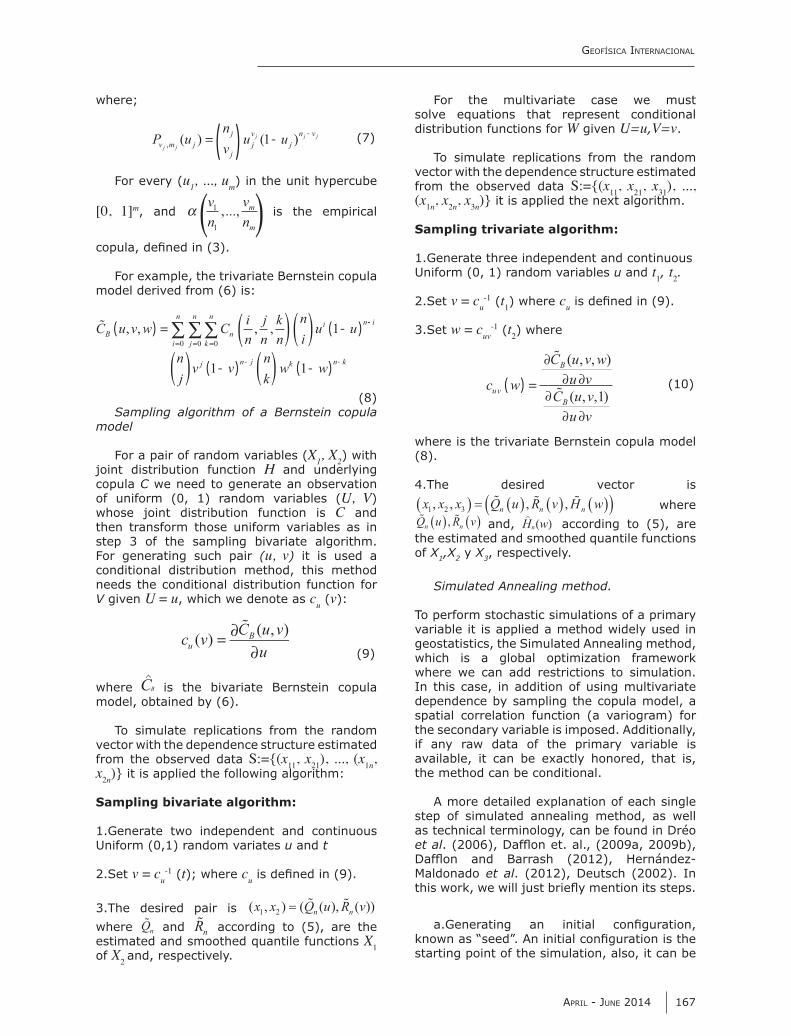
For the multivariate case we must solve equations that represent conditional distribution functions for W given U=u,V=v.
To simulate replications from the random vector with the dependence structure estimated from the observed data S:={(x
11, x
21, x
31), ...,
(x1n
, x2n
, x3n
)}
Sampling trivariate algorithm:
1.Generate three independent and continuous Uniform (0, 1) random variables u and t
1, t
2.
2.Set v = cu-1 (t
1) where c
u
3.Set w = cuv
-1 (t2) where
c w
C u v wu v
C u vu v
uv
B
B
( ) =
�
�
( , , )
( , , )1 (10)
where is the trivariate Bernstein copula model (8).
x x x Q u R v H wn n n1 2 3, , , ,( ) = ( ) ( ) ( )( ) where Q u R vn n( ) ( ), and, according to (5), are the estimated and smoothed quantile functions of X1,X2 y X3, respectively.
Simulated Annealing method.
To perform stochastic simulations of a primary variable it is applied a method widely used in
which is a global optimization framework where we can add restrictions to simulation. In this case, in addition of using multivariate dependence by sampling the copula model, a spatial correlation function (a variogram) for
if any raw data of the primary variable is
the method can be conditional.
step of simulated annealing method, as well
et al
et al
starting point of the simulation, also, it can be

*
168 VOLUME 53 NUMBER 2
considered as a “possible solution” of the spatial disposition of the primary variable. There are
of most popular of them is just proposing random numbers with uniform distribution. We decided to use the multivariate Bernstein copula sampling algorithm (section 3.1.1) to obtain this starting point in order to have a
we use the Bernstein copula we do not have to include univariate histograms into the objective function because they are reproduced automatically; in the same way, as Bernstein copula models the dependence structure between variables, it is not necessary
other words, in order to satisfy the spatial distribution of the primary variable, we are able to propose an objective function that consists only in one term (11) the variogram function
FO h hh
i i
ii=
−∑ [ ( ) ( )]
( )
*γ γγ
2
2 (11)
Where:
γ ( )( )
[ ( ) ( )]( )
hN h
Z x h Z xi ii
N h
= + −=∑1
2
2
1
(12)
T E
log0
0
= -( ) (13)
By (12), it is calculated the variogram of the
value is the energy of the starting point, and the main idea is that it must be decreased
(2002). This step gives us an idea of the seed´s quality, if we use random numbers to generate it, its measured energy will be very high, however, as long as this method uses a sample given by the Bernstein copula the initial
d.Obtaining the initial temperature and the annealing schedule. The initial temperature is obtained by (13):
The annealing schedule is obtained following
e.Ending up a realization. The simulation ends whenever the objective function error is reached, or an accumulation of 3 stages
number of attempted perturbations is reached.
It is shown a diagram of the method to perform multivariate stochastic simulations in, Figure1.
Case study
It will be modeled the Permeability of double porosity carbonate formations of a South
of Palm Beach County, Florida. Based in the algorithm described in Section 3, we propose
relationship between permeability, porosity
dependency model obtained will be then used to stochastically simulate permeability using Porosity and Shear Wave velocity.
Data description
The characterization of this aquifer for the et
al. (2001), Parra and Hackert (2002), and a hydrogeological situation is described by Bennett et al. (2002). The interpretation
Figure 1. perform multivariate stochastic simulations using
multivariate Bernstein copula.
GEOFÍSICA INTERNACIONAL
APRIL - JUNE 2014 169
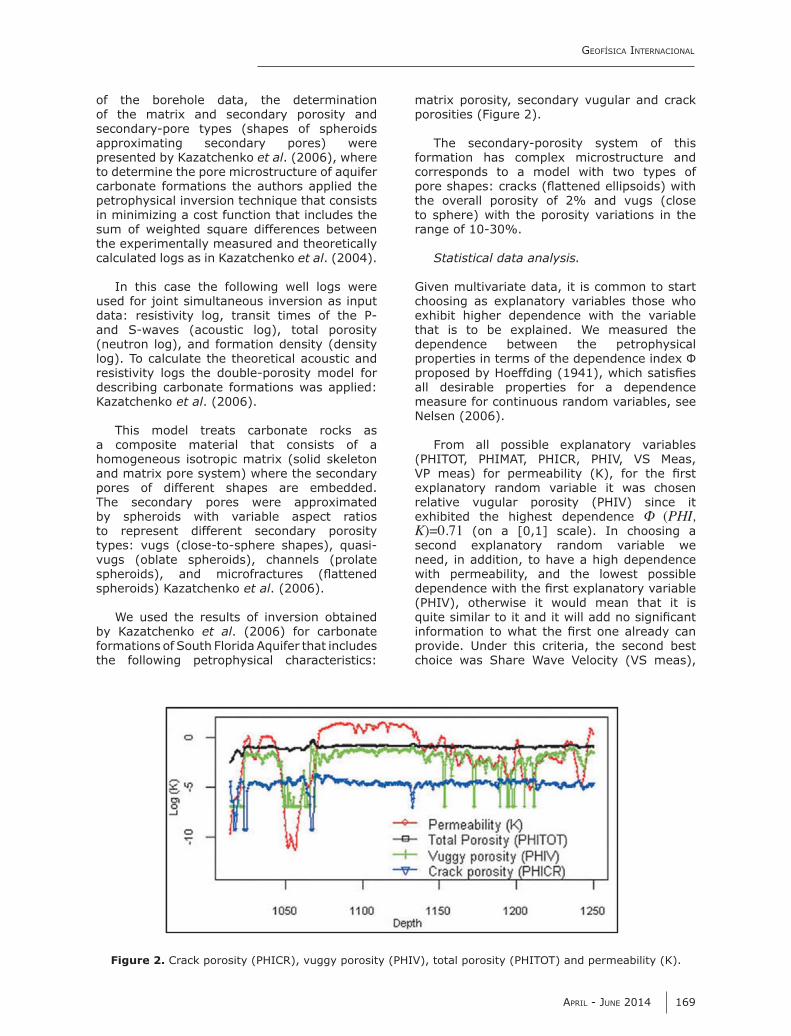
Figure 2. Crack porosity (PHICR), vuggy porosity (PHIV), total porosity (PHITOT) and permeability (K).
of the borehole data, the determination
presented by Kazatchenko et al. (2006), where to determine the pore microstructure of aquifer carbonate formations the authors applied the petrophysical inversion technique that consists in minimizing a cost function that includes the sum of weighted square differences between
calculated logs as in Kazatchenko et al
In this case the following well logs were used for joint simultaneous inversion as input
(neutron log), and formation density (density log). To calculate the theoretical acoustic and
describing carbonate formations was applied: Kazatchenko et al. (2006).
This model treats carbonate rocks as a composite material that consists of a
pores of different shapes are embedded.
by spheroids with variable aspect ratios to represent different secondary porosity
vugs (oblate spheroids), channels (prolate
spheroids) Kazatchenko et al. (2006).
We used the results of inversion obtained by Kazatchenko et al. (2006) for carbonate
the following petrophysical characteristics:
porosities (Figure 2).
corresponds to a model with two types of
the overall porosity of 2% and vugs (close to sphere) with the porosity variations in the
Statistical data analysis.
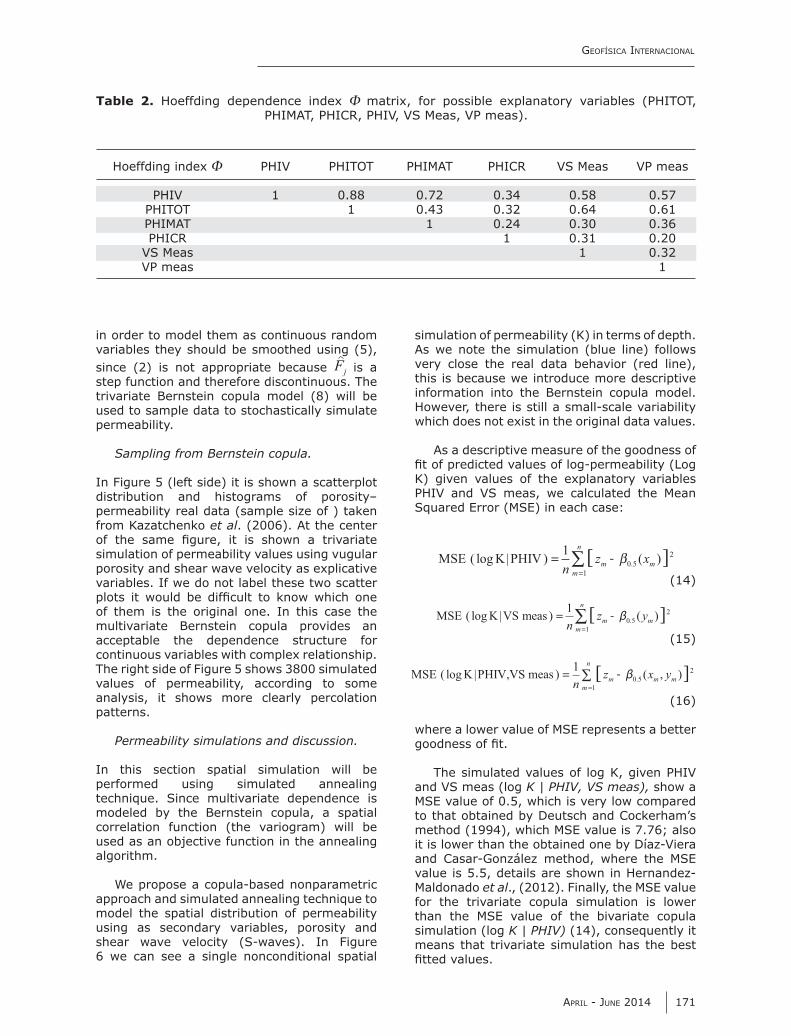
Given multivariate data, it is common to start
dependence between the petrophysical
all desirable properties for a dependence measure for continuous random variables, see Nelsen (2006).
relative vugular porosity (PHIV) since it (PHI,
K)=0.71 (on a [0,1] scale). In choosing a
need, in addition, to have a high dependence with permeability, and the lowest possible
(PHIV), otherwise it would mean that it is
provide. Under this criteria, the second best choice was Share Wave Velocity (VS meas),

*
170 VOLUME 53 NUMBER 2
Figure 3. Scatter plot distribution and histograms of PHIV and K of real
data values.
data taken from Kazatchenko et al. (2006), it shows their bivariate distribution. In Figure
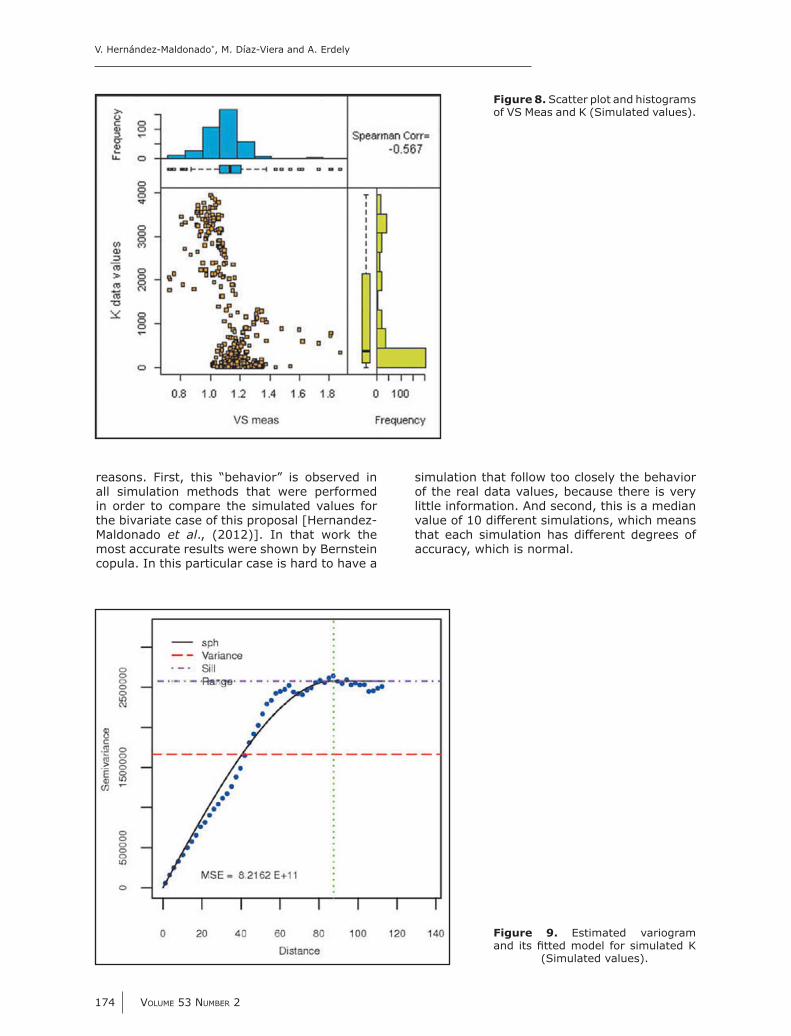
histograms of VS meas–K data values
Bernstein Copula Model.
It is modeled the trivariate Bernstein Copula using relative vugular porosities (PHIV), Shear
measured) and K as absolutely continuous random variables X
1, X
2 and X
3, with unknown
theoretical univariate distribution functions F1,
F2 and F
3, see (2). Observations of this random
vector were obtained from Kazatchenko et al. (2006).
We use (2) to estimate the empirical distribution function for each variable; however;
Table 1. with (VS meas, K) = 0.60 and (PHIV, VS meas) = 0.55
of
of inversion obtained by Kazatchenko et al
Vugular porosity (PHIV), Share Wave Velocity
has the highest dependence, but following the order of this table we should use as second
this choice because, as we said before, a second
dependence with permeability, and the lowest
variable (PHIV). To see this behavior in table
variable; it means we must pay attention to the
the lowest dependence to PHIV. It should be PHICR but in Table 1 we see that this property offers poor information about K. Finally, we
in some better way (Table 1).
distribution and histograms of PHIV–K sample
vs. K
PHIV 0.71 PHITOT 0.62
VP meas 0.55 PHICR 0.16
GEOFÍSICA INTERNACIONAL
APRIL - JUNE 2014 171
Table 2.
in order to model them as continuous random variables they should be smoothed using (5), since (2) is not appropriate because Fj is a step function and therefore discontinuous. The trivariate Bernstein copula model (8) will be used to sample data to stochastically simulate permeability.
Sampling from Bernstein copula.
In Figure 5 (left side) it is shown a scatterplot distribution and histograms of porosity–permeability real data (sample size of ) taken from Kazatchenko et al
simulation of permeability values using vugular
variables. If we do not label these two scatter
of them is the original one. In this case the multivariate Bernstein copula provides an acceptable the dependence structure for
The right side of Figure 5 shows 3800 simulated values of permeability, according to some analysis, it shows more clearly percolation patterns.
Permeability simulations and discussion.
In this section spatial simulation will be performed using simulated annealing technique. Since multivariate dependence is modeled by the Bernstein copula, a spatial correlation function (the variogram) will be used as an objective function in the annealing algorithm.
approach and simulated annealing technique to model the spatial distribution of permeability using as secondary variables, porosity and
6 we can see a single nonconditional spatial
simulation of permeability (K) in terms of depth.
very close the real data behavior (red line), this is because we introduce more descriptive information into the Bernstein copula model.
MSE K PHIV( log | ) ( )[ ].= -=
1
1
0 5
2
nz x
m
n
m mβ
MSE K VS meas( log | ) ( )[ ].= -=
1
1
0 5
2
nz y
m
n
m mβ
(15)
MSE K PHIV,VS meas( log | ) ( , )[ ].= -=
1
1
0 5
2
nz x y
m
n
m m mβ
(16)
The simulated values of log K, given PHIV and VS meas (log K | PHIV, VS meas), show a
et alfor the trivariate copula simulation is lower
simulation (log K | PHIV)means that trivariate simulation has the best
PHICR 1 0.31 0.20
VP meas 1

*
172 VOLUME 53 NUMBER 2
In terms of histograms, scatterplots and variograms, the proposed method shows very good agreement with the original data values.
scatterplots of the original data values are
The variogram of the simulation (Figure
good agreement with respect to real data (Figure 10). We can note that both variograms are almost equal, but in a detailed view, the empirical variogram of the simulated values is a little softer than the original one.
structure between these three petrophysical
values, and in general, all of most important statistics are quite well reproduced, (Figure
seen in Figure 6, a median of 10 nonconditional
again, the spatial structure, the histograms
good agreement respecting to real data, see
In Figure 12 we can see that for small values of K the simulation is not following real data values too closely, there are two
Figure 4. Scatter plot distribution and histograms of PHIV and K of real
data values.
Figure 5. Scatter plot between Porosity and Permeability. Left, the 380 data values. Center, 380 simulated values using trivariate Bernstein copula. Right, 3800 simulated values.

GEOFÍSICA INTERNACIONAL
APRIL - JUNE 2014 173
Table 3.
Figure 6. Single nonconditional simulation of permeability (K), using porosity and shear wave velocity (VS meas) as secondary variables.
Figure 7. Scatter plot and histograms of PHIV and K (Simulated values).
*
VOLUME 53 NUMBER 2
reasons. First, this “behavior” is observed in all simulation methods that were performed in order to compare the simulated values for
et al., (2012)]. In that work the most accurate results were shown by Bernstein copula. In this particular case is hard to have a
simulation that follow too closely the behavior of the real data values, because there is very
value of 10 different simulations, which means that each simulation has different degrees of accuracy, which is normal.
Figure 8. Scatter plot and histograms
Figure 9. Estimated variogram
(Simulated values).

GEOFÍSICA INTERNACIONAL
APRIL - JUNE 2014 175
Figure 10. Estimated variogram and
values).
Figure 11. Statistical comparison of to the original data and a single
Figure 12. of 10 nonconditional simulation of permeability (K), using porosity and shear wave
secondary variables.
*
176 VOLUME 53 NUMBER 2
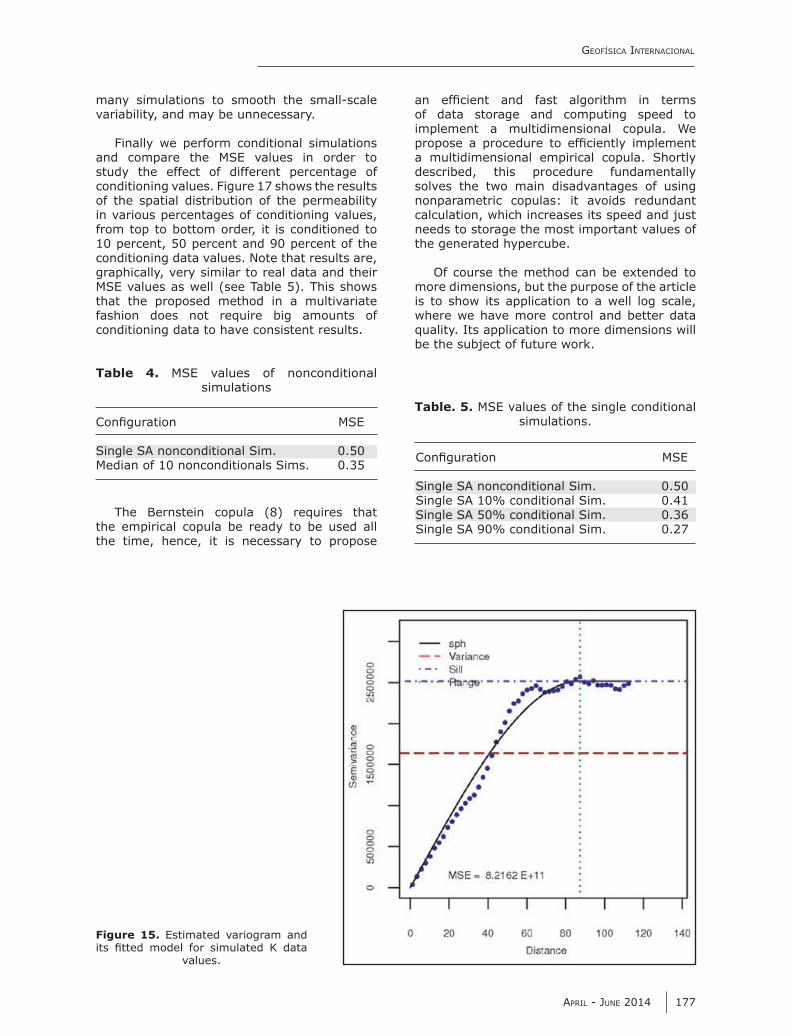
Figure 15 shows the variogram of this
Figure 10 (real data values) we can see that this method represents very well, the spatial structure of permeability.
The values of the variogram model for a single simulation and the median of 10
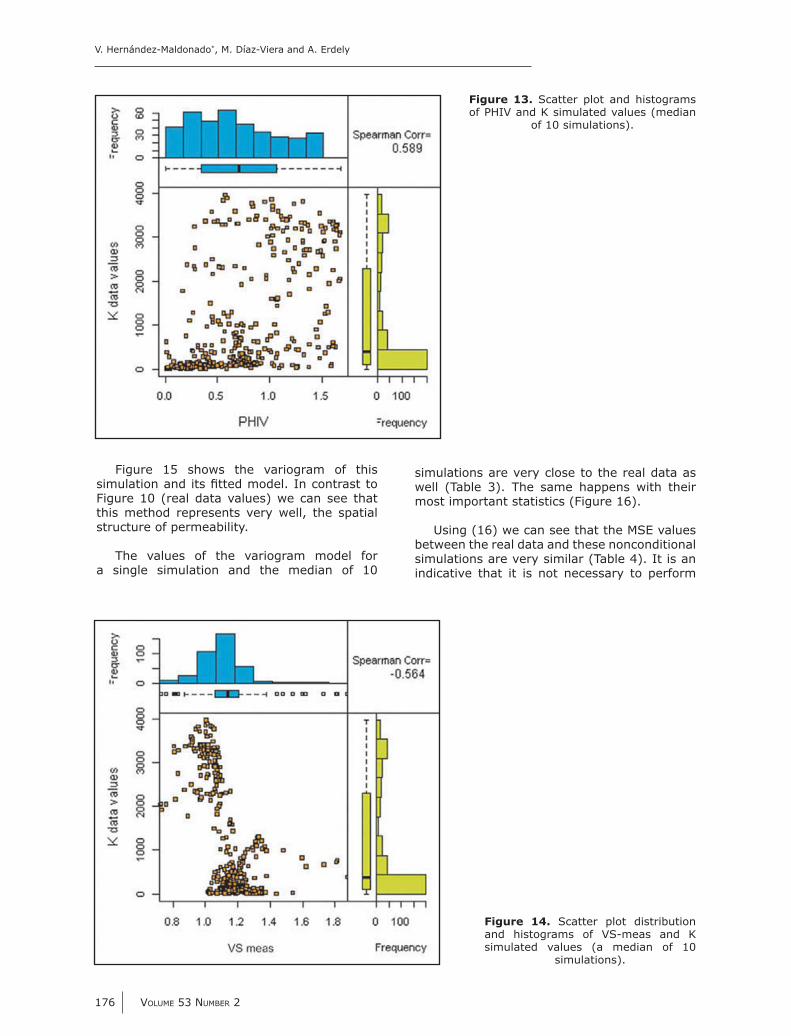
Figure 13. Scatter plot and histograms of PHIV and K simulated values (median
of 10 simulations).
Figure 14. Scatter plot distribution
simulated values (a median of 10 simulations).
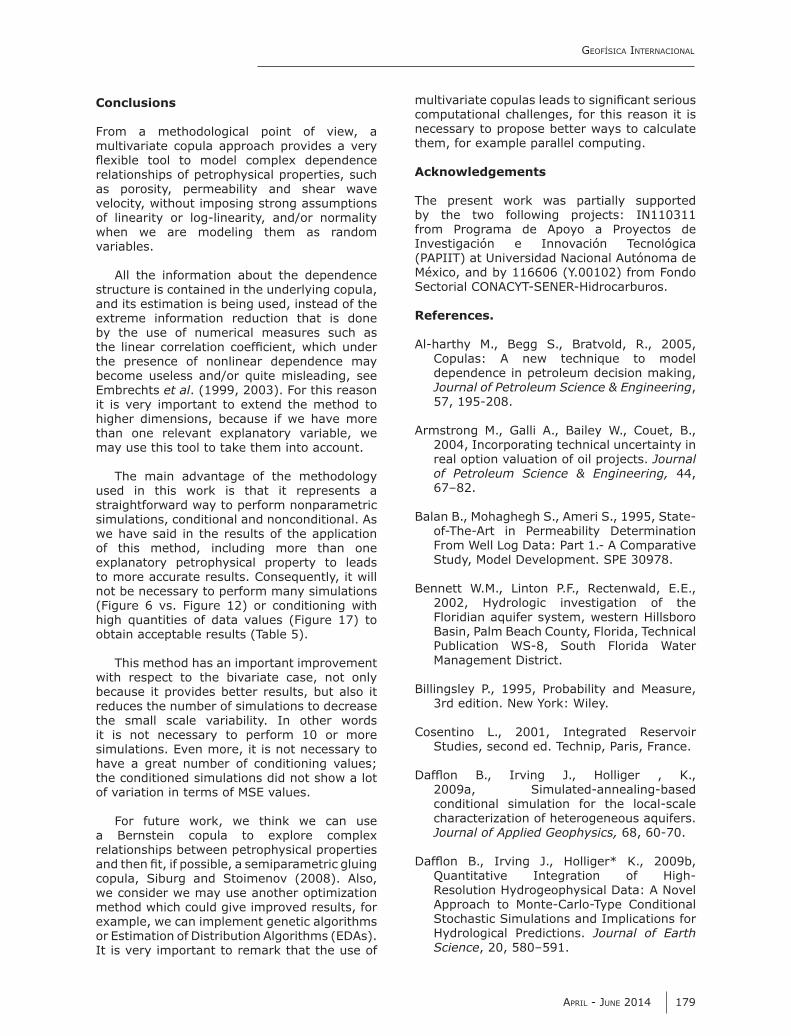
simulations are very close to the real data as well (Table 3). The same happens with their most important statistics (Figure 16).
between the real data and these nonconditional
indicative that it is not necessary to perform
GEOFÍSICA INTERNACIONAL
APRIL - JUNE 2014 177
of data storage and computing speed to implement a multidimensional copula. We
a multidimensional empirical copula. Shortly described, this procedure fundamentally solves the two main disadvantages of using nonparametric copulas: it avoids redundant calculation, which increases its speed and just needs to storage the most important values of the generated hypercube.
more dimensions, but the purpose of the article is to show its application to a well log scale, where we have more control and better data quality. Its application to more dimensions will be the subject of future work.
Figure 15. Estimated variogram and
values.
Table 4. simulations
The Bernstein copula (8) requires that the empirical copula be ready to be used all the time, hence, it is necessary to propose
variability, and may be unnecessary.
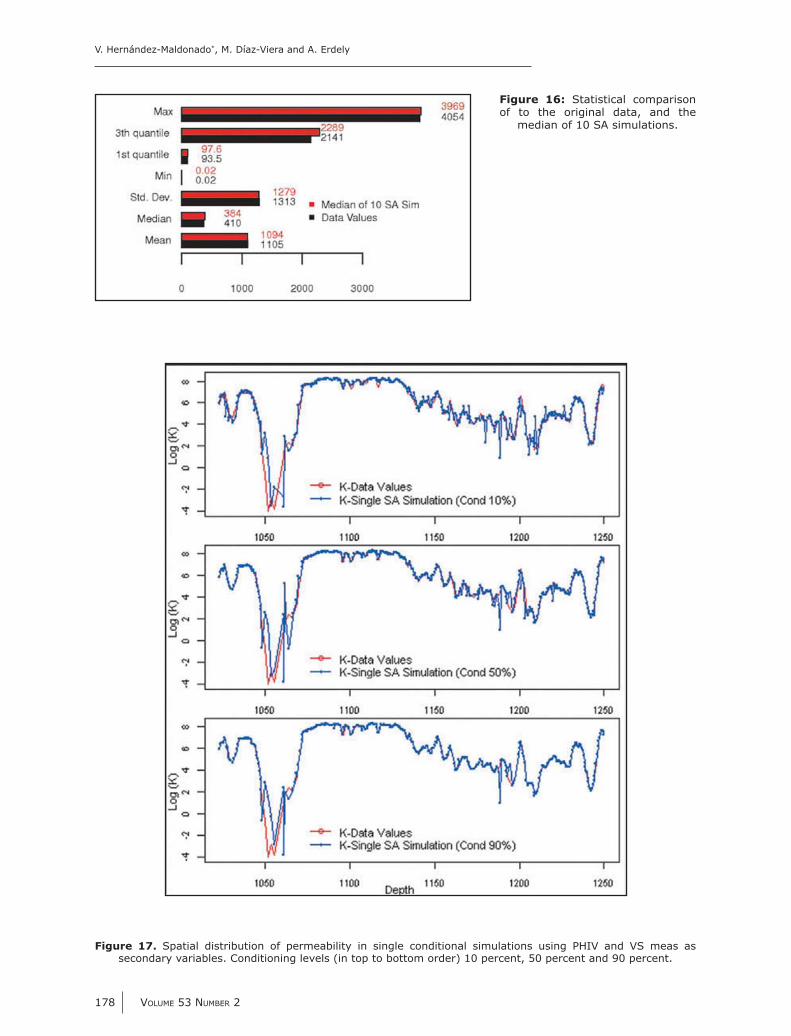
Finally we perform conditional simulations
study the effect of different percentage of conditioning values. Figure 17 shows the results of the spatial distribution of the permeability in various percentages of conditioning values, from top to bottom order, it is conditioned to 10 percent, 50 percent and 90 percent of the conditioning data values. Note that results are, graphically, very similar to real data and their
that the proposed method in a multivariate fashion does not require big amounts of conditioning data to have consistent results.
Table. 5.simulations.
*
178 VOLUME 53 NUMBER 2
Figure 17. Spatial distribution of permeability in single conditional simulations using PHIV and VS meas as secondary variables. Conditioning levels (in top to bottom order) 10 percent, 50 percent and 90 percent.
Figure 16: Statistical comparison of to the original data, and the
GEOFÍSICA INTERNACIONAL
APRIL - JUNE 2014 179
Conclusions
From a methodological point of view, a multivariate copula approach provides a very
relationships of petrophysical properties, such as porosity, permeability and shear wave velocity, without imposing strong assumptions
when we are modeling them as random variables.
structure is contained in the underlying copula, and its estimation is being used, instead of the
by the use of numerical measures such as
the presence of nonlinear dependence may become useless and/or quite misleading, see Embrechts et al. (1999, 2003). For this reason
higher dimensions, because if we have more
may use this tool to take them into account.
The main advantage of the methodology used in this work is that it represents a straightforward way to perform nonparametric
we have said in the results of the application of this method, including more than one
to more accurate results. Consequently, it will not be necessary to perform many simulations (Figure 6 vs. Figure 12) or conditioning with high quantities of data values (Figure 17) to obtain acceptable results (Table 5).
This method has an important improvement with respect to the bivariate case, not only because it provides better results, but also it reduces the number of simulations to decrease the small scale variability. In other words it is not necessary to perform 10 or more simulations. Even more, it is not necessary to have a great number of conditioning values; the conditioned simulations did not show a lot
For future work, we think we can use
relationships between petrophysical properties
we consider we may use another optimization method which could give improved results, for
It is very important to remark that the use of
computational challenges, for this reason it is necessary to propose better ways to calculate
Acknowledgements
The present work was partially supported by the two following projects: IN110311
Investigación e Innovación Tecnológica
References.
dependence in petroleum decision making, Journal of Petroleum Science & Engineering,
real option valuation of oil projects. Journal of Petroleum Science & Engineering,67–82.
2002, Hydrologic investigation of the Floridian aquifer system, western Hillsboro Basin, Palm Beach County, Florida, Technical
Cosentino L., 2001, Integrated Reservoir Studies, second ed. Technip, Paris, France.
characterization of heterogeneous aquifers. Journal of Applied Geophysics,
Stochastic Simulations and Implications for Hydrological Predictions. Journal of Earth Science, 20, 580–591.
*
180 VOLUME 53 NUMBER 2
stochastic estimation of porosity
penetrating radar velocity tomograms in
sequential simulation approaches. Water Resources Research
dependence with copulas: a useful tool for Journal
of Petroleum Science & Engineering,
empirique et ses porpriétés. Un test
Integration of Geological and Engineering
dependency patterns of petrophysical
Stochastic modeling of permeability in double porosity carbonates applying a
Symposium.
Germany.
and semiparametric bivariate modeling of
(P Jaworski et al. eds), Lecture Notes in
Correlation: pitfalls and alternatives, Risk
applications to risk management. In S.
modeling. Journal of Petroleum Technology,
simulation method using the Bernstein
nonlinear dependence structures between petrophysical properties. Journal of Petroleum Science & Engineering,
theory. In N.I. Fisher and P.K. Sen (eds) The
October.
reservoir mapping. Journal of Petroleum Technology
an alternative to cokriging and traditional regression. In Report 3, Stanford Center for
Joint inversion of acoustic and resistivity data for carbonate microstructure evaluation, it Petrophysics
Parra J., 2006, Carbonate microstructure determination by inversion of acoustic and electrical data: application to a South Florida
J. Appl. Geophys
R.N., 1996, Reservoir Characterization

GEOFÍSICA INTERNACIONAL
APRIL - JUNE 2014 181
Estimating the quantile function by Bernstein polynomials, Computational Statistics and Data Analysis
resonance and acoustic measurements for
Oklahoma.
Parra J.O., Hackert C.L., 2002, Permeability and porosity images based on crosswell
carbonate aquifer at the Hillsboro site,
copula and its applications to modeling and
of distributions with given marginals via
pointwise convergence theory. Journal of Multivariate Analysis
for copulas. Journal of Mathematical Analysis and Applications
Simulation Based on Principal Component
dimensions et leurs marges, Publ. Inst.